
Recommended
More Related Content
More from WS200017
More from WS200017 (20)
Font pie chart and survey results
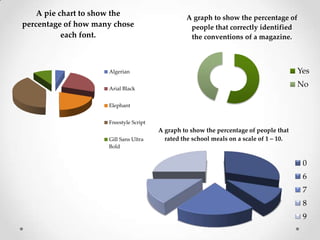
- 1. A pie chart to show the A graph to show the percentage of percentage of how many chose people that correctly identified each font. the conventions of a magazine. Algerian Yes Arial Black No Elephant Freestyle Script A graph to show the percentage of people that Gill Sans Ultra rated the school meals on a scale of 1 – 10. Bold 0 6 7 8 9