
Recommended
Recommended
More Related Content
Similar to Operation Analytics and Investigating Metric Spike (1).pdf
Similar to Operation Analytics and Investigating Metric Spike (1).pdf (20)
More from VaibhaviKhedekar1
Recently uploaded
Recently uploaded (20)
Operation Analytics and Investigating Metric Spike (1).pdf
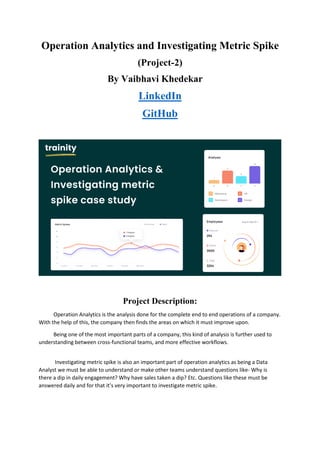
- 1. Operation Analytics and Investigating Metric Spike (Project-2) LinkedIn GitHub Project Description: Operation Analytics is the analysis done for the complete end to end operations of a company. With the help of this, the company then finds the areas on which it must improve upon. Being one of the most important parts of a company, this kind of analysis is further used to understanding between cross-functional teams, and more effective workflows. Investigating metric spike is also an important part of operation analytics as being a Data Analyst we must be able to understand or make other teams understand questions like- Why is there a dip in daily engagement? Why have sales taken a dip? Etc. Questions like these must be answered daily and for that it’s very important to investigate metric spike. By Vaibhavi Khedekar
- 2. I am working for a company like Microsoft designated as Data Analyst Lead and is provided with different data sets, tables from which I must derive certain insights out of it and answer the questions asked by different departments. The things that we are going to find out through the projects are: • Number of jobs reviewed • Throughput • Percentage share of each language • Duplicate rows • User Engagement • User Growth • Weekly Retention • Weekly Engagement • Email Engagement Approach: Firstly, I spent some time on understanding the data/table given. I cleared the questions which was in my mind like what does the job_id, actor_id, event means and what are the things to consider while reviewing the data. I use SQL to derive different insights from the dataset provided by the management team. I first created a database “operation_analytics” and then the tables using the structure and links provided by the team. Then, we performed analysis to generate valuable insights for the company. Execution: Case Study 1 (Job Data): A. Number of jobs reviewed: Amount of jobs reviewed over time. My task: Calculate the number of jobs reviewed per hour per day for November 2020? select count(distinct job_id)/(30*24) as num_jobs_reviewed from job_data where ds between '2020-11-01' and '2020-11-30'; B. Throughput: It is the no. of events happening per second. My task: Let’s say the above metric is called throughput. Calculate 7 day rolling average of throughput? For throughput, do you prefer daily metric or 7-day rolling and why? select ds, jobs_reviewed, avg(jobs_reviewed)over(order by ds rows between 6 preceding and current row) as throughput_7_rolling_avg from ( select ds, count(distinct job_id) as jobs_reviewed From job_data where ds between '2020-11-01' and '2020-11-30' group by ds order by ds )a;
- 3. C. Percentage share of each language: Share of each language for different contents. My task: Calculate the percentage share of each language in the last 30 days? select language, num_jobs, 100.0* num_jobs/total_jobs as pct_share_jobs from ( select language, count(distinct job_id) as num_jobs from job_data group by language )a cross join ( select count(distinct job_id) as total_jobs from job_data )b; D. Duplicate rows: Rows that have the same value present in them. My task: Let’s say you see some duplicate rows in the data. How will you display duplicates from the table? select * from ( select *, row_number()over(partition by job_id) as rownum from job_data )a where rownum>1; Case Study 2 (Investigating metric spike): A. User Engagement: To measure the activeness of a user. Measuring if the user finds quality in a product/service. My task: Calculate the weekly user engagement? select extract(week from occurred_at) as num_week, count(distinct user_id) as no_of_distinct_user from tutorial.yammer_events group by num_week; B. User Growth: Amount of users growing over time for a product. My task: Calculate the user growth for product? select year, num_week, num_active_users, sum(num_active_users) over(order by year, num_week rows between unbounded preceding and current row) as cumm_active_users from (select extract(year from a.activated_at) as year, extract(week from a.activated_at)as num_week, count(distinct user_id) as num_active_users from tutorial.yammer_users a
- 4. where state='active' group by year, num_week order by year, num_week )a; C. Weekly Retention: Users getting retained weekly after signing-up for a product. My task: Calculate the weekly retention of users-sign up cohort? select count(user_id), sum(case when retention_week = 1 then 1 else 0 end) as per_week_retention from ( select a.user_id, a.sign_up_week, b.engagement_week, b.engagement_week - a.sign_up_week as retention_week from ( (select distinct user_id, extract(week from occured_at) as sign_up_week from tutorial.yammer_events where event_type = 'signup_flow' and event_name = 'complete_signup' and extract(week from occured_at)=18)a left join (select distinct user_id, extract(week from occured_at) as engagement_week from tutorial.yammer_events where event_type = 'engagement')b on a.user_id = b.user_id ) group by user_id order by user_id; D. Weekly Engagement: To measure the activeness of a user. Measuring if the user finds quality in a product/service weekly. My task: Calculate the weekly engagement per device? select extract(year from occured_at) as year_num, extract(week from occured_at) as week_num, device, count(distinct user_id) as no_of_users from tutorial.yammer_events where event_type = 'engagement' group by 1,2,3 order by 1,2,3; E. Email Engagement: Users engaging with the email service. My task: Calculate the email engagement metrics? select 100.0 * sum(case when email_cat = 'email_opened' then 1 else 0 end) /sum(case when email_cat = 'email_sent' then 1 else 0 end) as email_opening_rate, 100.0 * sum(case when email_cat = 'email_clicked' then 1 else 0 end) /sum(case when email_cat = 'email_sent' then 1 else 0 end)
- 5. as email_clicking_rate from ( select *, case when action in ('sent_weekly_digest', 'sent_reengagement_email') then 'email_sent' when action in ('email_open') then 'email_opened' when action in ('email_clickthrough') then 'email_clicked' end as email_cat from tutorial.yammer_events )a; Tech-Stack Used: • MySQL Workbench (Version 8.0 CE): MySQL Workbench provides data modelling, SQL development, and various administration tools for configuration. It also offers a graphical interface to work with the databases in a structured way. It is easy and free to use MySQL to create a database and perform analysis answering the questions given in the description. • Mode.com: It perform advanced analytics quickly and deliver valuable insights. It does not required any download and installation. We can connect our data warehouse with Mode. I performed case study 2 (investigating metric spike) in Mode. • Microsoft Word 2021: It is used to make a report (PDF) to be presented to the leadership team. Insights: Case Study 1 (Job Data): • The number of distinct jobs reviewed per hour per day for November 2020 is 83%. • We used the 7-day rolling average of throughput as it gives the average for all the days right from day 1 to day 7 whereas, daily metric gives the average for only that particular day itself. • The percentage share of Persian language is the most (37.5%). • There are two duplicate rows if we partition the data by job_id. But if we look the overall columns, all the rows are unique. Case Study 2 (Investigating metric spike): • The weekly user engagement increased from week 18th to week 31st and then started declining from then onwards. This means that some of the users do not find much quality in the product/service in the last of the weeks. • There are in total 9381 active users from 1st week of 2013 to the 35th week of 2014. • The overall count of weekly engagement per device used is the most for MacBook users and iPhone users. • The email opening rate is around 34% and email clicking rate is around 15%. The users are engaging with the email service which is good for the company to expand.
- 6. Result: In this project, I learned how to apply advanced SQL concepts like Windows Functions, etc. I understood how the real-world industry works. It helped me in mastering my SQL concepts. I learned how to ask the right questions given the circumstances. From the given data and questions, which columns to consider and how to find the valuable insights which help the business to grow. I learned how the company find different areas related to the company to improve it further. I got to know about investigating metric spike (why there is a boom and why there is a dip). SQL Query Link: • Case study 1 (Operation Analytics): Operation Analytics SQL Query • Case study 2 (Investigating Metric Spike): Investigating Metric Spikes SQL Query