1. Tyler A. Bailey
NE 120
12/5/2016
SRIM Calculations Applied to Ionization Chambers
I: Introduction
SRIM is a Monte Carlo code used primarily to simulate the range and stopping of ions in
matter. When used, the software takes into account the species of the ion, the energy of the ion,
the elemental composition of the target, and the phase of the target. SRIM is capable of
simulating both solid and gas targets. In spite of this, the amount of gases that can be modeled
with SRIM is limited due to lack of general theory and experimental data. Gases that can be
modeled accurately with SRIM and that are utilized for this experiment are argon, helium,
hydrogen, nitrogen, air, oxygen, and methane gas. The purpose of this project was to use SRIM
to simulate which gas would be optimal to be used inside an ionization chamber that is geared
for detecting alpha particles, is portable, and yields a sizeable voltage pulse for each incident
alpha particle. Characteristics for this optimal gas that were evaluated are the projected range of
an ion in the gas, the amount of ion pairs produced in the gas, and the energy loss of the recoiling
gas ions.
II: Ionization Chamber Fundamentals
Ionization chambers detect radiation by utilizing an electric field to separate ions from
their electrons after being ionized by incident radiation. From here the separated electrons are
usually used to form a signal in the form of voltage or current. Ions can also be used, but
2. electrons give a better time response since they move faster under the influence of an electric
field due to the differences in mass between electrons and ions. In general, it takes ions on the
order of milliseconds to reach the electrodes of the chamber while it takes electrons on the order
of microseconds to travel the same distance. There are two main modes of ionization chamber
operation: current mode and pulse mode. Current mode is when the electrons are converted into a
current, and the current is then manipulated and detected. This is fundamentally how standard
smoke detectors operate with an Americium-241 source. Pulse mode is when the electrons are
converted into a voltage pulse (by use of a resistor-capacitor circuit), and the voltage pulse is
then manipulated and detected. A pulse mode detector is simulated for this project. Other
characteristics of the chamber that are modeled for this project are that the chamber is operated at
standard temperature and pressure (SRIM assumes standard temperature and pressure for its
simulations), only alpha particles are simulated (ionization chambers can detect any type of
decay, however SRIM is only able to simulate alpha particles without downloading extra
packages), the source is put inside a closed chamber (this is to ensure that the incident ion
deposits its energy in the gas within the chamber), and recombination between ions and electrons
is negligible (this is true when a large enough electric field is established between chamber the
electrodes).
III.1: Stopping Power Fundamentals
One of the features that was utilized from SRIM was the ionization feature. This feature
outputs a graph and text file of ionization (in unit of eV/angstrom) versus range in matter. In
detection literature, this quantity is referred to as linear stopping power. Linear stopping power is
3. defined as the differential energy loss for a charged particle moving through a material divided
by the differential path length (Equation 1).
S= −
ⅆ𝐸
ⅆ𝑥
(Equation 1)
The value along the trajectory of the particle is referred to as its specific energy loss. This
quantity is further described by the Bethe formula (Equation 2).
𝑆 =
4𝜋ⅇ4 𝑧2
𝑚0 𝑣2 𝑁𝐵 (Equation 2a)
𝐵 = 𝑍[ln(
2𝑚 𝑜 𝑣2
𝐼
) – ln(1 -
𝑣2
𝑐2
) -
𝑣2
𝑐2
] (Equation 2b)
N is the density of the material while Z is the atomic number of the material. 𝑚 𝑜, 𝑒 is the mass
and charge of the electron while z and v are the charge and velocity of the particle respectively. I
is the Ionization Potential of the material. The Bethe formula is applicable for both gas and solid
targets. Since this project is only concerned with gases (N is typically low for gases at standard
temperature and pressure) and alpha particle at non-relativistic velocities (this causes the second
and third term of Equation 2b to become negligible), the most important term is the atomic
number of the gas particles. The higher the atomic number of the gas particles, the larger the
specific energy loss.
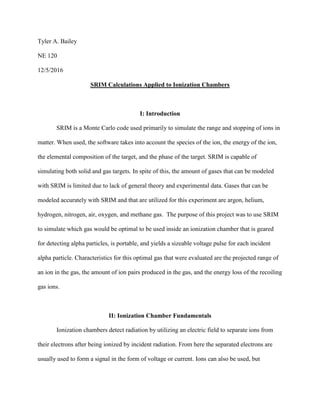
4. Figure 1
Figure 2
Simulated ionization data for a 5.3 MeV alpha particle in air and the recoiling air ions’
ionization data are plotted in Figure 1 and Figure 2. Figure 1 is reminiscent of the Bethe
formula for this specific particle and target. For the majority of the ions trajectory, the
5. specific energy loss rises steadily but slowly. Towards the end of the trajectory, the particle’s
specific energy loss rises rapidly and reaches a peak (this is due to the square of the velocity
in the denominator and that the ion is effectively in the vicinity of the gas particles for a
relatively longer period of time). At the end of the trajectory, for the case of an alpha particle,
the alpha particle picks up 2 electrons becoming neutral and its specific energy loss drops to
0. From comparing the ionization values for Figure 2 to Figure 1, it is clear that the specific
energy loss due to recoiling air ions is negligible compared to the incident radiation (the
specific energy loss for the incident particles are about 2 orders of magnitude larger than the
specific energy loss for recoiling air ions). It is still imperative to ensure that the recoiling gas
ions’ specific energy loss is minimized in order to minimize the noise created from the ion
pairs formed from the recoiling gas ions.
III.2: Experimental Results
Figure 3
0.00E+00
2.00E+04
4.00E+04
6.00E+04
8.00E+04
1.00E+05
1.20E+05
1.40E+05
Ar He H2 N2 Air O2 CH4
ionization(eV/mm)
Gas
Average Ionization
6. Figure 4
Figure 5
Average ionization, peak ionization, and projected range for 5.3 MeV alpha particles in
different gases are displayed in Figure 3, Figure 4 and Figure 5 respectively. In Figure 3 and
Figure 4, it is clear that every gas besides helium and hydrogen have similar average
0
50000
100000
150000
200000
250000
300000
350000
Ar He H2 N2 Air O2 CH4
PeakIonization(eV/mm)
Gas
Peak Ionization
0
50
100
150
200
250
Ar He H2 N2 Air O2 CH4
ProjectedRange(mm)
Gas
Projected Range
7. ionization values and peak ionization values. The low values for helium and hydrogen are
most likely due to the low atomic number of the gas particles in these two gases. In Figure 5,
it is clear that every gas besides helium and hydrogen stops these 5.3 MeV alpha particles
within 50 millimeters of traveling through the chamber. Helium and hydrogen gas both need
over 150 millimeters to stop these same particles. This depicts an inverse correlation between
peak ionization/average ionization and projected range for given alpha energy.
IV.1: W-Values and Ion Pairs
When the energy is loss by the incident alpha particle, the energy is used to ionize the gas
particles. For different types of incident particles (alphas and betas for example) and different
gases, different amounts of energy are needed to form an ion pair. These values are called W-
Values and are given in units of eV/ion-pairs. Figure 6 below displays W-Values for alpha
particles in different gases. These values were taken from Glenn Knoll’s Radiation Detection
and Measurement.
8. Figure 6
To determine the amount of ion pairs that are formed in each gas, the total energy loss by
the incident particle before neutralizing is needed. This can be done by taking a reiman sum
of the ionization curve like the one located in Figure 1. Similarly, a reiman sum was also
taken of the recoiling gas particles ionization curves like the one located in Figure 2. This is
done to further prove that energy loss of the recoiling gas particles is negligible. After the
reiman sum is taken, the energy loss is then divided by the W-Value for the gas. This yields
the total number of ions formed for each incident particle.
26.3
42.7
36.4 36.4 35.1
32.2
29.1
0
5
10
15
20
25
30
35
40
45
Ar He H2 N2 Air O2 CH4
W-Values(eV/ionpair)
Gas
W-Values (From Knoll)
9. IV.2: Experimental Results
Figure 7
Figure 8
Energy loss due to the ions and recoiling gas ions and ion pairs formed are displayed in
Figure 7 and Figure 8 respectively. From Figure 7, it is clear that the energy loss from the
5280000
5282000
5284000
5286000
5288000
5290000
5292000
5294000
5296000
Ar He H2 N2 Air O2 CH4
AxisTitle
Gas
Reiman Sum Energy Loss Due to Ions and Recoil
Ions Recoil
0
50000
100000
150000
200000
250000
Ar He H2 N2 Air O2 CH4
IonPairsFormed
Gas
Reiman Sum Ion Pairs Formed
10. recoiling gas ions is negligible compared to the energy loss of the incident particle. Argon
and helium recoiling ions have the lowest amount of energy loss for all the gases. From
Figure 8, it is clear that alpha particles in argon gas form the most ion pairs. This is primarily
due to the fact that argon has the smallest W-value compared to the other gases.
V.1: Conversion of Ion Pairs into Voltage
After ion pairs are separated, the electrons need to be converted into a voltage pulse in
order for signal processing to occur. This can be done by a resistor-capacitor circuit. The
electrons induce a current in the chamber’s positive electrode; this current then charges up a
capacitor to a max value. This value is dependent on the capacitance of the capacitor and the
number of ion pairs that were formed as described in Equation 3.
𝑉𝑚 𝑎𝑥 =
𝑛∗1.6𝑥10−19
𝐶
(Equation 3)
In order to ensure that only the electrons are charging up the capacitor, an RC time constant is
chosen that is between the ion travel time and the electron travel time. In reality though, the
voltage will have a slightly smaller voltage peak due to geometrical characteristics of the
chamber and the initial trajectory of the ion.
11. V.2: Experimental Results
Figure 9
The peak voltage of a 5.3 MeV alpha particle for different gases is displayed in Figure 9.
The capacitance that was used was 100 picofarads. From this data, it is clear that argon has the
highest peak voltage. Although the voltage pulses are quite small (they are in the hundreds of
microvolts range), they can easily be amplified by a Darlington configuration transistor
(cascaded bipolar junction transistors) to get the voltage pulses in the hundreds of millivolts
range.
VI: Conclusion
Through this analysis with SRIM, it is clear that argon gas is the optimal gas for a
portable ionization chamber for the purpose of detecting alpha particles. One reason why this is
concluded is that it was simulated that 5.3 MeV alpha particles (which is in the middle of the
alpha energy range) have a projected range of less than 50 millimeters. This allows the ionization
chamber to be small and portable while still allowing alpha particles to deposit their energy in
0
0.00005
0.0001
0.00015
0.0002
0.00025
0.0003
0.00035
0.0004
Ar He H2 N2 Air O2 CH4
Voltage(V)
Gas
Peak Voltage
12. the chamber’s gas and neutralizing before they reach the walls of the detector. Another
characteristic that was calculated for argon gas is that the recoiling argon ions deposit minimal
energy within the gas. This minimizes the voltage signal which would be interpreted as noise in
the signal processing that would occur after collection. The final characteristic that was
calculated for argon gas is that it produces the most ion pairs for given alpha energy. This will
create a larger un-amplified voltage pulse for each incident particle. This is desirable for alpha
spectroscopy purposes. The main downside of using argon gas is the cost of obtaining the gas
compared to just using ambient air. Despite this downside, if portability and large voltage pulse
is wanted for an ionization chamber, argon is the best candidate based on SRIM calculations.
VII: References
Knoll, Glenn. Radiation Detection and Measurement. John Wiley & Sons, Inc., 2000.