IATA air freight analysis
•
1 like•644 views

The International Air Transport Association (IATA) released data for global air freight markets showing that in August 2015 freight markets stabilized after two months of decline. Measured in Freight Tonne Kilometers, air cargo volumes rose 0.2% compared to the same month a year ago. This is a modest improvement on July performance when freight demand contracted by 0.6% year-over-year. More like this on www.transportworldafrica.co.za

Recommended
Recommended
More Related Content
What's hot
What's hot (20)
Similar to IATA air freight analysis
Similar to IATA air freight analysis (20)
More from Tristan Wiggill
More from Tristan Wiggill (20)
Recently uploaded
Recently uploaded (20)
IATA air freight analysis
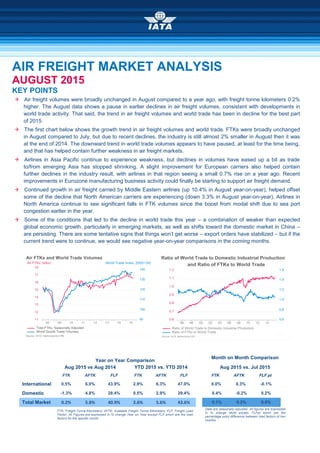
- 1. AIR FREIGHT MARKET ANALYSIS AUGUST 2015 KEY POINTS Air freight volumes were broadly unchanged in August compared to a year ago, with freight tonne kilometers 0.2% higher. The August data shows a pause in earlier declines in air freight volumes, consistent with developments in world trade activity. That said, the trend in air freight volumes and world trade has been in decline for the best part of 2015. The first chart below shows the growth trend in air freight volumes and world trade. FTKs were broadly unchanged in August compared to July, but due to recent declines, the industry is still almost 2% smaller in August then it was at the end of 2014. The downward trend in world trade volumes appears to have paused, at least for the time being, and that has helped contain further weakness in air freight markets. Airlines in Asia Pacific continue to experience weakness, but declines in volumes have eased up a bit as trade to/from emerging Asia has stopped shrinking. A slight improvement for European carriers also helped contain further declines in the industry result, with airlines in that region seeing a small 0.7% rise on a year ago. Recent improvements in Eurozone manufacturing business activity could finally be starting to support air freight demand. Continued growth in air freight carried by Middle Eastern airlines (up 10.4% in August year-on-year), helped offset some of the decline that North American carriers are experiencing (down 3.3% in August year-on-year). Airlines in North America continue to see significant falls in FTK volumes since the boost from modal shift due to sea port congestion earlier in the year. Some of the conditions that led to the decline in world trade this year – a combination of weaker than expected global economic growth, particularly in emerging markets, as well as shifts toward the domestic market in China – are persisting. There are some tentative signs that things won’t get worse – export orders have stabilized – but if the current trend were to continue, we would see negative year-on-year comparisons in the coming months. Year on Year Comparison Month on Month Comparison Aug 2015 vs Aug 2014 YTD 2015 vs. YTD 2014 Aug 2015 vs. Jul 2015 FTK AFTK FLF FTK AFTK FLF FTK AFTK FLF pt International 0.5% 6.0% 43.9% 2.9% 6.3% 47.0% 0.0% 0.3% -0.1% Domestic -1.3% 4.8% 28.4% 0.5% 2.9% 29.4% 0.4% -0.2% 0.2% Total Market 0.2% 5.8% 40.9% 2.6% 5.6% 43.6% 0.1% 0.2% 0.0% FTK: Freight-Tonne-Kilometers; AFTK: Available Freight Tonne Kilometers; FLF: Freight Load Factor; All Figures are expressed in % change Year on Year except FLF which are the load factors for the specific month. Data are seasonally adjusted. All figures are expressed in % change MoM except, FLFpt which are the percentage point difference between load factors of two months.
- 2. Air Freight Market Analysis August 2015 The first chart above shows the trend in FTK volumes after adjusting for seasonal and holiday impacts. FTKs were broadly unchanged in August compared to July, but due to recent declines, the industry is still almost 2% smaller in August then it was at the end of 2014. The downward trend in world trade volumes appears to have paused, at least for the time being, and that has helped contain further weakness in air freight markets. During the recent past, declines in trade have resulted from weaker than expected global economic growth as well as focal shifts in some economies. Global economic growth has softened due to slower growth in China as well as emerging markets in South America, including Brazil and Argentina. The sluggish demand backdrop has been compounded by China’s shift in focus toward its domestic market as well as the US’s support of its own manufacturing sector. On a more positive note, the latest (July) data has shown that declines in trade to/from Emerging Asia appear to have bottomed out, or at least paused. Airlines in Asia Pacific experienced a 1.0% fall in FTKs in August year-on- year, but that is a slight improvement on the July 2.0% drop. Given recent developments in China, with the manufacturing sector struggling over recent months and declines in export orders, it is too early to say that this is the end of the weakness in trade and air freight. But there also is no sign of further weakness. Carriers in North America recorded a decline in FTKs of 3.3% in August year-on-year. Airlines in this region have experienced a significant decline in FTK volumes since the boost from modal shift due to sea port congestion earlier in the year. Shippers had relied heavily on air cargo to avoid delays from US container port congestion from November through March. But now, with no congestion at West Coast sea ports, demand for air freight transport has been easing off. More fundamentally, although better economic performance is expected in H2, we are yet to see any benefits by way of stronger demand for air freight transport. Growth in air freight carried by Middle Eastern carriers supported the industry result in August, with airlines in that region recording a 10.4% rise on a year ago. Major economies in the Middle East, including Saudi Arabia and the United Arab Emirates, have seen slowdowns in non-oil sectors in Q2 2015 (Markit), but the rates of growth remain robust and this should help sustain solid growth in air freight demand for local carriers. A slight improvement for European carriers also helped contain further declines, with airlines in that region seeing a slight 0.7% rise on a year ago. Recent improvements in manufacturing business activity could finally be starting to support air freight demand. In Latin America, the region’s carriers recorded a big fall of 7.3% in August. Although key economies like Brazil and Argentina continue to struggle, regional trade activity has bucked the global trend with solid gains during H1 2015. Unfortunately, this trade activity has not benefitted air freight transport, as of yet. African airlines, carrying a small part of worldwide FTKs, recorded a rise in FTKs of 2.3% in August year-on-year. From the perspective of demand drivers, major economies Nigeria and South Africa underperformed during parts of 2015, however, regional trade activity is holding up, which should support demand for air transport of goods.
- 3. Air Freight Market Analysis August 2015 ANNEX Year on Year Comparison Aug 2015 vs. Aug 2014 YTD 2015 vs. YTD 2014 FTK AFTK FLF FTK AFTK FLF Africa 2.4% 11.3% 26.7% 4.2% 3.5% 31.0% Asia/Pacific -0.9% 4.9% 54.1% 3.5% 6.0% 56.8% Europe 1.0% 3.3% 42.9% -0.1% 3.3% 46.1% Latin America -7.0% 1.9% 38.6% -7.1% 0.0% 40.8% Middle East 10.4% 14.4% 40.7% 13.5% 18.4% 42.7% North America -5.5% 4.2% 33.6% -2.3% 2.3% 37.6% International 0.5% 6.0% 43.9% 2.9% 6.3% 47.0% Africa 2.3% 10.6% 25.6% 4.0% 3.5% 29.7% Asia/Pacific -1.0% 4.9% 51.1% 3.6% 6.1% 53.4% Europe 0.7% 3.9% 41.4% -0.4% 3.5% 44.7% Latin America -7.3% 0.8% 35.3% -6.8% 2.6% 37.2% Middle East 10.4% 14.3% 40.4% 13.4% 18.2% 42.4% North America -3.3% 4.4% 30.8% -1.5% 1.4% 33.5% Total Market 0.2% 5.8% 40.9% 2.6% 5.6% 43.6% FTK: Freight-Tonne-Kilometers; AFTK: Available Freight Tonne Kilometers; FLF: Freight Load Factor; All Figures are expressed in % change Year on Year except FLF which are the load factors for the specific month. Month on Month Comparison Aug 2015 vs. Jul 2015 Market Share FTK AFTK FLFpt FTK Africa 0.3% 2.3% -30.4% 1.7% Asia/Pacific 0.2% 0.8% -56.0% 39.5% Europe 0.3% 0.6% -46.2% 26.3% Latin America -2.7% -2.2% -41.4% 2.6% Middle East 0.1% -0.9% -42.5% 16.3% North America -0.2% 0.2% -36.7% 13.5% International 0.0% 0.3% -0.1% 100.0% Africa 0.1% 2.2% -0.6% 1.5% Asia/Pacific 0.1% 0.4% -0.2% 38.5% Europe 0.2% 0.6% -0.2% 23.2% Latin America -2.6% -1.6% -0.4% 2.6% Middle East 0.1% -0.9% 0.0% 14.2% North America 0.4% 0.3% 0.0% 20.1% Total Market 0.1% 0.2% 0.0% 100.0% Data are seasonally adjusted. All Figures are expressed in % change Month on Month except PLP pt and FLF which are the percentage point difference between load factors of two consecutive months. Julie Perovic E-Mail: perovicj@iata.org 30 TH September 2015 Terms and Conditions for the use of this IATA Economics Report and its contents can be found here: http://www.iata.org/economics-terms By using this IATA Economics Report and its contents in any manner, you agree that the IATA Economics Report Terms and Conditions apply to you and agree to abide by them. If you do not accept these Terms and Conditions, do not use this report. FURTHER ANALYSIS AND DATA Access data related to this briefing through the Monthly Statistics publication: http://www.iata.org/monthly-traffic-statistics NEW RELEASE ALERTS To receive email notification of new analysis from IATA Economics, select ‘Economic Briefings’ from: www.iata.org/optin