1. 1
Autonomous Roving Vehicle for Crop Yield
Improvement - Team DC1
Final Report
Sponsored by:
Iowa State University Department of
Mechanical Engineering Department of
Agronomy
For:
Dr. Asheesh Singh
Dr. Arti Singh
Dr. Baskar Ganapathysubramanian
Prepared by:
Ryan Tweedt
Robert Bromberek Zheng
Yi Liew
Todd Heidrich
Travis Heidrich
2. 2
May 5th, 2015
Table of Contents
Contents
List of Figures …………………………………………………………. 3
List of Tables …………………………………………………………... 3
Executive Summary …………………………………………………… 4
Introduction ……………………………………………………………. 5
Design Evolution ………………………………………………………. 6
Detailed Design of Lead Concept ……………………………………… 8
Implementation of Process or Design ………………………………….. 11
Cost Analysis …………………………………………………………... 12
Conclusions Future Work ……………………………………………..13
Appendix ………………………………………………………………. 14
References ……………………………………………………………... 24
3. 3
List of Figures
Figure 1- Peg Leg Frame Pg 6
Figure 2- Rocker Frame Pg 7
Figure 3- Articulating Leg Frame Pg 8
Figure 4- ARV Isometric View Pg 10
Figure 5- ARV Front View Pg 10
Figure 6- Bill of Material Cost Breakdown Pg 13
List of Tables
Table 1- Customer Requirements met by design Pg 9
Table 2- Summary of Bill of Material for ARV Final Design Pg 13
4. 4
Executive Summary
In an effort to increase crop yield of soybeans annually to aid in the demand for food, feed and
fuel, Dr. Asheesh K Singh, Dr. Arti Singh and Dr. B. Ganapathysubramanian have begun a
project to design an autonomous roving vehicle to collect phenotype data. This data is intended
to provide data regarding what soybean plants and their associated genotypes are the most robust
and resilient to stressors experienced during their full term growth. In theory by crossing the
genetic traits of the optimal soybean plants the next generation will be produce greater
environmental defenses while maturing.
The project was divided up among the Automated Ground Vehicle Team (DC1) and the
Manually Ground Vehicle Team (DC2). Team DC1 was responsible to design and autonomous
roving vehicle to collect accurate phenotype data on soybeans. This report provides a detailed
summary of the design and quantified elements of the autonomous roving vehicle. The design
objectives and constraints associated with DC1 were described in a Project Proposal Form.
DC1 was required to design a robotic system that is capable of traversing the soybean field. The
system must keep the sensory package level with a maximum angle of 10 degrees when under
the climbing a 30 degree grade and traversing a 6 in step up in terrain. The robotic system must
be capable geotagging individual plants as data is collected. Also, the design should use the same
or similar camera system as DC2’s design. The robotic system is designed to perform these
functions and achieve these constraints for an extended period of operation time.
The final design of the chassis of the robotic rover has been completed and proposed by the ME
415 Undergraduate Team DC1. The final design of the robotic rover is a rocker bogie with four
separate track systems, two generators and is compatible with DC1’s sensory camera package.
Three mathematical models were constructed using MATLAB. The first model analyzed ground
pressure which produced a ground pressure for all four tracks of 1.6 kN. The second model
analyzed vehicle tilt under the worst case scenario where the rover is climbing a 30 degree grade
and traversing a 6 in jump in terrain. The result showed the sensory package’s tilt was 9.9562
degrees. The third model analyzed power consumption under the scenario the rover was climbing
a 30 degree slope. The results showed a power consumption of 1.2917 kW. These math models
were utilized to ensure the final rover design would meet the specified constraints.
5. 5
Introduction
With the growing world population and ever increasing demand for food, feed and fuel there is a
need to increase the annual crop yield of soybean plants. The Agronomy Department at Iowa
State University collects phenotype data on the soybean plants in order to select plants with
desirable genetic traits to be used to cultivate an improved next generation of plants. The purpose
of the team’s project is to develop an autonomous roving vehicle that will navigate the research
fields of the Agronomy department and collect the soybean phenotype data at a faster rate than
the department is currently able to with manual inspection. Gathering data using an unmanned
vehicle provides researchers more data to analyze and more time to analyze it, which will result
in production of better cultivars that will increase crop yield. The data is collected using a
camera system containing Hyperspectral, GoPro and Kinect cameras to give the researchers a
variety of data to analyze. The sponsors of this project have produced detailed constraints and
objects the rover is intended to accomplish and are as follows:
The rover is intended to straddle one or more soybean plant rows while traversing the field and
collect plant or canopy data. The data collected must be accurate and consistent across plants,
with the goal of collecting plant data at a rate of 700 plants/hour. The rover should be able to
overcome a maximum expected variation in terrain is 6 inches and maintain traction in both dry
and wet soil conditions. This involves keeping the camera package parallel with the ground; the
maximum allowable tilt constraint is 10 degrees. Soybean plants should not be damaged during
operation, which requires the rover to clear a maximum of 50 inches and be as thin as possible.
The system must incorporate a Pixie positioning system for navigation and to track individual
plant location on the field, which will be used to tag each image taken. It is required that the
rover will be capable of operating for extended periods of time in the field. Ideally the rover
should use the same or similar camera system designed by the DC2 team with minimal
modifications. The rover is designed to move continuously while collecting data and geotagging
individual plants. Lastly, it is desired for as many off the shelf components to be used as
possible, so that parts can be simply reordered if broken instead of remade. These design
constraints are intended to be accomplished as the rover operates autonomously in the field.
6. 6
Design Evolution
Rover concepts were brainstormed given the customer requirements. Each concept had the
following components: a main chassis/frame, a suspension system, a locomotion system, a power
source, and a connection for the camera package system. The differences between concepts came
from the frame design, the suspension mechanism, and locomotion mechanism. Three main
designs were seriously considered:
1. A “peg leg” frame with straight legs that uses a shock absorber system for suspension.
Figure 1: Peg Leg Frame
7. 7
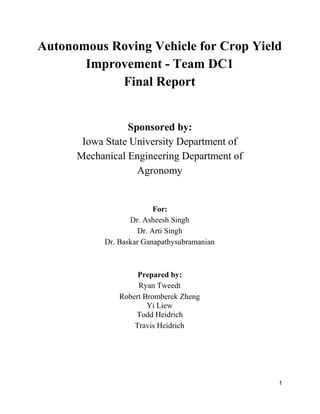
2. A “rocker” frame with angled legs that provide suspension purely mechanically via a
pivot and rocking system based on the Mars Curiosity Rover.
Figure 2: Rocker Frame
3. A frame with articulating legs that are able to swivel so that the width of the vehicle can
be adjusted. This frame uses a shock absorber system for suspension.
8. 8
Figure 3: Articulating Leg Frame
Each design concept could be used with either of the three locomotion concepts: wheels, full
tracks, or ATV tracks (the partial tracks pictured in each of the figures above). Based on the
decision matrix used which rated each concept based on its ability to meet each customer
requirement and how important each requirement is the the customer, the lead concept selected is
the rocker frame with ATV tracks.
The articulating frame provided the ability to operate in rows of varying widths, but this is not an
issue important to the customer and is thus an unnecessary added complexity. The rocker frame
succeeded because of its simple mechanical suspension system that did not require designing and
specifying shock absorbers. Including shock absorbers would be over-engineering the rover since
it will operate at relatively low speeds and smooth terrain.
The wheels provide the benefit of simplicity and cost effectiveness, however do not provide the
traction and surface area needed to traverse various terrain conditions. The full track system does
provide enough traction and surface area, however there are no off the shelf products available
and steering is severely limited. ATV tracks provides the best solution because there are off the
shelf products available, traction and surface area is still significant, and
steering/maneuverability is good.
9. 9
Detailed Design of Lead Concept
Table 1: Customer Requirements Met by Design
Customer Requirements Meets Requirements
Must be fully autonomous Yes
Must be able to link data with particular plants Yes
Must be able to keep cameras stable and level Yes
Must be able to mount the hyperspectral camera Yes
Must be able to mount the Kinect Camera Yes
Must be able to mount at least 1 GoPro camera Yes
Must be able to traverse various terrain/weather conditions Yes
Must not damage plants Partially
Must operate for extended periods of time Yes
Must gather consistent and accurate plant data Yes
Should have enough clearance for full plant height Yes
Should be compatible with the MGV camera mount system Yes
Should be compatible with the MGV shading system No
Should be easy to maintain, store, and operate Yes
Should greatly increase data collection rate Yes
Should be easy to assemble/manufacture Yes
Should be cost effective Yes
Should be easy to access computers and data on board Yes
11. 11
11
For the Rocker Track design’s primary structural material, 8020 Aluminium extrusion was
chosen. The team felt that this material would be the best for off-the-shelf part selection,
flexibility with design and future modifications, as well as with cost and manufacturing. By
using 8020 extrusion and McMaster Carr parts, only a few customized parts will need to be
fabricated to complete the design. The detailed drawings of these customized parts are attached
in the Appendix.
A major area of success with the selected design is the rocker bogie suspension including a
differential control bar. The differential control bar can be viewed in both figures 4 and 5. This
allowed for a direct linkage between both rocker bogies. The action is as so; when the right front
track moves upward the left front track moves downward. Using this design feature in the math
model labeled vehicle tilt in the Appendix DC1 discovered under the worst expected scenario of
a 6 inch terrain variation, the rover’s platform remained under the constraint of 10 degrees.
The areas of concern with DC1’s design are as follows: Must not damage plants and should be
compatible with the MGV’s shading system. The design for an adequate shielding system to
effectively protect the soybean plants as the rover traverses the field was not addressed because
of time constraints. DC1 mainly focused on the rover’s capability to efficiently and effectively
collect soybean data while maintaining a level platform for the sensor system as it traveled over
various terrain environments. The sprocket drive trains, areas around the generator mount and all
four tracks would also be design features of the rover that would require shielding. DC1 suggests
that upon fabrication the use of a heat formed plastic shields for the design features discussed
above a cost effective and effective solution. The rover is not compatible with the MGV team’s
shading system simply because the MGV team did not design one.
For drive and steering motors, the design team differed final selection to the future team that will
be working with the controls and electronics. Specifications for the drive motors were found with
the math model, and any ½ Horsepower motor capable of outputting 1300 in*lbf of torque on the
track axles will suffice. These motors are mounted as shown in the CAD assembly and in figures
4 and 5, and connected to the the track axle through a chain and sprocket. Additional speed
reduction of the motor output can be done by adjusting the sprocket ratio, so specific sprockets
were not selected for the Bill of Materials.
DFMEA: When analysing various failure modes DC1 discovered concerns with the use of tires
on the rover and realized potential failure with traction and rolling resistance. The proposed
solution to mitigate these failures was to replace the tires with tracks. There was also great
concern regarding excessive contact with plants. The team intended to design a shielding system,
but under the time constraint of various deadlines, DC1 was unable to address this problem.
12. 12
12
DC1 also discovered concerns with the possibility of insufficient power. To ensure sufficient
power is provided to the rover DC1 incorporated two generators (2.2 kW each).
Implementation of Process or Design
The track mount can only be specified when the Mattracks XT series is purchased as Mattracks
could not provide detailed drawings for the tracks due to confidential issue. The brackets that
hold the tracks and motors are made by welding two ½” stainless steel T304 plate as shown in
the detailed drawings in Appendix. The steering plate is manufactured from stainless steel T-304
bar and the center hole on the plate for the worm gear drive depends on the control team’s
selection of steering system. Other than the customized parts and future decisions needed to be
made by control team, the ARV final design assembly should be pretty straight forward.
Cost Analysis
The table below is the summary of the costs of all the components for the final design of the
ARV and Figure 6 shows the cost breakdown of the total estimated cost. The total cost includes
all components including estimates for the components that the control team has to select. The
total cost gives an upper estimate for the cost needed to build this design ARV, and it may be
possible to reduce significantly. All part numbers are hyperlinked to aid the manufacturing team
to purchase the components or find replacement parts. Labor cost would be variable depending
on the manufacturing team and customized parts. Recurring cost would not include maintenance
costs as the operator is more likely to replace the broken parts. The complete and detailed Bill of
Material is attached in Appendix.
13. 13
13
Table 2. Summary of Bill of Material for ARV Final Design
Summary
Chassis Subtotal $1,525.25
Steering System Subtotal $4,144.30
Rocker Arms Subtotal $566.81
Generator with Mount Subtotal $1,325.78
Mattracks Subtotal $5,538.00
Motors Subtotal $2,200.00
Manufacturing Subtotal $500.00
ARV Total $15,800.14
Figure 6. Bill of Material Cost Breakdown
14. 14
14
Conclusions - Future Work
In summary, the team completed extensive design work with efforts to have the final design
ready to be prototyped, however some future work is still required before this design can be
manufactured.
I. Covers/shielding - To prevent damage to plants and debris infiltration, shielding needs to
be designed to protect the tracks, driving and steering motors, and the accompanying
gears or chain drivetrain.
II. Track and generator dimensions - Specific dimensions for the tracks and generator could
not be acquired - only some general dimensions. The parts will have to be purchased and
measured to get specific dimensions. The generator mount and the track connections
depend on these dimensions, so some minor changes to these systems may be necessary
once dimensions are found.
III. Track mounts - Once tracks are attained and specific geometry is found, the connection
of the tracks to the frame needs to be designed. The material selected for the front and
back track brackets is stainless steel, but a cheaper material may be found suitable after
stress analysis.
IV. Sensors and controls the controls design is out of the team’s scope, and the controls
team responsible for the vehicle’s autonomy will want to have a say in the following
aspects of the design:
A. Final motor selection - drive motors require 0.5 hp, with an output of 1300 lbf-in.
The motor drivetrain ratio may need to be adjusted based on motor selection. The
requirements for the steering motor have not been determined; analysis on the
friction resistance between tracks and soil is needed to determine this. The size of
the steering worm gear may need to be adjusted based on selection.
B. Computer selection and mounting (a spot located next to the generators has been
designated for the computer).
C. Sensor selection, integration, and wiring.
V. Sunlight shielding to maintain consistent lighting for cameras.
VI. Camera system height adjustment - the hyperspectral camera is mounted too high to
capture plants as they are budding from the ground. Either the DC2 (Manual Ground
Vehicle) team’s design of the camera system will need to be adjusted to hang lower, or a
different lens with longer focal length is needed.
VII. Track axle bearings and steering bearings - bearings have been selected, but automotive
wheel bearings should be investigated for better performance.
VIII. Fabrication and assembly of components.
21. 1
ARV Math Model
Table of Contents
Ground Pressure ................................................................................................................. 1
Vehicle Tilt ........................................................................................................................ 1
Power Consumption ............................................................................................................. 2
Ground Pressure
Define constants
g = 9.81; % m/s^2
m = 500; % kg - this is a guess
A = 0.7664*4; % m^2 - times four because 4 tracks
% find ground pressure
p = m*g/A % N/m^2 - ground pressure of all four tracksVeklo
p =
1.6000e+03
Vehicle Tilt
Define constants
s = 1.9; % m - just a rough guess for the rocker length
between axles
alpha = 90; % degrees - angle between rocker legs
yr = 0.1524; % m - displacement height of the rocker leg by
rock
theta1 = 15; % degrees - angle of slope for side 1
theta2 = 0; % degrees - angle of slope for side 2
w = 60*0.0254; % m - width of vehicle
length = 1.75; % m - length of the vehicle frame
% find leg lengths
beta = (180 - alpha)/2; % degrees - angles of rocker triangle
l = s*sind(beta)/sind(alpha); % m - leg length
h = l*sind(beta); % m - rocker joint height with no
displacement
% find height of rocker joint 1
phi1 = atand(yr/s); % degrees - angle from rock
thetaMax1 = theta1 + phi1; % degrees - total angle relative to
level
22. 2
ARV Math Model
h1 = l*sind(thetaMax1 + beta); % m - height of side 1
dh1 = h1 - h; % m - change in height of rocker joint
1
% find height of rocker joint 2
phi2 = 0;%asind(yr/s); % degrees - angle from rock
thetaMax2 = theta2 + phi2; % degrees - total angle relative to
level
h2 = l*sind(thetaMax2 + beta); % m - height of side 1
dh2 = h2 - h; % m - change in height of rocker joint
1
% find side-to-side angle of frame
tilt = asind((dh1 - dh2)/w) % degrees - the angle of the frame
with repect to the ground
% find twist angle of frame
dx1 = l*cosd(beta) - l*cosd(beta+phi1); %displacement of rocker
join in x direction (along travel motion)
thetaTwist = atand(dx1/w) % twist angle of the frame
% Ground Clearance
clearance = length/2*tand(thetaMax1) % m - Clearance of the rover
measured from the frame to ground
tilt =
9.9562
thetaTwist =
2.9673
clearance =
0.3113
Power Consumption
http://www.sciencedirect.com/science/article/pii/S0022489803000582 Power requirement
slope = 19.5859; % degrees - ThetaMax when climbing a 15
degree slope and rock
weight = m*g; % N - weight of vehicle
Cf = 0.25; % coefficient of friction
V = 2.25/5; % m/s ~ 5 mph - velocity of vehicle
Fg = m*g*sind(slope); % N - Force of gravity Fg
Ff = m*g*Cf; % N - Force of rolling resistance Ff
23. 3
ARV Math Model
F = Fg + Ff; % N - Sum of the forces
P = F*V % W - Theoretical power consumption
P =
1.2917e+03
Published with MATLAB® R2015a
25. Generator with Mount
M6x1 T-Slot Nut 90510A211 $4.67 16 $74.72 McMaster Carr
Stainless Steel Hex Head Cap Screw (50 pack) 91287A211 $9.16 1 $9.16 McMaster Carr
Stainless Steel Hex Head Cap Screw (25 pack) 93635A208 $6.15 1 $6.15 McMaster Carr
Digital Inverter Generator WH2000iXLT $563.14 2 $1,126.28 Home Depot
Parallel Cord for Generators WHPC $49.99 1 $49.99 Hardware Sales
6"x50" Aluminum 6061 Bare Sheet (0.063" thick) OnlineMetals $27.00 1 $27.00 OnlineMetals
Stainless Steel Unthreaded Spacer 92871A244 $2.85 4 $11.40 McMaster Carr
Chemical-Resistant PVC Vibration Damping Pad 5998K4 $21.08 1 $21.08 McMaster Carr
Generator with Mount Subtotal $1,325.78
Tracks
Mattracks XT XT $5,188.00 1 $5,188.00 Mattracks
Freight for Mattracks $350.00 1 $350.00 Mattracks
Mattracks Subtotal $5,538.00
Motors
Drive Motors Estimated 500 4 $2,000.00
Steering Motors Estimated
Motors Subtotal
100 2 $200.00
Manufacturing Estimate
Cutting Aluminum Extrusions to length Boyd Lab
Threading Control Bar and Support Block end holes
Drilling through-holes in Rocker Arms, Control Bar, and Frame
Drilling out mounting holes in Shaft Mounts and Flange Bearings 10
Boyd Lab
Boyd Lab
Boyd Lab
Fabricating Track and Motor Brackets 4 Boyd Lab
Fabricating Steering Mount Bracket 2 Boyd Lab
Fabricating Generator Side Brackets 2 Boyd Lab
Fabricating Generator C-Clamp Brackets
Manufacturing Subtotal guess
2
$500.00
Boyd Lab
Summary
Chassis Subtotal $1,525.25
Steering System Subtotal $4,144.30
Rocker Arms Subtotal $566.81
Generator with Mount Subtotal $1,325.78
Mattracks Subtotal $5,538.00
Motors Subtotal $0.00
Manufacturing Subtotal $500.00
ARV Total $13,600.14
Notes
Does not include the cost of additional sensors, computers, power supplies, motor controllers, and cables
26. MayTec has cheaper options, but involves a much more complicated quoting process
Cost Breakdown
0%
4%
11%
41%
30%
Chassis Subtotal
Steering System Subtotal
Rocker Arms Subtotal
Generator with Mount Subtotal
Mattracks Subtotal
Motors Subtotal
Manufacturing Subtotal
4%
10%
27. Product Engineering Specifications Concept 1: Manual Labor
Customer Needs/Wants (from CR worksheet)
Design
Feature 1
Target
Value Unit
Design
Feature 2
Target
Value Unit
Design
Feature 3
Target
Value Unit Feature 1 Value 1 Unit F2 V2 Unit F3 V3 Unit
Must be fully autonomous
Must be able to link data with particular plants
Must be able to keep cameras stable and level
Must be able to mount the hyperspectral camera
Must be able to mount the Kinect Camera
Must be able to mount at least 1 GoPro camera
Must be able to traverse various terrain/weather conditions
Must not damage plants
Must operate for extended periods of time
Must gather consistent and accurate plant data
Should have enough clearance for full plant height
Should be compatible with the MGV camera mount system
Should be compatible with the MGV shading system
Should be easy to maintain, store, and operate
Should greatly increase data collection rate
Should be easy to assemble/manufacture
Should be easy to access computers and data on board
Should be cost effective
Little human interaction
TBD hrs/day
Accurate positioning system +/-1 cm
Vibration dampening mount TBD G's
Mounts hyperspectral Yes Y/N
Mounts Kinect camera Yes Y/N
Mounts GoPros Yes Y/N
Surmountable terrain variation 15 cm
Plant vertical clearance cm
Run time 10 hrs
Sensor Levelness +/- 10 degrees
Height Adjustment +/- 1 [2] m
Uses MGV camera mount Yes Y/N
Uses MGV shade mount Yes Y/N
Low maintenance TBD hrs/month
Data Collection Rate TBD plants/hr
Tools Required TBD count
Simple computer interface
(Windows app) Yes Y/N
Cost TBD USD
Traction in moist soil Yes Y/N
Gentle interaction
(distance from plant
stem) 25 cm
Size TBD m^3
Standard plug interface
(USB) Yes Y/N
Long lasting product life TBD years
Water Resistance Yes Y/N
Training Time for
Operator 1 days
Removeable media (SD
Card) Yes Y/N
Personal GPS +/-1 m
Head-mounted
GoPro 1 ct
Gentle interaction
(distance from plant
stem) 25 cm
Full day of work 8 hrs
Data Collection
Rate 100 Plants/hr
Labor Cost 10 USD/hr
Plant tag 0 m
Workers per field TBD count
HOME
Customer Requirements to Engineering Specifications
Use this worksheet to create list of competitive design features, concept features, and the associated performance parameters. (HINT: Use the Market Benchmarking to identify features/functions that need to be present to satisfy customer
needs/wants. Use manufacturer data or reverse engineering to identify target values.)
Resources:
[1] UAV: http://www.precisionhawk.com/
[2] https://en.wikipedia.org/wiki/Soybean
[3] https://www.deere.com/en_US/products/equipment/tractors/utility_tractors/5e_series_h/5085e/5085e-2015.page?#viewTabs
[4] http://www.nxp.com/files/sensors/doc/data_sheet/MPL3115A2.pdf
28. Concept 2: UAV Precision Hawk Concept 3: John Deere Tractor Concept 4: Improved Manual Ground Vehicle
Feature 1 Value 1 Unit F2 V2 Unit F3 V3 Unit Feature 1 Value 1 Unit F2 V2 Unit F3 V3 Unit Feature 1 Value 1 Unit F2 V2 Unit F3 V3 Unit
Little human
interaction TBD hrs/day
GPS +/- 1 [1] m
In flight auto
correction Yes [1] Y/N
Hyperspectral
on board 1 [1] count
Altimeter
accuracy 0.3 [4] m
Run time hrs
Sufficient Plant
Clearance Yes [1] Y/N
Low
maintenance 1 hrs/week
Data Collection
Rate TBD Plants/hr
Tools Required 0 count
On Board
computer Yes Y/N
Cost 25,000 USD
Wingspan 1.5 m
3D mapping Yes Y/N
Training Time 1 days
Little human
interaction 8 hrs/day
Engine power 85 hp
turning radius 3.54 m
weight 7055 kg
wheel base 92.5 in
Fuel Tank 25 gal
Tire size (front) 43.5 in
Low
maintenance 2 hrs/week
Data Collection
Rate TBD Plants/hr
Assemnbly time 0 hrs
Cost 48,000 USD
Little human
interaction 8 hrs/day
Camera Pitch +/- 10 degrees
Tire Spacing 77 cm
Fuel Tank TBD gal
Low
maintenance 1 hrs/week
Data Collection
Rate TBD Plants/hr
Tools Required TBD count
Cost TBD USD
Chassis Height 1 m
29.
30.
31.
32. Some systems may require more than one QFD. Often it is TR1 Tracks 2 Strong Positive Impact Left to Bottom
1 Moderate Positive Impact Left to Bottom
0 No Impact
separated by systems or subsystems. See you instructor for TR2 TR2 Tires
TR3 Engine
"CTRL" key and click on the worksheet tab and drag across TR4 -2 TR4 Camera ‐1 Moderate Negative Impact Bottom to Left
to duplicate. TR5 2 TR5 Automated Controls -2 Strong Negative Impact Bottom to Left
TR10 1 0 1 2 TR10 Electric Motor Power
gTR11 2 2 2 2 2 TR11 Consistant Straight Steerin
TR17
TR18
TR17 0
TR18
TR1 TR2 TR3 TR4 TR5 TR6 TR7 TR8 TR9 TR10 TR11 TR12 TR13 TR14 TR15 TR16 TR17 TR18
(+) (+) (+) (+) (+) (+) (+) (+) (+) (+) (+) (+) (+)
Dr. Mountable Maintains Consistant
James Chad Dr. Dr. Ganapathysubrama Automated Protect from camera level Generator Electric Straight Motor Sensors for
Heise Garber Singh Singh nian Tracks Tires Engine Camera Controls enviornment systems platform Power Motor Power Steering Suspension Chassis Mount Autonomy
Fixed frame Articulating
Manual Rocker with arms with
Labor MGV Goals Wheel suspention suspension
9 9 9 9 9 9 9 1 9 9 9
9 9 3 1 9 9 9 9
9 9 9 9 3 3 9 9 3 9
9 3 1 9 9 9 9 9
9 3 1 1 9 9 9 9
9 9 9 9 3 9 3 9
9 9 3 9 3 9 9 9 3 9 3 3
3 3 9 9 9 9 3 3 9 9 3 9
3 3 1 9 9 9 9 9
3 3 1 9 1 9 3 9 9 3
3 3 3 9 3 9 9 3 9 3 9 9 9
3 1 3 1 3 9 3 9 3
9 9 9 9 9 9 9
3 9 3 9 9 1 1 3 9 9 3
anking: 6% 6% 5 % 5% 10% 3% 11% 4% 3% 6% 6% 7% 13% 6% 10% 3035 4353 4151 4229 7428 5898 6402 0
8. Benchmark Data - Engineering Specifications (Metrics) 4. Market
0 43.5 85 1 Yes Yes No +/- 25 No 0 +/- 2 Yes Yes Yes Yes John Deere Tractor
0 0 0 2 Yes No No +/- 20 No 1 +/- 10 No No No Yes Precision Hawk UAV
0 0 0 3 No No No N/A No 0 +/- 1 No No No No Manual Labor
0 0 18 3 No Yes Yes +/- 10 No 0 +/- 0.5 Yes Yes Yes Yes MGV
Goals - Engineering Specifications
0 20 0 3 Yes Yes Yes +/- 10 Yes 4 +/- 0.5 Yes Yes Yes Yes Rocker Wheel
0 20 0 3 Yes Yes Yes +/- 15 Yes 4 +/- 0.5 Yes Yes Yes Yes Fixed frame with suspention
0 20 0 3 Yes Yes Yes +/- 10 Yes 4 +/- 0.5 Yes Yes Yes Yes Articulating arms with suspension
0
Units: in in hp ct Yes/No Yes/No Yes/No degrees Yes/No ct F eet Yes/No Yes/No Yes/No Yes/No
3. Importance 2. Customer Requirements
9 9 9 Must be fully autonomous 1 1 3 9
9 9 9 Must be able to link data with particular plants 9 9 3 9
9 9 9 Must be able to keep cameras stable and level 3 3 1 9 9 9
9 9 9 Must be able to mount the hyperspectral camera 9 3
9 9 9 Must be able to mount the Kinect Camera 9 3
9 9 9 Must be able to mount at least 1 GoPro camera 9 3
9 9 9 Must be able to traverse various terrain/weather conditions 9 9 3 3 3
9 9 9 Must not damage plants 9 9 3 3 3 9
9 9 9 Must operate for extended periods of time 3 3 9 9 9 3
9 9 9 Must gather consistent and accurate plant data 3 3 9 3 9 9 9
9 9 9 Should have enough clearance for full plant height 3 3 9 3
9 9 9 Should be compatible with the MGV camera mount system 3 9
9 9 9 Should be compatible with the MGV shading system 3 3 1 3 3 9
9 9 9 Should be easy to maintain, store, and operate 3 3 3 9 9 3
9 9 9 Should greatly increase data collection rate 9 9 9 9 9 9 3
3 3 3 Should be easy to assemble/manufacture 9 9 3 3 3
3 3 3 Should be easy to access computers and data on board 1 3
9 9 9 Should be cost effective 3 3 3 9 3
Note:
QUALITY FUNCTION DEPLOYMENT (QFD)
9. Function vs. Function - Trade-offs Key
more information. To copy this worksheet just hold the TR3
TR6 ‐1 1 TR6 Protect from enviornment
TR7 0 2 TR7 Mountablecamera systems If not related, leave blank
TR8 2 -1 -2 2 1 1 TR8 Maintains level platform
TR9 2 0 2 TR9 Generator Power
TR12 2 -1 -1 2 2 2 2 TR12 Suspension
TR13 1 1 1 1 1 2 2 2 2 TR13 Chassis
TR14 2 2 1 2 -1 2 2 TR14 Motor Mount
TR15 2 2 1 1 2 1 2 1 -1 TR15 Sensors for Autonomy
TR16 TR16 0
0
1. Customer
Direction of Improvement (+/-)
6. Product Features (Functions) 4. Competition
Market
4. Concepts
John
Deere Precision
7. Meets Requirements?
1 1
1 1
1 1
1 1
1 1
Tractor Hawk UAV
5. Meets Reqmts?
1
9
9
3
3
5. Meets Reqmts?
1 1 9 3 1 1 3 9 9 9 9
1 1 9
1 1 9 3 3 1 9 9 3 3 3 9
1 1 9
1 1 9
1 1 9 9 1 9 3 9 9 9
1 1 3
1 1 3 3 9 3 1 9 9 3
1 1
1 1 1
1 1
1 1 9
1 1 3 3
R
34. Product Name: Autonomous Roving Vehicle
Responsible: Bobby Bromberek
Prepared by:Bobby Bromberek Page 1 of 1
DFMEA Date (Orig) March 8, 2016 (Rev)
Line No: Device Function
System,
subsystem, or Part
Description
System, Subsystem, or Part
Function
Potential Failure Mode
Potential Failure
Effects
SEV Root Cause OCC
Current Design Evaluation or
Control
DET RPN Actions Recommended Resp. Actions Taken SEV
OC
C
DE
T
RPN
Line No: What are the primary functions of the device?
What is the system,
subsystem or
part under
evaluation?
What is the Function
Provided by the system,
subsystem or part?
In what ways does this
function lose its
functionality?
What is the impact to the
Customer? (internal or
external)
How
Severe is
the effect
to the
cusotmer?
What root cause of the loss of
function?
How
often
does the
root
cause or
failure
mode
occur?
What are the tests, methods or
techniques to discover the root
cause before design release?
How well
can you
detect
cause or
failure
mode?
What are the actions for reducing the
occurrance of the Cause, or improving
detection? Should have actions only on high
RPN's or easy fixes.
Whose Responsible for the
recommended action?
What are the completed
actions taken with the
recalculated RPN? Be sure
to include completion
month/year
1 Locomotion
Tires Mobilize vehicle, contact with
ground
Sinking/slipping on soil ARV cannot perform
task of capturing plant
data
8
Improper balance between
weight and traction/surface
area
4
Numerical Analysis, Prototype
testing 7 224
Increase contact surface area in design, test
under worst terrain case scenario 0
2 Locomotion
Tires Mobilize vehicle, contact with
ground
Sinking/slipping on soil ARV cannot perform
task of capturing plant
data
8
Tread wear, deflated tire, flat
tire 3
Tire warrenty and expected lifetime
analysis 2 48
Advise end user to replace tires every
lifecycle and to check before operation (same
as a car)
0
3 Locomotion
Tires Mobilize vehicle, contact with
ground
Sinking/slipping on soil ARV cannot perform
task of capturing plant
data
8
Vehicle bottoms out
2
Model simulations and math
calculations 2 32
Design clearances such that vehicle will not
bottom out in expected conditions 0
4 Locomotion
Tires Mobilize vehicle, contact with
ground
Resistance to rotation Inefficient energy use =
shorter operation
periods, inability to move
7
Debris caught in wheels or
gears 4
Design for appropriate protection
5 140
Cover wheels to shield debris and gear train,
design so that debris falls out naturally 0
5 Locomotion
Tires Mobilize vehicle, contact with
ground
Excessive contact with plants Misrepresents plant
health and status 7
Plants caught in wheels
4
Design for appropriate protection
7 196
Cover the wheels with shield to deflect plants
with minimal impact with plants 0
6 Locomotion
Motors Power the wheels electrical failure or short ARV cannot move,
potential damage to
computer harware
8
water leaking into motor
3
Design for appropriate protection
5 120
Seal motor off from elements or choose a
motor with water resistance built in 0
7 Locomotion
motors Power the wheels Overheating ARV loses power and
the motors degrade 7
insufficient cooling of motor
7
Design for appropriate heat
management 2 98
Include heatsink or cooling system for motors
along with thermisters to detect dangerous
heat levels
0
8 Data Capture
Camera System
Capture pictures repeatably Angled pictures (>10 degrees) Data is less valuable
7
Camera package is unlevel
5
Design and test a leveling
2 70 Include suspension in addition to camera
package leveling
0
9 Locomotion
Controls and
breaking
correspondence
Position cameras directly
above plant Break too early or too late Data is less valuable
7
GPS and sensors are not
accurate or controls are not
calibrated
3 Performance test for timing and
location accuracy
2 42 Minimize tolerance in location accuracy, plan
controls measures to combat problem
0
10 Frame
Supports
Hold up weight of ARV
Bend or break ARV cannot operate,
damage to camera
equipment
9
Design or material not strong
enough to hold weight over
repeated cycles
2
Strength and reliability analysis
3 54
Calculate stresses at critical areas, calculate
for high life cycle, run FEA if possible,
choose appropriate material
0
11 Frame
Supports
Hold up weight of ARV
Bend or break ARV cannot operate,
damage to camera
equipment
9
Material loses strength due to
weathering/wear 2
Include weathering/wear factors in
strength and reliability analysis 6 108
Research effects of weathering and choose
material or coating to prevent 0
12 Stability
Weight distribution Remain stable, do not tip over Tip over Plant and equipment
destruction 9
Center of gravity is too high or
unsymmetrical 2
Numerical Analysis
1 18
Calculate center of gravity, do a force
analysis including inclines and wind effects 0
13 Power
Generator Supply power to batteries Fuel runs out early ARV cannot operate
8
Inadequate design for required
load 3
Numerical Analysis
1 24
Accurate math model to spec power
requirements 0
14 Power
Generator Supply power to batteries Fuel runs out early ARV cannot operate
8
Fuel leak
2
Performance test for leaks
1 16
Add a fuel gauge to design
0
15 Power
Batteries Supply power to motor Battery charge runs out early ARV cannot operate
8
Inadequate design for required
load 2
Numerical Analysis
1 16
Accurate math model to spec power
requirements 0
16 Power
Batteries Supply power to motor Battery charge runs out early ARV cannot operate
8
Age of batteries
2
Reliability Analysis
3 48
Advise end user to replace every lifecycle an
to check regularly
d
0
35. Priority Title Description
Probability
of Impact
Schedule
Risk
Scope
Risk
Quality
Risk
Cost
Risk Planned Risk Mitigation Actions
Activity Since Last
Report
1
Misunderstanding of sponsor's
needs/wants
1) Sponser's key interests in the robotic rover's design
may be misunderstood by the design team. 2)
Sponsor's do not communicate the major design
features to the design team.
Medium High High Low Medium
The team will maintian effective communication with
design team members, sponsors, and professors to
verify there is not a misunderstanding between the
sponsors and the design team. The project charter and
spec sheet provided by the sponsors for the robotic
rover's design will be referenced.
N/A
2
Limited funding
The limited funding will force DC1 to determine what
design functions of the robotic rover require the most
costly components. This may result in potential failures
during operation.
High Medium Medium High High
The design team will determine what components that
will require the most funding. These components will be
analyzed to determined their overall influence in the
design of the robotic rover. The team will not sacrifice
quality as the funding will be allocated to various design
elements. Appropriate documentation and justification
will be used to back up the decisions made by the
design team.
N/A
3
Maintain Schedule
Potential increase in time allocation to major design
features may extend float time past the allowable time.
These delays will impede the progression of other
project tasks.
High High High High High
In the circumstance the project's schedule is at risk the
design team will reallocate the resource of man hours to
ensure no team member is overloaded and an
equilibrium of work load is developed amongst each
team member. Schedule risks will be addressesed with
the sponsor so the quality of the design develops
efficiently. The sponsor will be informed if the man
hours exceeds what is possible.
N/A
4
Failure to meet project scope
Design team experiences losses in time to complete the
contracted requirements of the robotic rover. Potential
overload of man hours for individual design team
members.
High High High Medium Medium
The design team will utilize the gantt chart and project
schedule to maintain a timely completion of the tasks
required to achieve the contracted scope of the project
with the sponsors. If there are misunderstandings of the
scope the design team will refer to the project charter
and the customer requirements so the final design
contains all desired features. Constant communication
between the sponsors and the design team will be
maintained so the scope of the project is met.
N/A
5
Designs are untested
Robotic rover's function features fail to operate as
desired
High Low Medium High High
The design team will understand the time demand of the
project and determine which functions are in the highest
demand of being tested. Those functions which will not
be capable of being tested will need to be analyzed
through design models to understand their capability to
perform the desired tasks.
N/A
6
Lack of technical ability of team
Team members lack experience and expertise to
effectively develope a design to meet the functional
requirements of the robtoic rover.
Medium Medium Low Medium Medium
The areas which the design team may lack technical
ability will be over came by reasearching and learning
the concepts which are not yet understood. The design
team will communicate with the sponsor about potential
delays and purchasing systems to help reduse man
hours, but the design team will need to undersatnd the
cost of taking such avenues.
N/A
HOME Risk Register
36. DMADVR_MASTER_Planning_Phase_Review_DC1 - Editable.xlsx
WBS
M E Capstone
3/10/2016 Page A1-1
HOME WORK BREAKDOWN STRUCTURE
Follow recommended steps for defining project task structure
1 Divide project into managable subsystems and subtasks, use PFSB (at right) to help with task definition
2 Fit specific project tasks within each phase area; insert rows as needed.
3 Determine expected durations for each task either in effort hours or days duration (indicate which)
4 If known, specify 'must start' and/or 'must end' dates
5 Transfer contents to 'Critical Path' worksheet
Phase
Task
Step
Task Description
Must Start
Date
Must End
Date
Expected
Duration
Define-Measure
1 Team Roster/Skill Survey and project preferences 1/12/2016 1/12/2016 1
2 Team Norms 1/19/2016 1/21/2016 2
3 Project Charter 1/24/2016 1/28/2016 4
4 Preliminary WBS and schedule 1/31/2016 2/4/2016 4
5 Benchmarking and Customer Requirements 2/13/2016 2/17/2016 4
6 Stakeholder Analysis 2/15/2016 2/17/2016 2
7 Initiation Phase Review 2/18/2016 2/18/2016 1
Analyze
8 ARV Function tree defined and verified with MGV team 3/2/2016 3/3/2016 1
9 Solutions brainstormed for ARV subfunctions 3/2/2016 3/3/2016 1
10 Design concepts from combined solutions using Morphological Matrix 3/2/2016 3/3/2016 1
11 Functional Analysis with QFD Chart 2/29/2016 3/3/2016 3
12 Risk Management Plan with DFMEA 2/29/2016 3/3/2016 3
13 Select a design concept based on Decision Matrix and/or Pugh Chart 3/1/2016 3/3/2016 2
14 Peer Assessment 1 2/18/2016 2/18/2016 1
15 Design WBS, Critical Path, and Schedule 3/6/2016 3/8/2016 2
16 Engineering Specifications 2/20/2016 2/23/2016 3
17 Planning Phase Review 3/10/2016 3/10/2016 1
Design
18 Design Chassis 4/10/2016 4/26/2016 16
19 Design Traction/Locomotion 4/2/2016 4/26/2016 24
20 Design Power Source 4/18/2016 4/26/2016 8
21 Design/Ensure Camera Package Compatibility 4/18/2016 4/26/2016 8
22 Design Controls 4/22/2016 4/26/2016 4
23 Design Integration 4/8/2016 4/26/2016 18
24 Peer Assessment 2 3/31/2016 3/31/2016 1
25 System Model 4/2/2016 4/5/2016 3
26 Final Design and Drawings 4/18/2016 4/26/2016 8
27 Bill of Materials and production costs 4/21/2016 4/26/2016 5
Report
28 Create Design Expo Poster 4/15/2016 4/19/2016 4
29 Prepare Final Presentation 4/22/2016 4/26/2016 4
30 Write Final Report 4/28/2016 5/5/2016 8
31 Final Phase Review 4/26/2016 4/26/2016 1
32 Design Expo 4/26/2016 4/26/2016 1
33 Final Presentation 4/26/2016 4/26/2016 1
34 Peer Assessment 3 4/28/2016 4/28/2016 1
35 Final Report 5/5/2016 5/5/2016 1
36 All project files to SharePoint/ All materials ready to ship 5/5/2016 5/5/2016 1
153
37. DMADVR_MASTER_Planning_Phase_Review_DC1 - Editable.xlsx
WBS
M E Capstone
3/10/2016 Page A1-2
WBS LEVEL 1
1 Autonomous Roving Vehicle (ARV) 153 1
WBS LEVEL 2
ARV 153 1
WBS LEVEL 3
ARV 153
WBS LEVEL 4
1.1 Chassis 16 1.1 Chassis 16
1.2 Traction/Locomotion 24 1.1.1 Frame 4
1.3 Power Source 8 1.1.2 Camera Package Mount 2
1.4 Camera Package Compatability 8 1.1.3 Power Source Mount 2
1.5 Controls 4 1.1.4 Track Mount 8
1.6 Integration 18 1.2 Traction/Locomotion 24
1.7 Project Mgt. 75 1.2.1 Track System 8
1.2.2 Steering 6
1.2.3 Suspension 5
1.2.4 Motors 3
1.2.5 Motor Mount 2
1.3 Power Source 8
1.4 Camera Package Compatability 8
1.5 Controls 4
1.5.1 Sensors 4
1.6 Integration 18
1.6.1 Concept 4
1.6.2 Verify with MGV team 4
1.6.3 Design 10
1.7 Project Mgt. 75
38. Enter Status
Phrase per key
(see below)
Do not enter dates in these
columns. Auto format based on
ES/ME dates and Duration value.
Float Duration is calculated.
Phase
Task
Step
Task Description
Team Member(s)
Assigned
Status
Early Start
Date
Duration
(days)
Late Start
Date
Early End
Date
Float
Duration
Must End
Date
Define-Measure
1 Team Roster/Skill Survey and project preferences Ryan COMPLETED
COMPLETED
COMPLETED
COMPLETED
COMPLETED
COMPLETED
COMPLETED
COMPLETED
COMPLETED
COMPLETED
COMPLETED
COMPLETED
COMPLETED
COMPLETED
COMPLETED
COMPLETED
1/12/16 1 1/12/16 1/12/16 0 1/12/2016
2 Team Norms Travis 1/20/16 2 1/20/16 1/21/16 0 1/21/2016
3 Project Charter Todd 1/24/16 4 1/24/16 1/28/16 0 1/28/2016
4 Preliminary WBS and schedule Bobby 1/29/16 4 1/31/16 2/2/16 2 2/4/2016
5 Benchmarking and Customer Requirements Zheng 2/5/16 4 2/19/16 2/9/16 14 2/23/2016
6 Stakeholder Analysis Ryan 2/5/16 2 2/15/16 2/7/16 10 2/17/2016
9 Initiation Phase Review Ryan 2/18/16 1 2/18/16 2/18/16 0 2/18/2016
Analyze
10 ARV Function tree defined and verified with MGV team Travis 2/9/16 1 3/2/16 2/10/16 22 3/3/2016
11 Solutions brainstormed for ARV subfunctions Todd 2/10/16 1 3/2/16 2/11/16 21 3/3/2016
12 Design concepts from combined solutions using Morphological Matrix Bobby 2/11/16 1 3/2/16 2/12/16 20 3/3/2016
13 Functional Analysis with House of Quality Zheng 2/12/16 3 2/29/16 2/15/16 17 3/3/2016
14 Risk Management Plan with DFMEA Ryan 2/16/16 3 2/29/16 2/19/16 13 3/3/2016
15 Select a design concept based on Decision Matrix and/or Pugh Chart Travis 2/15/16 2 3/1/16 2/17/16 15 3/3/2016
16 Peer Assessment 1 Ryan 2/18/16 1 2/18/16 2/18/16 0 2/18/2016
17 Design WBS, Critical Path, and Schedule Todd 2/17/16 2 3/6/16 2/19/16 18 3/8/2016
18 Engineering Specifications Bobby 2/10/16 3 2/20/16 2/13/16 10 2/23/2016
19 Planning Phase Review Ryan MILESTONE 3/10/16 1 3/10/16 3/10/16 0 3/10/2016
Design
20 Design Chassis Bobby PLANNED 3/10/16 16 4/10/16 3/26/16 31 4/26/2016
21 Design Traction/Locomotion Ryan PLANNED 3/10/16 24 4/2/16 4/3/16 23 4/26/2016
22 Design Power Source Travis PLANNED 3/10/16 4 4/22/16 3/14/16 43 4/26/2016
23 Design/Ensure Camera Package Compatibility Zheng PLANNED 3/10/16 8 4/18/16 3/18/16 39 4/26/2016
24 Design Controls Todd PLANNED 3/10/16 4 4/22/16 3/14/16 43 4/26/2016
25 Design Integration Ryan PLANNED 3/10/16 18 4/8/16 3/28/16 29 4/26/2016
26 Peer Assessment 2 Ryan PLANNED 3/31/16 1 3/31/16 3/31/16 0 3/31/2016
27 System Model Todd PLANNED 3/18/16 3 4/2/16 3/21/16 15 4/5/2016
28 Final Design and Drawings Travis MILESTONE 4/3/16 8 4/18/16 4/11/16 15 4/26/2016
29 Bill of Materials and production costs Bobby PLANNED 4/3/16 5 4/21/16 4/8/16 18 4/26/2016
Report
30 Create Design Expo Poster Zheng PLANNED 4/11/16 4 4/15/16 4/15/16 4 4/19/2016
31 Prepare Final Presentation Ryan PLANNED 4/8/16 4 4/22/16 4/12/16 14 4/26/2016
32 Write Final Report Travis PLANNED 4/8/16 8 4/27/16 4/16/16 19 5/5/2016
33 Final Phase Review Ryan MILESTONE 4/26/16 1 4/26/16 4/26/16 0 4/26/2016
34 Design Expo Ryan MILESTONE
MILESTONE
4/26/16 1 4/26/16 4/26/16 0 4/26/2016
35 Final Presentation Ryan 4/26/16 1 4/26/16 4/26/16 0 4/26/2016
36 Peer Assessment 3 Ryan PLANNED 4/28/16 1 4/28/16 4/28/16 0 4/28/2016
37 Final Report Ryan MILESTONE 5/5/16 1 5/5/16 5/5/16 0 5/5/2016
38 All project files to SharePoint/ All materials ready to ship Ryan MILESTONE 5/5/16 1 5/5/16 5/5/16 0 5/5/2016
HOME
Project Schedule
BY: Zheng Yi Liew, Travis Heidrich, Todd Heidrich, Bobby Bromberek, Ryan Tweedt
Date:
Status Key:
PLANNED
MILESTONE
ON TIME
CRITICAL/LATE
COMPLETED
DMADVR_MASTER_Planning_Phase_Review_DC1 - Editable.xlsx
Schedule
M E Capstone
3/10/2016 Page A1-1
40. Task
Step
Task Description
Must Start
Date
Must End
Date
Expected
Duration Activity
1 Team Roster/Skill Survey and project preferences 1/12/2016 1/12/2016 1 A
2 Team Norms 1/19/2016 1/21/2016 2 B
3 Project Charter 1/24/2016 1/28/2016 4 C
4 Preliminary WBS and schedule 1/31/2016 2/4/2016 4 F
5 Benchmarking and Customer Requirements 2/13/2016 2/17/2016 4 D
6 Stakeholder Analysis 2/15/2016 2/17/2016 2 E
7 Initiation Phase Review 2/18/2016 2/18/2016 1 G
8 ARV Function tree defined and verified with MGV team 3/2/2016 3/3/2016 1 H
9 Solutions brainstormed for ARV subfunctions 3/2/2016 3/3/2016 1 I
10 Design concepts from combined solutions using Morphological Matrix 3/2/2016 3/3/2016 1 J
11 Functional Analysis with QFD Chart 2/29/2016 3/3/2016 3 L
12 Risk Management Plan with DFMEA 2/29/2016 3/3/2016 3 O
13 Select a design concept based on Decision Matrix and/or Pugh Chart 3/1/2016 3/3/2016 2 M
14 Peer Assessment 1 2/18/2016 2/18/2016 1
15 Design WBS, Critical Path, and Schedule 3/6/2016 3/8/2016 2 N
16 Engineering Specifications 2/20/2016 2/23/2016 3 K
17 Planning Phase Review 3/10/2016 3/10/2016 1 P
18 Design Chassis 4/10/2016 4/26/2016 16 Q
19 Design Traction/Locomotion 4/2/2016 4/26/2016 24 R
20 Design Power Source 4/18/2016 4/26/2016 8 S
21 Design/Ensure Camera Package Compatibility 4/18/2016 4/26/2016 8 T
22 Design Controls 4/22/2016 4/26/2016 4 U
23 Design Integration 4/8/2016 4/26/2016 18 V
24 Peer Assessment 2 3/31/2016 3/31/2016 1
25 System Model 4/2/2016 4/5/2016 3 W
26 Final Design and Drawings 4/18/2016 4/26/2016 8 Y
27 Bill of Materials and production costs 4/21/2016 4/26/2016 5 X
28 Create Design Expo Poster 4/15/2016 4/19/2016 4 Z
29 Prepare Final Presentation 4/22/2016 4/26/2016 4 AB
30 Write Final Report 4/28/2016 5/5/2016 8 AE
31 Final Phase Review 4/26/2016 4/26/2016 1 AD
32 Design Expo 4/26/2016 4/26/2016 1 AA
33 Final Presentation 4/26/2016 4/26/2016 1 AC
34 Peer Assessment 3 4/28/2016 4/28/2016 1
35 Final Report 5/5/2016 5/5/2016 1 AF
36 All project files to SharePoint/ All materials ready to ship 5/5/2016 5/5/2016 1 AG
CRITICAL PATH ANALYSIS
Follow recommended steps for defining project schedule
1 Copy WBS from previous worksheet
2 Determine task links (predecessors)
3 Construct workpath entities (Hint: 'Events' are transition dates between 'Activities')
4 Calculate workpath durations and dates
5 Determine critical workpaths based on durations, 'must start' and 'must end' requirements
6 Determine 'float' time non-critical workpaths
7 Transfer information back to WBS and on to Gantt Chart
41. Event Activity LS
20 - 19 AG 83
19 - 18 AF 82
18 - 15 AE 74
19 - 15 AD 82
19 - 17 AC 82
17 - 15 AB 78
19 - 16 AA 82
16 - 15 Z 78
15 - 14 Y 66
14 - 12 X 61
14 - 12 W 63
14 - 13 V 48
13 - 12 U 44
13 - 12 T 40
13 - 12 S 40
13 - 12 R 24
13 - 12 Q 32
12 - 11 P 23
11 - 10 O 20
11 - 10 N 21
10 - 9 M 18
9 - 8 L 15
8 - 6 K 12
8 - 7 J 14
7 - 6 I 13
6 - 4 H 11
6 - 5 G 11
5 - 3 F 7
5 - 3 E 9
5 - 4 D 7
4 - 3 C 3
3 - 2 B 1
2 - 1 A 0
Activity LS ES TF
A 0 0 0
B 1 1 0
C 3 3 0
D 7 7 0
E 9 3 6
F 7 3 4
G 11 11 0
H 11 7 4
I 13 12 1
J 14 13 1
K 12 12 0
L 15 15 0
M 18 18 0
N 21 20 1
O 20 20 0
P 23 23 0
Q 32 24 8
R 24 24 0
S 40 24 16
T 40 24 16
U 44 24 20
V 48 48 0
W 63 24 39
X 61 24 37
Y 66 66 0
Z 78 74 4
AA 82 78 4
AB 78 74 4
AC 82 78 4
AD 82 74 8
AE 74 74 0
AF 82 82 0
AG 83 83 0
Total Float Analysis -
Forward Pass - Early Start Analysis Backward Pass - Late Start Analysis Items with '0' Float are critical path
Event Activity ES Path
1 A 0 ES1
2 B 1 ES2 = ES1 + 1
3 C, E, F 3 ES3 = ES2 +2
4 D, H 7 ES4 = ES3 + 4
5 G 11 ES5 = ES4 + 4
6 I, K 12 ES6 = ES5 + 1
7 J 13 ES7 = ES6 +1
8 L 15 ES8 = ES6 +3
9 M 18 ES9 = ES8 + 3
10 N, O 20 ES10 = ES9 + 2
11 P 23 ES11 = ES10 + 3
12 Q, R, S, T, U, W, X 24 ES12 = ES11 + 1
13 V 48 ES13 = ES12 + 24
14 Y 66 ES14 = ES13 + 18
15 Z, AB, AD, AE 74 ES15 = ES14 + 8
16 AA 78 ES16 = ES15 + 4
17 AC 78 ES17 = ES15 + 4
18 AF 82 ES18 = ES15 + 8
19 AG 83 ES19 = ES18 + 1
20 84 ES20 = ES19 + 1
WORKPATH FLOW DIAGRAM