1. Integrated Service Information and Management (ISIM):
Coming Down the Tracks for NYCT: The Lettered Lines
Thomas Colacioppo, CCM, CSEP
Project Manager
MTA New York City Transit
New York City, NY
ABSTRACT
After the success ofbringing centralized service
management, communications and control to NYCT’s
Sub-Division-A commissioned in 2008, we have been
working towards a short and long term strategy using
lessons learned when developing the same capabilities for
the larger Sub-Division-B. This new initiative is called
Integrated Service Information and Management (ISIM-
B). Because of its size and complexity, ISIM will
straddle three or more capital five-year programs and will
be commissioned in strategically phased individual
“Modules”. Using a Systems Engineering approach, we
instituted a formal development methodology. This
began with a well-defined project purpose statement
along with clear project objectives and goals.
Early during the conceptualphase,we revisited our
lessons learned database to help develop our plans for
providing real-time situation awareness to the operations
staff while at the same time improving the customer’s
experience. With these goals as our fundamental mission,
the following pillar objectives were developed:
1. Better service management by improving service
monitoring and regulation;
2. Better management of safety and security by
improving information sharing and decision
making;
3. Better customer information by improving the
quality, accuracy and timeliness of
communication; and
4. Better operational plans and schedules by
improving analysis of historical service data.
A BRIEF HISTORY OF THE NEWYORK
CITYSUBWAY: MOVING WITH
TECHNOLOGY
The New York City Subway is an amalgamation of
the Interborough Rapid Transit (IRT) Company, the
Brooklyn-Manhattan Transit (BMT) Corporation and the
New York City owned and operated Independent Subway
System (IND). The IRT is referred to Subdivision-A, and
consists ofthe 42nd St Shuttle, and the number lines with
the exception of the 7-Line (See figure 1 below).
Subdivision-B consists ofall the letter lines, the
Rockaway Park and Franklin Ave Shuttles and the 7 line.
The BMT is known as B-1 and IND as B-2. (See figure 2
below)
The IRT began service in 1904 and was the first real
operating subway in New York City. This was followed
by the BMT in 1923 and the IND in 1932. When no
private agency could be found, the city decided to operate
the IND subway lines.
The three systems were built by New York City
through transportations bonds. The operations were then
leased to the Interborough Rapid Transit and the
Brooklyn-Manhattan Transit companies with the
qualification that they could not raise the five cent fare
without the permission from the Mayor. By 1940, not a
single Mayor approved a fare increase. The lack of any
fare increases along with the rising operating costs pushed
the two companies into bankruptcy obliging the City to
assume control of all the subway lines.
The typical rail configuration in Manhattan also
known as the Central Business District (CBD) is four
tracks; northbound local/express and southbound
local/express. The outerboroughs of Queens, Brooklyn
and the Bronx have branches of various configurations
including four tracks, three tracks, where the center track
is a bi-directional express service, and the standard two
track northbound and southbound localonly service.
In 1948, the first eNtrance/eXit (N/X) interlocking
control systemwas installed at Euclid Avenue in
Brooklyn which began the evolution towards centralized
control operation. By the late fifties, this transition
2. continued as individual local towers were aggregated into
a Master Tower model.
In the nineties, NYCT began a paradigm shift from
remote tower monitoring and control to central
monitoring and control through technology upgrades. A
new Rail Control Center was commissioned which would
initially house two projects introducing two significant
technologies to the transit system: Automatic Train
Supervision (ATS) and Communications Based Train
Control (CBTC.)
In 2006, NYCT commissioned ATS for Subdivision
A (ATS-A). This systemdelivered both schedule-based
train monitoring and tracking and automatic schedule-
based train routing and control. It remains the largest
automatic train control and supervision software system
in the United States. It receives indications or sends
instructions to approximately 20,000 discreet field
devices including track circuits, switches, signals, and
alarm.
The second significant project, a CBTC system, was
installed on the Canarsie Line also known as the L line.
This vital software systemdelivered moving block
spacing,automatic routing and speed/service regulation.
(Canarsie is one of two self-contained lines with the
Flushing or 7-line being the otherone.)
ATS-A and Canarsie CBTC along with a subsequent
technology project, Public Address and Customer
Information Screens (PA/CIS) for Subdivision-A, also
delivers real-time arrival times to 180 stations,the
internet and mobile devices.
Figure 1, Subdivision A Service
With the successfulcommissioning of these projects
NYCT began the next phase of upgrading the Subdivision
B, with CBTC Flushing, CBTC Queens Blvd Line and
ISIM-B.
Figure 2, Subdivision B Service
LESSONS LEARNED FROM SIMILAR
PROJECTS AND THEIR IMPACT ON OUR
DESIGN APPROACH
There were a number of lessons learned recorded on
the aforementioned ATS-A project. These were
categorized as functional, management and procedural.
The following section will identify some of the key
lessons learned along with how they have influenced
ISIM-B.
LL #01 - Resisting the temptations of declaring
premature success of project milestones and
approving the associated deliverables.
The project team needs to be cognizant of the effects
when giving in to schedule pressures. These include a
false sense ofachievement, and an inaccurate assessment
of progress. This is amplified with software intensive
projects because of the lack of physical progress that can
be measured.
To mitigate this issue,the NYCT design team
conducted a review of the Software and System
Specifications. Vague language was identified and
replaced or modified resulting in a clear set of
requirements that specified the appropriate content of all
deliverables. Data Item Descriptions (DIDs) were
developed to provide an unambiguous set of expectations
for delivery. The Software System Specification was
revised to include the requirements needed to satisfy each
project segment.
A review of our internal processes is ongoing. This
includes the use of interdisciplinary project teams to
expedite project issues resolution and milestones. These
3. teams will be empowered to make technical decisions and
avoid the frustration caused by indecision.
LL #02 – Understanding and memorializing the
wants and needs of the User and Stakeholder
community
Complex, software intensive projects tend to have
long lifecycles. Because of this it is not unusualto
experience significant primary User and Stakeholder
representative turnover during this period with a
commensurate shift in direction. Established project
requirements are put at risk.
To manage/mitigate this this risk we are relying on
our formal System Engineering approach. This consisted
of getting consensuson the Project Purpose
Memorandum, the Concept of Operation, an Alternative
Analysis and the System Requirements. All requirements
were bi-directionally traced to a useror stakeholder need.
After a series of workshops,these artifacts were
developed in a collaborative environment with an
extensive signoff. (The System Engineering Process
section describes this in more detail.)
We also embedded key users into the design team
and will continue to use this approach during
construction.
LL #03 – The need for lifecycle traceability
Previous Systems projects had vague requirements
regarding requirement tracing. Some only referenced
IEEE standards for Requirement Management. The
problem we experienced is that the IEEE standards were
considered “guidelines” and permitted too much
flexibility in interpretation by some contractors. Our
response was to revise the Software System Master
specifications to remove and treat IEEE specifications as
reference only documents. Figure 3 represents the tracing
scheme now required within our specifications. The key
points for us regarding tracings are:
Tracing should begin during the Conceptual
Phase to maximize our ability to perform system
validation. “did we build the right system”
Change is inevitable (AWOs: additional work
orders) and there should be a workflow to trace
them into the development lifecycle
Prototype agreements should be considered
requirement clarifications and, therefore, traced
into the development process.
Tracing to the software code is a challenge but, if
software maintenance is an organizational
objective, then tracing to a software
configuration item should be a goal.
All Test Cases should clearly identify the source
requirements being tested.This will be used for
systemverification “did we build the system
correctly”.
.
ConOps Specification
Rqmts Doc
(SFRD/SRS)
Software
Design
(SDD)
Code
(SCI)
Prototyping
Test
Procedures
V and V
Report
UR FEATCRD DE
PROTO
Code
AWOs
Figure 3, Tracing Scheme
LL #04 – Developing the User Interface to enhance
the user experience instead of developing a User
Interface to mimic the existing operation
The ATS-A systemwas treated as a signal project
and therefore was seen as an extension of the signal
system.
The legacy local tower route selection sequence is as
follows:
Entrance selection (User)
Available Exit Presented (Signal System)
Exit selection (User)
Route selection is executed (Signal System)
** Flashing Yellow is presented to identify what
signals are inhibiting route entrance selection
(Signal System). In-depth knowledge of the
uniqueness ofthe interlocking is needed to
understand and resolve this condition.
This sequence was based on a discreet set of wired
indications that offered no intuitive interaction between
the User and Signal System. The ATS-A systemwas
designed to mimic this interaction.
The approach being used on the ISIM project is to
engage Human Factors Engineers early on and throughout
4. the project. Our goal is to develop a more “userfriendly”
user interface that minimizes useractions while reducing
the need for understanding site specific idiosyncrasies. A
future sequence might be:
Select a normal or reverse routing request object
(User)
Completed route selection is displayed (ISIM)
An information bubble could be provided that
explains why the route selection was not
successfulwith instructions on how to resolve it.
LL #05 – Develop a system that recognizes current
operating conditions and service metrics and suggests
Service Delivery options based on the interpretation
of this data.
Previous projects that offered automatic routing and
rerouting instructions made these decisions strictly based
on schedule without assessing the current operating
environment or determining the impact of these decisions.
It was strictly automating the basic actions of a Tower
Operator with no logic towards improving service
delivery.
ISIM’s goal will be to present service awareness to
the operational users along with a series of options to
optimize service. (Two new key functions Performance
Monitoring and Decision Support are described in more
detail in following sections.)
LL #06 – The use of Automatic Vehicle Identification
(AVI) Readers to identify and manage individual car
numbers is costly and unreliable. An alternate
method is necessary
One of the many challenges we have faced when
developing a comprehensive train tracking systemis how
to handle train movement in the non-monitored areas,
specifically train yards. When trains enter the yards the
tracking systemcan no longer monitor their movement.
Therefore, when trains leave the yards to enter the
monitored territory there is no reliable way to accurately
associate the car numbers to the train consists.
In the Subdivision-A, we installed AVI car readers at
all yard leads and AVI tags on all train cars. When the
train passes a reader the car numbers are assigned to the
newly created train consist. Although this proved to be an
accurate method, it is also costly to install and maintain.
ISIM will support train identification needs with a
Yard Management function that employs a combination
of user procedures and software processes.
LL #07 – Keep projects to manageable size
There are many reasons why we want to keep the size
of each project small including: 1) diversification of the
risk spread over several projects/contractors,2) better
control over interim goals (that in turn could provide
incremental value to stakeholders), or 3) it is made more
manageable by limited NYCT resources.
We have also observed that combining software
intensive systems with infrastructure installation and
construction work adds significant risk to a project’s
success. Infrastructure construction,particularly in a
uniquely NYCT environment, is typically not part of the
core business offirms that provide train monitoring and
control systems and our experience has shown that they
are surprised and unprepared by the complexity and
extent of the resulting integration effort.
ISIM OVERVIEW
The ISIM concept is not that of a single project but a
series of staged large and small projects organized to
build one upon the other. We are calling each of the
projects in the group “Modules” with their own master
plan, scopes,budgets and schedules (application of LL
#07). Collectively the ISIM modules support the strategic
goals and objectives of NYCT while remaining within our
financial profile for the entire effort. ISIM modules have
approved funding over two 5-year capital programs with
proposed funding for a third. Because of this approach
planning is an essentialelement of the overall program.
Figure 4, M odule Rollout Strategy and Inter-relationships
Module 1: Integrated Signals Data Acquisition
5. The focus of Module 1 is to capture train and signal
status from 26 field tower locations within Manhattan,
Brooklyn, Queens and the Bronx and deliver this
information to the Rail Control Center (RCC). It is
primarily a network infrastructure project. Depending on
location, this data could be transmitted across copper,
fiber, and wireless technologies before tunneling over the
SONET backbone network to the RCC. Once this
information reaches the RCC it will be processed to
deliver train location information to Service Delivery
personnelvia wired workstations and mobile tablet
devices. This data while useful to operations after
Module 1 completion will also be the foundation for the
Module 3 Rail Traffic Management Systemand future
CBTC projects. This project is primarily an in-house
design with award planned for summer of 2015.
Module 2: Flushing Customer Communications
This module will furnish and install the public
address speakers,customer information signs, the PACIS
communication cabinet equipment and infrastructure at 21
stations along the Flushing Line. There are a number of
innovations included with this project including the
design and installation of a PassengerStation Local Area
Network (PS-LAN). The PS LAN is a fiber network ring
connecting the communication room, fare areas and
station platforms. As part of this network access nodes
will be placed at key locations for connecting to the ring.
Module 2 will be able to support future projects such
as, New Fare Payment, On the Go kiosks, CCTV camera,
and Emergence Booth Communications System. LED
signs on the station platforms will also be integrated with
LCD signs in the mezzanine and fare areas using this
network. The LCD signs will publish subway, bus and
Long Island Railroad arrival information.
Module 3: Rail Traffic Management System
This module is the primary and most complex
component to the ISIM program. It includes the design,
development and commissioning of the rail traffic
management and information system. This systemis
being designed as a highly available expert software
systemthat will supervise the entire Subdivision-B. It
includes a number of core capabilities such as Service
Planning, Service Management, Incident Reporting,
Historical Analysis,Reporting, Customer Information,
and Resource Management.
It also includes a number of emerging capabilities
such as Performance Monitoring and Decision Support
(described in more detail in the next section.)
Module 4 Customer Communications Subdivision B
Module 4 is similar in scope to Module 2. It will
furnish and install the public address and customer
information equipment and infrastructure at
approximately 180 additional Subdivision stations. The
main difference is the challenges of quantity and funding
profile.
Future Modules
There are a number of “placeholder” modules that are
part of our long-term vision for continual improvements
and future work. These modules are still in and early
Conceptual Phase and may change as our operational
strategy evolves however they are needed now for budget
forecasting and capital fund planning.
The scope within these modules includes RCC
architectural, communications, electrical and mechanical
designs. Integrating ISIM with the Communications
Based Train Control (CBTC) program to deliver a
universal and integrated user interface may also be
supported.
ISIM-B MODULE 3: RAIL TRAFFIC
MANAGEMENT SYSTEM
The ISIM-B Rail Traffic Management System will
deliver a number of core capabilities integrated into a
centralized Control Center environment. There are also a
set of new capabilities being developed that are a direct
result of our lessons learned from ATS-A.
This includes Performance Monitoring, Decision
Support and Yard Management capabilities. In
developing these functions,we have solicited input from
the Rail Operators and Rail Traffic Management
Development community.
Note: For the discussion that follows a couple of
definitions are in order. A corridor is a geographical
area of tracks that could include a combinationsof
express/local,northbound and southbound services.
Examples of this on the B-Division includes the 6th
Ave,
8th
Ave and Sea Beach corridors A single track within a
corridor between key interlockings isknown asa branch.
Performance Monitoring
There are two types of performance indications
currently provided by the ATS systemfor Subdivision A.
6. The first is the presentation of real-time train schedule
and headway adherence. NYCT currently uses a green,
white, yellow and red color scheme on all track displays
to showdegrees of schedule deviation. The second is
quality of service metrics that are calculated after the
service day is over and include on-time-performance and
wait assessment.
ISIM-B will improve on this by delivering real-time
service performance metrics also called Key Performance
Indicators (KPIs) (application of LL #05). KPIs can be
presented as an aggregated performance dashboard,
individual site specific indicators, and/or string line
charts. The objectives for this information is to provide
early notice of a developing condition and the current
health of service. NYCT has contracted the services of
Human Factor Professionals to help during the conceptual
phase. Human Factor activities will include
understanding the relationship between the data and the
required operator interactions so that an intuitive and
robust User Interface can be designed and developed.
This information will be vital to ISIM and Rail
Operation’s ability to make optimal service delivery
decisions.
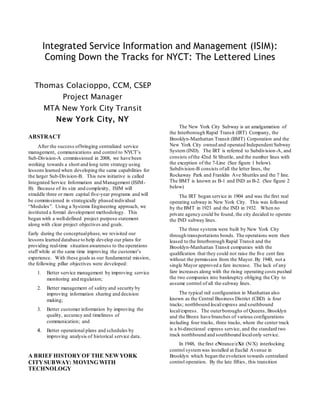
One popular interactive tool for visualizing service
performance is the string-line chart. The example in Fig 5
represents a single train consists. The blue line represents
the schedules for 0A 0724 LEF/207 (“A” train leaving
Lefferts Blvd at 7:24 am for 207th St) and it’s next trip,
the 0A 0822 207/LEF departing after a 4 minute terminal
dwell. The green line represents the actual train’s
progression; the line’s color is a KPI that denote deviation
from the schedule. The red dotted line represents the
predicted train movement. The vertical tics represent
station dwell.
At 155th St the train is operating approximately 4
minutes late. The predicted arrival time at 207th St. will
not be in-time to make its outbound departure time of
8:22. A configurable Alert will be issued when a
“lateness” threshold is crossed thereby jeopardizing its
next trip departure time. The Alert could allow sufficient
time to execute a mitigation strategy. One such strategy
is to implement a 5 minute service adjustment by using a
“hook and drag “of the Blue line from 8:22 to 8:27.
Figure 5, Stringline Example
The following are other KPIs being considered:
Wait Assessment – Is a measurement of
customer wait time for a train at a designated
station. The average actual wait time can be
measured against the scheduled wait time. An
increase of actual wait time can be representative
of a developing blockage condition
Branch Availability – A branch is a section of
track between 2 key interlockings. Branch
availability is the measurement of how many
trains can be added to the branch before capacity
is reached. It is the difference between
maximum capacity and current capacity.
Service Thru-put – Is the flow of trains past a
designated point over a defined time period.
Measured against the scheduled thru-put can
provide an early measurement to service delivery
performance.
Schedule Adherence – Is calculated and
presented in terms of deviation between the
train’s actual operating times and its planned or
schedule times. Schedule Adherence is also
known as on-time-performance.
Decision Support
Routine operations within Subdivision B involve
executing the Daily Service Plan. When planned or
unplanned events occurthat affect this plan the Service
7. Delivery staff must immediately be made aware of the
situation.
Once aware of a disruption, Service Delivery staff
will need to be able to develop and evaluate alternative
strategies to minimize the impact on customers
(application of LL #05). Often they must respond to a
rapidly evolving situation to develop and coordinate both
local and more global systemresponses to maintain the
quality of service.
ISIM-B will provide the tools to help analyze
conditions and propose a series of alternative actions. In
order to achieve this we are developing a set of KPIs that
will both alert the userof developing conditions and
recommend a service strategy. We will also attempt to
codify years of institutional knowledge through a series of
interviews with experienced Service Deliver personnel.
In order to mitigate the risk of this new function, the
ISIM team will develop a series of Operational Scenarios.
One example is the “Effects of a Service Blockage”.
Using Figure 6, a 20 minute blockage on the northbound
6th Ave local, north of switch 247, is declared. The office
systemwould
Determine the number of impacted trains.
Using KPIs such as the Branch Availability and
Service Thru, ISIM would calculate the number
of trains that can be routed to the adjacent
express track before any service delays would
occur
For example, if a potential delay occurs on the
6th Ave express ISIM would evaluate alternate
routes such as the 8th Ave local.
In situations where all actions would result in
excessive delays, ISIM could recommend
removing train trips from service as a service
relief alternative.
Rerouteto8th
Avlocal
Rerouteto6th
Avexpress
Blockage
-MandFare6th
AvLocal
-BandDare6th
AvExpress
-CandEare8th
AvLocal
Figure 6, West 4th
Interlocking
Figure 7, represents a possible response from
ISIM. Selecting one of the options would trigger the
automatic batch re-route which would recalculate the
schedule for all affected trains. Selecting the Cancel
option, would allow manual intervention. The
expectation is that these KPIs would provide the
necessary awareness to make a more informed
service delivery decision.
8. Option 1: 10 Trains affected, 6th
Av Express Reroute
1. Reroute 7 trains to the 6th
Av express, beginning with the <train id>
Impact: No service delay, minimal customer impact
2. Reroute the remaining 3 trains to the 6th
Av express
Impact: Beginning of a significant service delay, minimal customer impact
Option 2: 10 Trains affected, 6th
Av Express and 8th
Av Local Reroute
1. Reroute 7 trains to the 6th
Av express, beginning with the <train id>
Impact: No service delay, minimal customer impact
2. Reroute the 2 trains to the 6th
Av express
Impact: Beginning of a minimal service delay, minimal customer impact
3. Reroute the 10th
train to the 8th
Av corridor
Impact: No service delay to the 8th
Av corridor, significant customer impact
Accept Cancel
Figure 7, Decision Support Options
AnotherDecision Support scenario is when an
Operator manually routes a train off of its scheduled path.
ISIM would compare established routes against the
planned route. When they differ an Alert would be
issued. If the Operator declares this to be an unscheduled
adjustment, ISIM will propose possible service paths
based on Service Delivery’s institutionalized knowledge
that has been codified into the system. If the desired path
is offered and accepted ISIM would then recalculate the
train’s schedule. This ability is essentialto maintaining
the integrity of our countdown clocks and Service
Performance metrics.
The combination of improved Performance
Monitoring and Decision support will support ourpillar
objective towards improved service management and
regulations.
Yard Management
ISIM is designed to deliver effective management of
trains sets,cars and crews within Yards and otherStorage
locations. Effective management includes planning and
execution of where trains and crews are, where they have
been, and when and where they need to be (application of
LL #06).
This process includes planning a series of manual
train movements and recording the completion of each
movement at which time the systemwill automatically
update all applicable yard maps and movement sheets.
ISIM will also provide the tools to determine what
resources (crew and cars) are available; manage car
maintenance, car wash schedules and record non-revenue
mileage.
SYSTEM ENGINEERING PROCESS
ISIM-B is the first NYCT project to follow a
structured SystemEngineering approach. The process
began with a series of workshops and interviews with
potential customers and stakeholders. The output from
this step was the issuance of the Project Purpose memo
signed by our President which stated the purpose of ISIM,
its long-term and short-term goals, and the four pillar
objectives. Figure 8 was the centerpiece of that memo
and is used at every project kick-off meeting and
executive presentation. This ensures establishment of
consistent expectations between the design team and all
stakeholders.
This memo was followed by the generation of the
Concept of Operations, Alternative Analysis, Whole
System Requirements and Detailed System Requirements.
Time
Better management of safety and security by improving information sharing and decision making
Better customer information by improving the quality, accuracy and timeliness of communication
Better operational plans and schedules by improving analysis of historical service data
Better service management by improving service monitoring and regulation
Purpose:Objectives:
Provide consistent and
timely information
about the current state
of B-Division service to
staff and customers,
moving the agency
towards centralized
monitoring and control
Centralized
service
monitoring,
control and
customer
information
at the RCCCurrent Operation
Long-term Goal
Capability
ISIM-B Project
Figure 8, Purpose and Objectives Declaration
The four pillar objectives were expanded below to
detail what is to be accomplished in order to measure
project completion and project success.
1. Better service management by improving
service monitoring and regulation. ISIM-B will
provide Rapid Transit Operations (RTO) staff
with real-time, graphical (e.g. string-line),
centralized views of status and performance
across the B Division, enhancing their ability to
implement regulation actions quickly and easily
and to monitor the impact of any regulation
actions they have taken.
2. Better management of safety and security by
improving information sharing and decision
making. ISIM-B will improve the speed and
quality of decision making in response to
incidents by providing RTO staff with shared,
consistent,and accurate information about train
location, identity, and crewing on each train. In
addition, the status ofinfrastructure devices
(such as fans), including information about their
9. health, could be provided by ISIM-B as part of
the shared view.
3. Better customer information by improving the
quality, accuracy and timeliness of
communication. ISIM-B will overcome the
quality gap between B and A Division
information by supporting the deployment of
information delivery both in stations and via the
web.
4. Better operational plans and schedules ISIM-
B will make detailed historical data easily and
promptly available for analysis.As automation
improves both the quantity and quality of the
data available, it will be possible to develop
more efficient and effective schedules and plans
that represent a better service offering to
customers.
Development of the Concept of Operation
(CONOPS)
A series of Operational Process diagrams were
developed during the CONOPS phase a sample of which
is shown in Figure 9. These diagrams were used to
describe the “Day in the Life” useractivities integrated
with systems. Scenarios for both normal and deviation
from normal operations were developed. The columns
(swim-lanes) represent the steps performed by a particular
systemand user. The arrows represent the sequential
flow events and the flow of information.
Note: The operationsthat are highlighted by a circle
and letter represent those activitiesthat will be influence
by the new ISIM system.
Figure 9, Operational Process Diagram
At the same time that we were developing the Operational
Process diagrams, we began to identify a series of high-
level Operational Needs (Figure 10). Twenty needs were
derived through a series of stakeholderinterviews,
workshops,and analysis. These needs were then traced
back to the applicable pillar objective.
ISIM-B
Service
Management
Customer
Information
Management of
Safety and
Security
Planning and
Analysis
N1 – Provide operational staff with a shared
view/awareness of the state of the railroad –
inc. assets, staff, incidents, faults, etc.
N4 – Provide operational staff
with real-time graphical
Divisional performance
information by line.
N2 – Provide operational staff with real-time
train data, including train location, interval ID,
origin/destination, car numbers and crew
details (inc. non-revenue trains).
N5 – Provide operational staff
with real-time graphical train
performance data (inc.
schedule adherence).
N3 – Provide operational staff
with a terminal to terminal,
shared graphical view of the
current and projected train
timetable, and the ability to
easily and quickly implement
necessary unplanned changes.
N15 – Enable the phased deployment of data
collection and distribution capabilities, allowing
differences in data and presentation to operate
consistently together.
N7 – Provide consistent and
timely service performance
information to customers.
N6 – Provide customers with
consistent and timely train
arrival predictions for
stations.
N8 – Provide customers and
operational staff with
consistent and timely
information and predictions
about disruption to the train
service.
N10 – Provide operational staff
with a consistent view of
incident details, response
plans and operating
instructions.
N11 – Provide operational
alarms to alert staff to
predetermined combinations of
events that represent an
increased risk of incident.
N13 – Provide the timely and
open access to all the data
recorded by ISIM-B such that
it may be queried/analyzed/
mined/reported on, using both
COTS and custom tools.
N14 – Provide a replay facility
that uses data recorded by
ISIM-B to flexibly replay events
using a “model board”
representation.
N9 – Publish consistent and
timely service information,
predictions and data via the
internet.
N16 – Data source and information
distribution flexibility, minimizing constraints
in their provision and upgrade (inc. CBTC).
N18 – Record data in a manner that meets
statutory logging, quality and integrity record
keeping requirements.
N17 – Highly reliable and available,
tolerating faults, planned maintenance or
upgrade/enhancement without disabling the
whole ISIM-B system.
N19 – Tolerate any fault, planned maintenance
or upgrade/enhancement so that data quality
degrades and recovers both gracefully and
recognizably.
N20 – Standardize on a single source for
each data and standardize operational
processes.
V0.5 16-Oct-2012
N12 – Provide operational staff
with a shared and consistent
view of all completed
operational registers.
Figure 10, User Needs Diagram
The Operational Scenarios and User Needs formed
the foundation towards developing the SystemConcept
and System Contextual Concept. The System Concept
(Figure 11) groups the functional concept elements into
Capture, Integrate and Distribute actions. It also
established the initial boundary between ISIM and the
actors that influence or use the system.
Corporate
Communications
Operations
Planning
1. Provide Service
Plans
2. Generate Daily
Service Plans
3. Respond to Incidents
(Updating Plans)
4. Record B Division
Status / Events
Rapid Transit
Operations
5. Automatically
Record B Division
Status / Events
7. Integrated Single
Source of Current B
Division Service Plans
and Status
6. Track Train
Location
8. Computerized
Operations Registers
12. Open Data
Warehouse
9. Model Board
RCC and Backup
11. Real-time
Performance
Dashboard
15. Automated Service
Data to Web / Mobile
17. Deliver ISIM Service/
System(s) to Users
System Boundary
Note: intended to convey concepts and potential rather than define scopeMOWTIS
Operations
Planning
RTO
MOW
Customers
18. Maintain Subway/
Comms Infrastructure
13. Automated
Customer Information
to Stations
Station
Agents
Capture Integrate Distribute
Training
14. Upgraded Station
PA/CIS Infrastructure
10. Desktop (Intranet)
Model Board
Subway Systems,
Signalling Systems
(incl. CBTC),
Rolling Stock
3rd
Party
Developers
CBTC Systems
16. Service Plans and
Status to CBTC
Figure 11, System Concept Diagram
10. The Conceptual Context (Figure 12) diagram shifted
the view from the users to external systems that will
exchange data with ISIM. These systems fall into three
categories; the legacy systems that may need to be
modified to interface with ISIM, those systems that will
be subsumed by ISIM and those that may not exist and
need to be developed.
ISIM-B
V0.3 11-Oct-2012
Rapid
Scheduling
System (RSS)
Crew
Management
System
Image
Processing
Monitoring
Train ID Systems
(RFID/OCR)
Rolling Stock
Monitoring
(On-board)
Staff Clocking in
System
General Order
Planning System
Elevator and
Escalator
Monitoring
Subway Incident
Reporting
System
MTA Website
The Internet
Reporting/
Analysis Tools
Stringline Tools
Terminal
Disposition
System
Consist Report
System
I-Trac
Fixed Asset
Monitoring
Signalling
Systems (PLC)
Status
Status
Flagging
Data Incident
Data
Service
Information
Historical
Inform
ation
Consist Rpt
RTIF
External System
Possible Future
External System
Likely to be part
of ISIM-B
Alarms
Crew Plans &
Assignments
PA/CIS Phase II
CBTC
GO
Data
Service
Information
Clock
Rolling Stock
Maint. and Info.
Sys. (RSMIS)
Service
Information
Historical
Data
TrackCircuit/
Switchdata
Disposition Sheet
Service
Plans and
Historical
data
Time/Date
Status
Status
Train Location / Status
Train ID
&
Location
Current Service Plan
Flagging
Management
System
Figure 12, Conceptual Contextual Diagram
After the approval of the CONOPS, the design team
began to develop the systemspecification which included
the development of both whole systemand function
systemrequirements.
Development of the System Specification
During our design phase the following system
architectural views emerged.
Figure 13 is a top level, i.e. Level 0 or Context, data
flow diagram. This diagram contains one functional
process node (process 0: ISIM Office System) connected
with all the applicable external systemor elements.
During our design we developed an Interface
Requirement Specification for each interface and included
these as an appendix to our specification. The contractor
has the responsibility to provide as built Interface Design
Documents.
M3:
ISIM-B
Office System
ISIM-B User
Elevators/Escalators
LiftNet
Communications
Based Train Control
(CBTC)
Subway Incident
Reporting System
(SIRS)
Unified Timekeeping
System (UTS)
UGOS
Work-Train Manifest
Traction Power
SCADA
M1:
ISIM-B
Signal System
M4:
PA/CIS II
RCC Flagging
System (RCCF)
Rapid Scheduling
System
(RSS/HASTUS)
Rolling Stock
Maintenance
Information System
(RSMIS)
Requests/
Status
o Car Mileage
o Car Wash Dates
RTIF Files
Train
Prediction
Inform
ation
Crew
Information
Voice
External Train Arrival
Time
Bus Schedules &
On-Time
Performance
o ElevatorStatus
o Escalator Status
GO Information
Car Status
Bus Locations
Work Train Info
Train Position and
Train Health
Train Position and
Schedules
Flagging Zones
Train Event
Recorders
Train Event Data
Subway Incidents
o 3rd
Rail Power
o Fan Status
A-Division Train
Locations
Data Warehouse
Train Performance
Data
Login Info
Track Circuit Status
Train Operator Punch
Switch Position
Track direction
Figure 13, System Context (Level 0) Diagram
Figure 14 is the Level 1 Function Data Diagram. It
identifies all of the top level functions that are described
in our specification. This diagram shows the data flows
between internal ISIM functions as well as their
relationship with external elements.
Figure 14, System Functional (level 1) Diagram
Figure 15 is a sample of our Functional Specification.
The numbering convention is consistent with the above
System Function Diagram. Item 5.2.4 represents the
fourth sub-function of the level 1 Service Planning
function. Each section begins with a narrative which is
11. meant to provide an introduction to but, more importantly,
as a way to convey their intended purpose and context.
This is followed by the specific requirement. Using
IBM Dynamic Object Oriented Database (DOORs)
requirement tracing tool, each requirement is uniquely
identified. This database will be used for the entire
project lifecycle. The final section or query table is also
capture in DOORs. Since this procurement is a Request
for Proposal, these queries are our way to solicit process
and capability information from all bidders.
Figure 14 System Requirement Specifications
Summary and Conclusion
At the writing of this paper the status ofISIM is as
follows:
Module 1 Integrated Signals Data Acquisition –
Final Design has been approved and the project
is in the Procurement Phase
Module 2 Flushing Customer Communications –
Has been separated into 2 distinct projects. The
first project is for 6 stations and is undergoing a
60% Preliminary Design Review. The remaining
15 stations is entering Preliminary Design
Module 3 Rail Traffic Management System –
The Final Design has been submitted for review
and approval.
Module 4 Customer Communications
Subdivision B – This is a significant effort that
will span at least 3 Capital Programs. It is
currently in Master Plan Phase.
Implementing a System Engineering process is new
for NYCT and therefore we are still having some growing
pains. We are however committed to this approach and
believe that formal SE processes will help maintain
control over the project. We also believe leveraging the
lessons learned from previous systemprojects like ATS-A
and PACIS will help guide improvements for SE
processes as well as our ability to deliver the B division
ISIM systemboth in overall capability and the project
within budget and schedule.
The System Engineering Group has worked closely
with the Software Engineering Group to produce a
number of formal methods and process specifications.
These have included Data Item Description (DID)
documents that provide format and content to Contract
Deliverables and Method Sheets that detail the steps to an
often repeated process or how to review and approve
Contract Deliverables. We are piloting these processes
and by following a Continuous Process Improvement
(CPI) strategy expect them to be refined and mature over
time.
We remain focused on our Formal Processes and
through lesson learned and a Continuous Process
Improvement (CPI) strategy expect them to be refined
and mature over time.
If you have any lessons learned to share or ideas how we
can improve our chances for success, please contact me
at thomas.colacioppo@nyct.com.