SlideShare a Scribd company logo
1 of 1
Abstract
Since the closure of the Central American Seaway (3.5 million years ago), the Caribbean has been
more nutrient poor than the east Pacific. Bivalve genera occupying more nutrient-rich environments
are hypothesized to invest less energy in single eggs and produce more eggs of smaller sizes. Genera
occupying less nutrient-rich environments are thought to invest more energy per egg, reflected by
larger single egg sizes. To test these hypotheses, we created a database of egg and larval shell sizes
for marine bivalve genera. We compared these measurements for East Pacific and West Atlantic
bivalve genera to determine if egg and prodissoconch 1 (P1) sizes were affected by the environmental
conditions these bivalves experienced. Preliminary results are consistent with our hypothesis:
Caribbean egg sizes were larger than Panamanian egg sizes. More data for additional bivalves could
be collected from the literature and museum specimens to assess the robustness of these
preliminary results.
Examining the Effects of Nutrient Availability on Scallops in the East Pacific and West Atlantic
Background
• During the Pliocene Epoch, the Isthmus of
Panama formed (3.5 MYA), separating the
Western Atlantic (to the East) from the
Eastern Pacific (to the West). These regions
are known today as the Caribbean and
Panamanian Provinces, respectively (Figure
1).
• Since the emergence of the Isthmus, the
Panamanian Province has been more nutrient
rich, and the Caribbean province has been
more nutrient poor.
• Bivalve species have a larval shell known as
the prodissoconch. The prodissoconch is
often divided in to two portions: the
prodissoconch 1 (P1) and prodissoconch 2
(P2) (Figure 2).
• P1 size correlates with egg size, and trends in
P1 size can be interpreted as trends in egg
size.
Eastern Pacific-
Panamanian Province
Western
Atlantic-
Caribbean
Province
Figure 1: Images showing the Isthmus of Panama
and the time period of its emergence.
Figure 2: Photomicrograph of P1 and P2 boundary on clam
species Limaria licombi. Scale bar= 100 μm. (Malchus &
Sartori 2013).
Materials and Methods
• Using Google Scholar, searched the literature
for egg, P1, and P2 size data.
• Compiled a database in Excel of P1 and egg
size data.
• Used R Statistical Programming Language to
generate histograms of egg and P1 size
trends on the provincial scale, and also on
the familial scale.
• Used R to run Mann-Whitney U-tests for
Provincial data, and Binomial tests for
familial data.
Results
P1 Size (Micrometers)
Frequency
0 200 400 600 800 1200
05101520
P1 Size Comparison Between Caribbean and Panamanian Genera
Egg Size (Micrometers)
Frequency
0 50 100 150 200 250
051015
Egg Size Comparison Between Caribbean and Panamanian Genera
Figure 3: (A) shows egg size comparison histogram between
Panamanian and Caribbean Provinces. (B) shows P1 size comparison
histogram between Panamanian and Caribbean Provinces. Red bars
indicate Panamanian provincial data and blue bars represent
Caribbean provincial data. Red lines represent median for
Panamanian Province and blue lines represent median for Caribbean
Province. (C) shows the egg sizes and (D) shows the P1 sizes for
species belonging to the family Pectinidae. Similar charts (not shown)
were plotted for all families in Table 1 (A) and (B).
A. B.
Picture Family
Panamanian
Median Egg Size
Caribbean
Median Egg Size
1. Arcidae 70.55 85.15
2. Carditidae
3. Crassatellidae
4. Limidae 140 154.25
5. Mytilidae 71.5 75
6. Nuculidae
7. Ostreidae 42.5 104.4167
8. Pectinidae 46.1 67.75
9. Propeamussidae 117.5 131.25
10. Veneridae 62.25 63.5
Picture Family
Panamanian
Median P1 Size
Caribbean Median
P1 Size
1. Arcidae 120.6 131.16
2. Carditidae 166 173
3. Crassatellidae 105 141.5
4. Limidae 232.5 190.75
5. Mytilidae 108.5 141.75
6. Nuculidae 252.54 246.25
7. Ostreidae 66.875 109.75
8. Pectinidae 82.175 92.14583
9. Propeamussidae 157.25 180.875
10. Veneridae 94 92.5
A.
B.
C.
Hypothesis
• Bivalves in more nutrient-rich areas,
such as the Panamanian Province, will
invest less energy per single egg,
yielding smaller eggs and smaller P1
sizes (see figure 3).
• Bivalves occupying more nutrient-poor
areas, such as the Caribbean Province,
will invest more energy per egg, yielding
larger eggs and larger P1 sizes.
P1 Size (Micrometers)
Frequency
110 120 130 140 150 160 170 180
012345
P1 Size Comparison Between Caribbean and Panamanian Genera
Figure 3: Illustrates an expected P1 comparison chart between
Panamanian and Caribbean genera. Similar outcomes would be
expected for an egg size comparison chart. Blue indicates
Caribbean data, red indicates Panamanian data.
Tim Smith Advisor: Dr. Paul Harnik Hackman Summer Scholar Program & Independent Study
Discussion
• The Panamanian province shows a trend towards smaller
egg size characters, at the family and genus level.
• When examining variation across all Genera, the U-test
indicated low statistical significance of the results (Table
1c).
• When comparing egg size/ P1 size within families, the
binomial test also failed to indicate significance of the
results (Table 1a-c), but was considerably closer to the
p=0.05 target. Generally smaller data pools have a more
difficult time attaining statistical significance. The family
data contains far less data, and so the increase in
statistical significance at this level may be important.
• The genus-level results could be complicated by long-
term evolutionary differences among bivalves, whereas
the family-level results could indicate the specialization of
genera within families in different marine provinces. One
possible force driving this specialization could be the
different nutrient regimes in each province.
• More data needs to be collected in order to increase the
robustness of the data. If the same trend continues and
egg and P1 size data are collected for more families, we
may see that the p-value for the binomial test falls below
0.05.
Panamanian Caribbean U Test Binomial Test
P1 Median 105 130.6 p= 0.1754 p=0.09375
Egg Size
Median 75 102.3778 p= 0.4363 p=0.1171875
Table 1: (A) Panamanian and Caribbean median egg size chart. (B) Panamanian and
Caribbean median P1 size chart. For (A) and (B), the colored number is the larger
median of the two provinces. (C) Median Egg and P1 sizes on the genus level between
the provinces. U test results indicate the significance of the difference between the
results at this level. Binomial Test results indicate significance of the Family level data..
Histogram of Pectinidae$EggSize
Egg Size (Micrometers)
Frequency
60 65 70 75 80 85
0.00.51.01.52.0
Histogram of Pectinidae$P1
P1 Size (Micrometers)
Frequency
60 80 100 120 140 160
0246810
C. D.
Acknowledgements- I’d like to thank the Hackman summer scholars program for providing funding for this project. I’d like to thank Dr. Paul Harnik for his guidance through the project,
and continuing involvement as my independent study advisor. I’d like to thank the “Encyclopedia of Life” (eol.org) for the images of each family, and the makers of “R” statistical programming
language.
1. 2. 3.
4. 5. 6.
7. 8. 9. 10.

More Related Content

Viewers also liked

Viewers also liked (9)

Film opening 3 don't look now analysis
Film opening 3 don't look now analysisFilm opening 3 don't look now analysis
Film opening 3 don't look now analysis
 
Brouchure
BrouchureBrouchure
Brouchure
 
Math stories
Math storiesMath stories
Math stories
 
Przewodnik po kosztach życia studenckiego w Polsce
Przewodnik po kosztach życia studenckiego w PolscePrzewodnik po kosztach życia studenckiego w Polsce
Przewodnik po kosztach życia studenckiego w Polsce
 
Info nivel 1 avanzado
Info nivel 1 avanzadoInfo nivel 1 avanzado
Info nivel 1 avanzado
 
Piazza 1
Piazza 1Piazza 1
Piazza 1
 
Info nivel 1 básico
Info nivel 1 básicoInfo nivel 1 básico
Info nivel 1 básico
 
硅谷的那点事儿
硅谷的那点事儿硅谷的那点事儿
硅谷的那点事儿
 
Trutex Testimonial 2016
Trutex Testimonial 2016Trutex Testimonial 2016
Trutex Testimonial 2016
 

Similar to Nutrient Availability Impacts Scallop Egg and Larval Shell Sizes

Salamander Poster
Salamander PosterSalamander Poster
Salamander Posterwatsoh12
 
Factors influencing the somatic cell counts in goat milk in kenya
Factors influencing the somatic cell counts in goat milk in kenyaFactors influencing the somatic cell counts in goat milk in kenya
Factors influencing the somatic cell counts in goat milk in kenyaAlexander Decker
 
Cichlid fry project power point
Cichlid fry project power pointCichlid fry project power point
Cichlid fry project power pointHaileyDonaldson2
 
Pellet distribution modelling: a tool for improved feed delivery in sea cages
Pellet distribution modelling: a tool for improved feed delivery in sea cagesPellet distribution modelling: a tool for improved feed delivery in sea cages
Pellet distribution modelling: a tool for improved feed delivery in sea cagesInternational Aquafeed
 
Assessment of productive and reproductive performances of cross
Assessment of productive and reproductive performances of crossAssessment of productive and reproductive performances of cross
Assessment of productive and reproductive performances of crossAlexander Decker
 
Assessment of productive and reproductive performances of cross
Assessment of productive and reproductive performances of crossAssessment of productive and reproductive performances of cross
Assessment of productive and reproductive performances of crossAlexander Decker
 
Egg quality characteristics and phenotypic correlations among egg quality tra...
Egg quality characteristics and phenotypic correlations among egg quality tra...Egg quality characteristics and phenotypic correlations among egg quality tra...
Egg quality characteristics and phenotypic correlations among egg quality tra...Agriculture Journal IJOEAR
 
PancreaticLipaseResearchPoster
PancreaticLipaseResearchPosterPancreaticLipaseResearchPoster
PancreaticLipaseResearchPosterFiona Rambo
 
Cashmore Oaklea July 2015 Newsletter
Cashmore Oaklea July 2015 NewsletterCashmore Oaklea July 2015 Newsletter
Cashmore Oaklea July 2015 NewsletterJohn Keiller
 
Sea Snake (Lapemis hardwickii)
Sea Snake (Lapemis hardwickii)Sea Snake (Lapemis hardwickii)
Sea Snake (Lapemis hardwickii)kaiser AS
 
Aquaculture Design Project
Aquaculture Design ProjectAquaculture Design Project
Aquaculture Design ProjectBrendan Luther
 
Prices of Healthy and Unhealthy Foods. A global review
Prices of Healthy and Unhealthy Foods. A global reviewPrices of Healthy and Unhealthy Foods. A global review
Prices of Healthy and Unhealthy Foods. A global reviewessp2
 
Allan Thomas, Kerala ecocasd 2013- KAU.ppt
Allan Thomas, Kerala ecocasd 2013- KAU.pptAllan Thomas, Kerala ecocasd 2013- KAU.ppt
Allan Thomas, Kerala ecocasd 2013- KAU.pptDr Allan Thomas
 
NFSA website_Elizabeth-Lescheid-Pike-Floodplain
NFSA website_Elizabeth-Lescheid-Pike-FloodplainNFSA website_Elizabeth-Lescheid-Pike-Floodplain
NFSA website_Elizabeth-Lescheid-Pike-FloodplainElizabeth Lescheid
 
QUALITATIVE AND QUANTITATIVE CHARACTERS OF THREE COMMON CARP (Cyprinus carpio...
QUALITATIVE AND QUANTITATIVE CHARACTERS OF THREE COMMON CARP (Cyprinus carpio...QUALITATIVE AND QUANTITATIVE CHARACTERS OF THREE COMMON CARP (Cyprinus carpio...
QUALITATIVE AND QUANTITATIVE CHARACTERS OF THREE COMMON CARP (Cyprinus carpio...Repository Ipb
 

Similar to Nutrient Availability Impacts Scallop Egg and Larval Shell Sizes (20)

Salamander Poster
Salamander PosterSalamander Poster
Salamander Poster
 
Factors influencing the somatic cell counts in goat milk in kenya
Factors influencing the somatic cell counts in goat milk in kenyaFactors influencing the somatic cell counts in goat milk in kenya
Factors influencing the somatic cell counts in goat milk in kenya
 
Symposium 2009
Symposium 2009Symposium 2009
Symposium 2009
 
Cichlid fry project power point
Cichlid fry project power pointCichlid fry project power point
Cichlid fry project power point
 
Pellet distribution modelling: a tool for improved feed delivery in sea cages
Pellet distribution modelling: a tool for improved feed delivery in sea cagesPellet distribution modelling: a tool for improved feed delivery in sea cages
Pellet distribution modelling: a tool for improved feed delivery in sea cages
 
Assessment of productive and reproductive performances of cross
Assessment of productive and reproductive performances of crossAssessment of productive and reproductive performances of cross
Assessment of productive and reproductive performances of cross
 
Assessment of productive and reproductive performances of cross
Assessment of productive and reproductive performances of crossAssessment of productive and reproductive performances of cross
Assessment of productive and reproductive performances of cross
 
Senior Research Poster
Senior Research Poster Senior Research Poster
Senior Research Poster
 
Egg quality characteristics and phenotypic correlations among egg quality tra...
Egg quality characteristics and phenotypic correlations among egg quality tra...Egg quality characteristics and phenotypic correlations among egg quality tra...
Egg quality characteristics and phenotypic correlations among egg quality tra...
 
PancreaticLipaseResearchPoster
PancreaticLipaseResearchPosterPancreaticLipaseResearchPoster
PancreaticLipaseResearchPoster
 
SAEN Egg Stocking Article
SAEN Egg Stocking ArticleSAEN Egg Stocking Article
SAEN Egg Stocking Article
 
Cashmore Oaklea July 2015 Newsletter
Cashmore Oaklea July 2015 NewsletterCashmore Oaklea July 2015 Newsletter
Cashmore Oaklea July 2015 Newsletter
 
Sea Snake (Lapemis hardwickii)
Sea Snake (Lapemis hardwickii)Sea Snake (Lapemis hardwickii)
Sea Snake (Lapemis hardwickii)
 
Atlantic Salmon
Atlantic SalmonAtlantic Salmon
Atlantic Salmon
 
Aquaculture Design Project
Aquaculture Design ProjectAquaculture Design Project
Aquaculture Design Project
 
Prices of Healthy and Unhealthy Foods. A global review
Prices of Healthy and Unhealthy Foods. A global reviewPrices of Healthy and Unhealthy Foods. A global review
Prices of Healthy and Unhealthy Foods. A global review
 
Allan Thomas, Kerala ecocasd 2013- KAU.ppt
Allan Thomas, Kerala ecocasd 2013- KAU.pptAllan Thomas, Kerala ecocasd 2013- KAU.ppt
Allan Thomas, Kerala ecocasd 2013- KAU.ppt
 
NFSA website_Elizabeth-Lescheid-Pike-Floodplain
NFSA website_Elizabeth-Lescheid-Pike-FloodplainNFSA website_Elizabeth-Lescheid-Pike-Floodplain
NFSA website_Elizabeth-Lescheid-Pike-Floodplain
 
UMD REU NSF Poster
UMD REU NSF PosterUMD REU NSF Poster
UMD REU NSF Poster
 
QUALITATIVE AND QUANTITATIVE CHARACTERS OF THREE COMMON CARP (Cyprinus carpio...
QUALITATIVE AND QUANTITATIVE CHARACTERS OF THREE COMMON CARP (Cyprinus carpio...QUALITATIVE AND QUANTITATIVE CHARACTERS OF THREE COMMON CARP (Cyprinus carpio...
QUALITATIVE AND QUANTITATIVE CHARACTERS OF THREE COMMON CARP (Cyprinus carpio...
 

Nutrient Availability Impacts Scallop Egg and Larval Shell Sizes

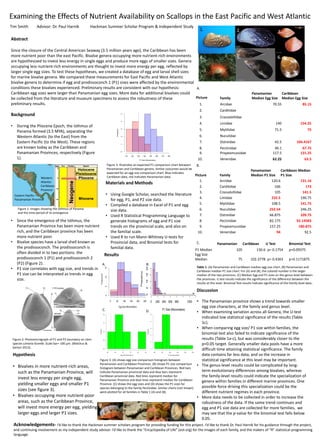
  • 1. Abstract Since the closure of the Central American Seaway (3.5 million years ago), the Caribbean has been more nutrient poor than the east Pacific. Bivalve genera occupying more nutrient-rich environments are hypothesized to invest less energy in single eggs and produce more eggs of smaller sizes. Genera occupying less nutrient-rich environments are thought to invest more energy per egg, reflected by larger single egg sizes. To test these hypotheses, we created a database of egg and larval shell sizes for marine bivalve genera. We compared these measurements for East Pacific and West Atlantic bivalve genera to determine if egg and prodissoconch 1 (P1) sizes were affected by the environmental conditions these bivalves experienced. Preliminary results are consistent with our hypothesis: Caribbean egg sizes were larger than Panamanian egg sizes. More data for additional bivalves could be collected from the literature and museum specimens to assess the robustness of these preliminary results. Examining the Effects of Nutrient Availability on Scallops in the East Pacific and West Atlantic Background • During the Pliocene Epoch, the Isthmus of Panama formed (3.5 MYA), separating the Western Atlantic (to the East) from the Eastern Pacific (to the West). These regions are known today as the Caribbean and Panamanian Provinces, respectively (Figure 1). • Since the emergence of the Isthmus, the Panamanian Province has been more nutrient rich, and the Caribbean province has been more nutrient poor. • Bivalve species have a larval shell known as the prodissoconch. The prodissoconch is often divided in to two portions: the prodissoconch 1 (P1) and prodissoconch 2 (P2) (Figure 2). • P1 size correlates with egg size, and trends in P1 size can be interpreted as trends in egg size. Eastern Pacific- Panamanian Province Western Atlantic- Caribbean Province Figure 1: Images showing the Isthmus of Panama and the time period of its emergence. Figure 2: Photomicrograph of P1 and P2 boundary on clam species Limaria licombi. Scale bar= 100 μm. (Malchus & Sartori 2013). Materials and Methods • Using Google Scholar, searched the literature for egg, P1, and P2 size data. • Compiled a database in Excel of P1 and egg size data. • Used R Statistical Programming Language to generate histograms of egg and P1 size trends on the provincial scale, and also on the familial scale. • Used R to run Mann-Whitney U-tests for Provincial data, and Binomial tests for familial data. Results P1 Size (Micrometers) Frequency 0 200 400 600 800 1200 05101520 P1 Size Comparison Between Caribbean and Panamanian Genera Egg Size (Micrometers) Frequency 0 50 100 150 200 250 051015 Egg Size Comparison Between Caribbean and Panamanian Genera Figure 3: (A) shows egg size comparison histogram between Panamanian and Caribbean Provinces. (B) shows P1 size comparison histogram between Panamanian and Caribbean Provinces. Red bars indicate Panamanian provincial data and blue bars represent Caribbean provincial data. Red lines represent median for Panamanian Province and blue lines represent median for Caribbean Province. (C) shows the egg sizes and (D) shows the P1 sizes for species belonging to the family Pectinidae. Similar charts (not shown) were plotted for all families in Table 1 (A) and (B). A. B. Picture Family Panamanian Median Egg Size Caribbean Median Egg Size 1. Arcidae 70.55 85.15 2. Carditidae 3. Crassatellidae 4. Limidae 140 154.25 5. Mytilidae 71.5 75 6. Nuculidae 7. Ostreidae 42.5 104.4167 8. Pectinidae 46.1 67.75 9. Propeamussidae 117.5 131.25 10. Veneridae 62.25 63.5 Picture Family Panamanian Median P1 Size Caribbean Median P1 Size 1. Arcidae 120.6 131.16 2. Carditidae 166 173 3. Crassatellidae 105 141.5 4. Limidae 232.5 190.75 5. Mytilidae 108.5 141.75 6. Nuculidae 252.54 246.25 7. Ostreidae 66.875 109.75 8. Pectinidae 82.175 92.14583 9. Propeamussidae 157.25 180.875 10. Veneridae 94 92.5 A. B. C. Hypothesis • Bivalves in more nutrient-rich areas, such as the Panamanian Province, will invest less energy per single egg, yielding smaller eggs and smaller P1 sizes (see figure 3). • Bivalves occupying more nutrient-poor areas, such as the Caribbean Province, will invest more energy per egg, yielding larger eggs and larger P1 sizes. P1 Size (Micrometers) Frequency 110 120 130 140 150 160 170 180 012345 P1 Size Comparison Between Caribbean and Panamanian Genera Figure 3: Illustrates an expected P1 comparison chart between Panamanian and Caribbean genera. Similar outcomes would be expected for an egg size comparison chart. Blue indicates Caribbean data, red indicates Panamanian data. Tim Smith Advisor: Dr. Paul Harnik Hackman Summer Scholar Program & Independent Study Discussion • The Panamanian province shows a trend towards smaller egg size characters, at the family and genus level. • When examining variation across all Genera, the U-test indicated low statistical significance of the results (Table 1c). • When comparing egg size/ P1 size within families, the binomial test also failed to indicate significance of the results (Table 1a-c), but was considerably closer to the p=0.05 target. Generally smaller data pools have a more difficult time attaining statistical significance. The family data contains far less data, and so the increase in statistical significance at this level may be important. • The genus-level results could be complicated by long- term evolutionary differences among bivalves, whereas the family-level results could indicate the specialization of genera within families in different marine provinces. One possible force driving this specialization could be the different nutrient regimes in each province. • More data needs to be collected in order to increase the robustness of the data. If the same trend continues and egg and P1 size data are collected for more families, we may see that the p-value for the binomial test falls below 0.05. Panamanian Caribbean U Test Binomial Test P1 Median 105 130.6 p= 0.1754 p=0.09375 Egg Size Median 75 102.3778 p= 0.4363 p=0.1171875 Table 1: (A) Panamanian and Caribbean median egg size chart. (B) Panamanian and Caribbean median P1 size chart. For (A) and (B), the colored number is the larger median of the two provinces. (C) Median Egg and P1 sizes on the genus level between the provinces. U test results indicate the significance of the difference between the results at this level. Binomial Test results indicate significance of the Family level data.. Histogram of Pectinidae$EggSize Egg Size (Micrometers) Frequency 60 65 70 75 80 85 0.00.51.01.52.0 Histogram of Pectinidae$P1 P1 Size (Micrometers) Frequency 60 80 100 120 140 160 0246810 C. D. Acknowledgements- I’d like to thank the Hackman summer scholars program for providing funding for this project. I’d like to thank Dr. Paul Harnik for his guidance through the project, and continuing involvement as my independent study advisor. I’d like to thank the “Encyclopedia of Life” (eol.org) for the images of each family, and the makers of “R” statistical programming language. 1. 2. 3. 4. 5. 6. 7. 8. 9. 10.