1. 9
Is Inflation on the Way?
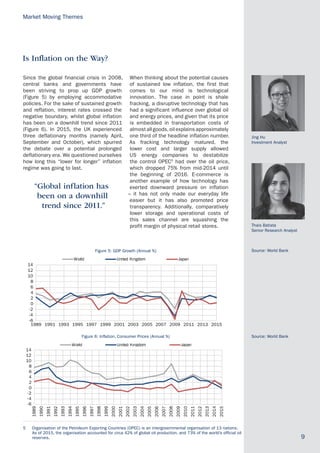
Since the global financial crisis in 2008,
central banks and governments have
been striving to prop up GDP growth
(Figure 5) by employing accommodative
policies. For the sake of sustained growth
and reflation, interest rates crossed the
negative boundary, whilst global inflation
has been on a downhill trend since 2011
(Figure 6). In 2015, the UK experienced
three deflationary months (namely April,
September and October), which spurred
the debate over a potential prolonged
deflationary era. We questioned ourselves
how long this “lower for longer” inflation
regime was going to last.
“Global inflation has
been on a downhill
trend since 2011.”
When thinking about the potential causes
of sustained low inflation, the first that
comes to our mind is technological
innovation. The case in point is shale
fracking, a disruptive technology that has
had a significant influence over global oil
and energy prices, and given that its price
is embedded in transportation costs of
almostallgoods,oilexplainsapproximately
one third of the headline inflation number.
As fracking technology matured, the
lower cost and larger supply allowed
US energy companies to destabilize
the control OPEC5
had over the oil price,
which dropped 75% from mid-2014 until
the beginning of 2016. E-commerce is
another example of how technology has
exerted downward pressure on inflation
– it has not only made our everyday life
easier but it has also promoted price
transparency. Additionally, comparatively
lower storage and operational costs of
this sales channel are squashing the
profit margin of physical retail stores.
Market Moving Themes
Source: World BankFigure 5: GDP Growth (Annual %)
-6
-4
-2
0
2
4
6
8
10
12
14
1989 1991 1993 1995 1997 1999 2001 2003 2005 2007 2009 2011 2013 2015
World United Kingdom Japan
Figure 6: Inflation, Consumer Prices (Annual %)
-6
-4
-2
0
2
4
6
8
10
12
14
1989
1990
1991
1992
1993
1994
1995
1996
1997
1998
1999
2000
2001
2002
2003
2004
2005
2006
2007
2008
2009
2010
2011
2012
2013
2014
2015
World United Kingdom Japan
Source: World Bank
5 Organisation of the Petroleum Exporting Countries (OPEC) is an intergovernmental organisation of 13 nations.
As of 2015, the organisation accounted for circa 42% of global oil production, and 73% of the world’s official oil
reserves.
Jing Hu
Investment Analyst
Thais Batista
Senior Research Analyst
2. 10
Globalisation, free trade and free flows
of capital have also anchored inflation
in certain ways. As developed countries
outsource manufacturing to emerging
economies in order to take advantage of
lower labour costs, the products are sold
at lower prices, hence putting downward
pressure on inflation. As we are currently
witnessing populist governments rising
and blaming globalisation for unfair
wealth distribution, a potential backlash
on free trade means higher prices for
manufactured goods. Trump supporters
certainly did not anticipate that LED TVs
and iPhones made in the USA will cost
more than those made in China, whilst
Brexit voters seem to be willing to pay a
higher price for imported goods if they get
‘freedom’ and border control over Europe.
Demographics, however, have a complex
link with inflation. Developed countries
tend to have ageing populations, which
indicates, in theory, more expensive labour
and higher inflation, assuming demand is
stable. However, in the EU and in regions
that allow easy movement of people, as
the economies receive additional workers
from nearby, lower-paid countries, the
labour supply is balanced out and wage
pressure is contained. A different story
has evolved in Japan where disinflation/
deflation has been a reality for decades.
According to Masaaki Shirakawa (2012), a
former governor of Japan’s central bank,
people have gradually realised that the
nation’s aging population and the declining
population size implies lower future growth
and therefore lower income. Their mindset
of cutting back on current consumption
and investment to save for retirement
leads to persistent deflationary pressures
(Liu & Westelius, 2016). The rebound on
inflation in 2014 (Figure 6) was a delayed
response to Japan’s Prime Minister Shinzo
Abe’s “three arrows”6
, as well as a result
of the population spending ahead of Abe’s
first round sales-tax hike in April 2014. As
the monetary and fiscal effort dissipates,
the deflationary cultural mindset may regain
prominence once again.
“A potential backlash on free
trade means higher prices
for manufactured goods.”
Moving back to the UK, the Consumer
Price Index7
(CPI) finally moved away from
the deflationary danger zone at the turn
of 2016 (Figure 7). The inflation path in
the UK can predominantly be explained in
two ways. In terms of sector composition
of the CPI inflation, service is the single
largest contributor, accounting for 48% of
the UK’s inflation in 2016 (Figure 7).
Market Moving Themes
6 The “three arrows” consist of fiscal stimulus, monetary easing and structural reforms. They form the
foundation of the so-called Abenomics, aiming to reflate the Japanese economy among others.
7 CPI is one of the inflation measure monitored by the UK government and the Bank of England (UK’s
central bank). The other key measure of inflation is RPI (Retail Price Index). RPI is typically higher than
CPI as the former includes an element of housing costs.
Figure 7: Contributions to CPI inflation (%)
-2
-1
0
1
2
3
4
5
6
-2
-1
0
1
2
3
4
5
6
Services (48%) Food and non-alcoholic beverages (10%)
Electricity and gas (4%) Fuels and lubricants (3%)
Other goods(b) (35%) CPI inflation [RHS]
Source: Bank of England
3. 11
While service inflation has remained
positive, other components – including
fuels, electricity and gas as well as
food and beverages – have remained
deflationary since the beginning of 2015.
This leads us to analyse the inflation
number from another angle.
In the UK, much of the variance in the cost
of consumer goods and services can be
explained not only by energy but also non-
energy imported costs (Figure 8). As the
oil price decreased by 75% between 2013
and 2015 and commodities in general lost
close to 50% of their value in US dollar
terms, one can expect the headline CPI
to reflect that move. On top of that, the
trade-weighted sterling strength over the
same period further depressed the UK’s
imported prices, which in turn contributed
to further downward pressure on the price
levels in Britain. This effect is mostly
evident in food and beverage prices, as
the sector’s deflation was amplified by the
intense competition amongst food retailers,
narrowing the price gap with discounters.
This can be seen through the likes of Aldi
and Lidl’s success in the UK market.
Upon confirmation that a referendum
would be held on the UK’s ongoing EU
membership (November 2015), the
uncertainty ahead of the vote drove the
British pound down circa 10% versus
a basket of currencies of the country’s
trading partners.
As the country settled on ‘Leave’ (23rd
June 2016), the drawdown of the currency
was extended to 17% by early August.
In order to offset the negative impact of
the vote on the economy, the Bank of
England8
(BOE) lowered its Bank Rate9
for
the first time since 2009, and resumed
the asset-buying programme for the first
time since 2012 amongst other initiatives
to ensure ample liquidity and continued
accommodative financing conditions in
the market. The stimulus package sent
sterling down further still, recording a
fall of almost 22% off its peak in late
2015. “We are willing to tolerate a bit of
an overshoot in inflation over the course
of the next few years in order to cushion
the blow and make sure the economy
can adjust as well as possible,” the BOE
president, Mark Carney, said in October.
Looking ahead, when will we start feeling
the pain from the inflation pressure
transmitted through various channels?
According to the BOE’s central economic
projection (November 2016), inflation
would rise from its current level of 1.2%
to around 2.75% in 2018 before falling
back gradually over 2019 to 2.5% in
three years’ time. However, the market
thinks differently: UK 10 years Inflation
linked Gilts are trading at -1.90% as of
January 2017, implying a higher inflation
expectation of 3.1%.
Market Moving Themes
Figure 8: Contributions to unit cost growth for consumer goods and services (%)
-4
-1
2
5
8
11
-5
0
5
10
15
20
Labour Energy Imports Tax Unit cost growth (RHS)
Source: Bank of England
8 The Bank of England is Britain’s central bank, with the mandate to deliver price stability (i.e. low
inflation) and, subject to that, to support the economic growth and employment in the country.
9 Bank rate, also called policy rate, is the rate at which a central bank charges retail banks for borrowing
from the former.
4. 12
The recent recovery in UK inflation data
was more or less driven by a rally in oil
prices and pick-up in services prices
(Figure 7). However, a sign of the sterling’s
depreciation impact being transmitted
into the UK’s headline inflation was
shown in the September 2016 inflation
number. The contribution from fuels and
lubricants, as well as food and beverages,
had a noticeable uptick in recent months,
and the trend is forecasted to persist.
The BOE estimates 48% of the goods
sold in the UK are imported, and non-
energy imports account for nearly a third
of the CPI basket. Typically, imported
costs of food and oil feed through at a
rather fast pace while the pass-through
for other items is more drawn-out. We
have seen anecdotal evidence of price
pressure building up along the supply
chain; so far however, retailers have
managed to negotiate inflation away with
suppliers or explored import substitutions,
not to mention misleading marketing
practices, such as maintaining prices but
diminishing package contents, also known
as ‘shrinkflation’.
It is uncertain how long retailers and
manufacturers can stomach their eroding
profitability. As estimated by the BOE,
companies’ profit margins recovered to
pre-crisis levels in early 2016 and have
narrowed since (Figure 9).Higher costs
of imported goods will further squeeze
companies’ profitability, but an additional
effort is being made in the sector to cut
operational costs before passing anything
through to consumers due to the ongoing
price competition mentioned previously.
As implied earlier, the other major driver of
future inflation is commodity prices.
As of December 2016, fuel prices in the UK
hit an 18-month high. So far, the rebound
in the oil price has been purely based on
the OPEC and some non-OPEC suppliers’
joint announcement of a production cut,
but future oil price movements will depend
on whether the oil giants adhere to their
promises, not to mention Donald Trump’s
support for the US energy industry, which
might contribute to an increase in oil
supply.
“A sign of the sterling’s
depreciation impact being
transmitted into the UK’s
headline inflation was
shown in the September
2016 inflation number.”
As with the costs of imported goods
the price recovery in agricultural and
industrial commodities is currently hidden
in the UK corporates’ input costs, putting
further pressure on those companies’
profit margins. CPI measures inflation at
the consumer level while the Producer
Price Index (PPI) measures price changes
received at the wholesale or producer
level. As shown in Figure 10, such a large
gap between the UK CPI and the PPI input
prices is typically unsustainable. Assuming
the value of sterling is unchanged, CPI
inflation would need to converge towards
the degree of increase in input prices.
Would reflation bring back wage growth
in the UK? The consensus is that the
economy is expected to slow on the back
of Brexit, one of the reasons being the
lack of conviction of companies to invest.
Market Moving Themes
Figure 9: Corporate margins on consumer goods and services (%)
-6
-4
-2
0
2
4
6
Source: Bank of England
5. 13
Therefore, a certain degree of slack
should persist in the labour market, which
theoretically anchors wage growth. On
the other hand, it also depends on how
firms respond to the rising inflation after
prolonged disinflation in the economy,
whether a norm of a lower wage level
has been established, or whether the
transmission channel from inflation to
wage growth is still existent. Another
reason to hope for higher wages is the
Brexit effect on immigration, decreasing
labour supply and reversing the equilibrium
mentioned previously.
“A rise in inflation erodes
the value of investors’
bond holdings.”
Inflation impacts not only on our day-to-
day income and spending, but also our
overall wealth through how our assets
respond to a move in prices (inflation).
Equities and bonds are the two major
asset classes held in our pensions,
ISAs and taxable investment accounts.
Theoretically, a rise in inflation erodes
the value of investors’ bond holdings, and
expectations of overshooting inflation are
the predominant driver for policymakers
to raise rates so that inflation is under
control. As bond prices respond with an
inverse relationship to interest rates,
higher rates mean lower bond prices, and
the longer the maturity of the bond, the
larger the losses are for bond holders.
So far, despite bond investors earning
decreasing and even negative rates, they
have been enjoying a long and significant
appreciation in bond prices.
The lower income generated by bonds
has been more than compensated for
by capital appreciation. However, we are
going through a reversal on this trend and
this might persist for some time.
“An inflation pick-up is a
sign of economic strength
and while equities tend to
appreciate, they also behave
as a good store of value in
an inflationary environment.”
The balance between the impact of rates
rising on inflation and growth prospects is
fragile. For bonds, a rate rise is negative
in a simple straight scenario, while for
equities, it depends on which stage
we are at of an economic cycle. When
the economy is recovering, an inflation
pick-up is a sign of economic strength
and while equities tend to appreciate,
they also behave as a good store of value
in an inflationary environment. The path
of interest rate hikes is designed to be
gradual in order to not depress the growth
momentum, in which case both inflation
and mild rate rises are positive for the
equity market. When inflation is potentially
overshooting central banks’ targets, the
path of interest rate hikes becomes
steep as central banks are more likely to
be behind the curve. In this scenario, a
sharp rise in policy rate is damaging to the
equity market because it is a sign that the
economy is overheating and that credit
conditions may become difficult for firms
with large and maturing debt.
Market Moving Themes
Figure 10: Enlarged gap between PPI and CPI (year-on-year %)
-20
-10
0
10
20
30
40
50
-1
0
1
2
3
4
5
6
UK CPI EU Harmonized NSA (%) UK PPI Input Prices All Import (%) [RHS]
Source: Bloomberg
6. 14
Equity valuations fall as investors request
higher real returns to compensate for
the higher inflation and the riskiness of
owning indebted companies. Another
scenario where equities might not perform
well is under stagflation, which means
we experience inflation amidst negative/
flat GDP growth. Because higher inflation
is deemed transitory due to weaker
economic projections, the BOE should be
reluctant to raise rates and curb inflation.
“Although the chance of
hyperinflation in the UK is
close to zero, the power of
psychology cannot be ign-
ored given the major politi-
cal shift we have witnessed.”
Inflation can also be explained by
psychology, especially hyperinflation. We
witness hyperinflation in countries with
large and persistent government deficits,
which is merely a symptom of the core
reasons – typically political instability as
a result of losing a war, civil unrest, a
break in the political system or any other
major crisis that causes the government
to finance its expense through money
printing and devaluation of the currency.
At the same time, the population lose faith
in the institutions and in paper money,
going on a feedback loop that is hard to
break. In 1923’s Weimar Germany, losing
WW1 forced the nation to repay its huge
war debts to the winners. The Weimar
Republic had to sell huge amounts of
marks at any cost for foreign currencies
to make the payment, which led to
hyperinflation. At an extreme, the nation
reached an inflation rate of 29,500% p.a.
The country was exhausted by the post-
war reparations and this was one of the
causes of Adolf Hitler taking power.
A more recent example happened in
Zimbabwe in 2008. The nation’s ‘land
reforms’ which aimed to redistribute
white Zimbabweans’ land for the sake of
ethical rebalance sent the economy to a
halt. The government’s support for the
neighbouring Congo’s civil war as well as
the prompted capital flight caused a period
of extraordinary hyperinflation, where
local prices were doubling every two days.
The government had to ditch its currency
and use the South African Rand or the
US dollar instead. Hyperinflation happens
across continents and throughout history.
Today, South Sudan and Venezuela are
experiencing this phenomenon with both
inflation rates above 400% on an annual
basis (Statista, 2016).
Although the chance of hyperinflation
in the UK is close to zero, the power of
psychology cannot be ignored given the
major political shift we have witnessed
over the last few months. The impact
on the UK’s price level from both the
recovery of commodity prices and the
currency depreciation largely relies on
the interaction amongst corporations,
residentsandpolicymakers.Assumingthat
credit conditions remain accommodative,
and consumption growth is resilient on
the back of it, there could be less burden
on corporations’ profit margins and less
pass-through of the cost to consumers,
so that the Bank of England’s economic
projection is achievable.
Overall, we see technology and
demographics still impacting inflation
negatively over the long term, but the
reasons mentioned above are topped
up by a possible backward walk on free
trade and anti-immigration, which could
certainly lead to higher inflation in the
short and medium term.
Market Moving Themes
References
• Bank of England. (2015). Inflation Report, November 2015.
• Bank of England. (2016). Inflation Report, August 2016.
• Bank of England. (2016). Inflation Report, November 2016.
• BBC News. (2016, January 05). Fuel Prices Hit 18-month High, after OPEC Production Cuts.
Retrieved from http://www.bbc.co.uk/news/business-38505980
• Liu, Y., & Westelius, N. (2016). IMF Working Paper: The Impact of Demographics on Productivity and
Inflation in Japan.
• McCafferty, I. (2016, December 20). Speech on the UK Economy: Where Now? Our Emerging
Understanding of the Impact of the Referendum on the Economic Outlook.
• PWC. (2016). Leaving the EU: Implications for the UK Financial Services Sector.
• Statista. (2016, January). The 20 countries with the highest inflation rate in 2016.
Retrieved from https://www.statista.com/statistics/268225/countries-with-the-highest-inflation-rate
![10
Globalisation, free trade and free flows
of capital have also anchored inflation
in certain ways. As developed countries
outsource manufacturing to emerging
economies in order to take advantage of
lower labour costs, the products are sold
at lower prices, hence putting downward
pressure on inflation. As we are currently
witnessing populist governments rising
and blaming globalisation for unfair
wealth distribution, a potential backlash
on free trade means higher prices for
manufactured goods. Trump supporters
certainly did not anticipate that LED TVs
and iPhones made in the USA will cost
more than those made in China, whilst
Brexit voters seem to be willing to pay a
higher price for imported goods if they get
‘freedom’ and border control over Europe.
Demographics, however, have a complex
link with inflation. Developed countries
tend to have ageing populations, which
indicates, in theory, more expensive labour
and higher inflation, assuming demand is
stable. However, in the EU and in regions
that allow easy movement of people, as
the economies receive additional workers
from nearby, lower-paid countries, the
labour supply is balanced out and wage
pressure is contained. A different story
has evolved in Japan where disinflation/
deflation has been a reality for decades.
According to Masaaki Shirakawa (2012), a
former governor of Japan’s central bank,
people have gradually realised that the
nation’s aging population and the declining
population size implies lower future growth
and therefore lower income. Their mindset
of cutting back on current consumption
and investment to save for retirement
leads to persistent deflationary pressures
(Liu & Westelius, 2016). The rebound on
inflation in 2014 (Figure 6) was a delayed
response to Japan’s Prime Minister Shinzo
Abe’s “three arrows”6
, as well as a result
of the population spending ahead of Abe’s
first round sales-tax hike in April 2014. As
the monetary and fiscal effort dissipates,
the deflationary cultural mindset may regain
prominence once again.
“A potential backlash on free
trade means higher prices
for manufactured goods.”
Moving back to the UK, the Consumer
Price Index7
(CPI) finally moved away from
the deflationary danger zone at the turn
of 2016 (Figure 7). The inflation path in
the UK can predominantly be explained in
two ways. In terms of sector composition
of the CPI inflation, service is the single
largest contributor, accounting for 48% of
the UK’s inflation in 2016 (Figure 7).
Market Moving Themes
6 The “three arrows” consist of fiscal stimulus, monetary easing and structural reforms. They form the
foundation of the so-called Abenomics, aiming to reflate the Japanese economy among others.
7 CPI is one of the inflation measure monitored by the UK government and the Bank of England (UK’s
central bank). The other key measure of inflation is RPI (Retail Price Index). RPI is typically higher than
CPI as the former includes an element of housing costs.
Figure 7: Contributions to CPI inflation (%)
-2
-1
0
1
2
3
4
5
6
-2
-1
0
1
2
3
4
5
6
Services (48%) Food and non-alcoholic beverages (10%)
Electricity and gas (4%) Fuels and lubricants (3%)
Other goods(b) (35%) CPI inflation [RHS]
Source: Bank of England](data:image/gif;base64,R0lGODlhAQABAIAAAAAAAP///yH5BAEAAAAALAAAAAABAAEAAAIBRAA7)