InstructionsView CAAE Stormwater video Too Big for Our Ditches.docx
Minimum Wage Puerto Rico
1. Case 1: The Minimum Wage in Puerto Rico
A.(1) In order to estimate the impact of the kaitz index over time on the average wage and emplyment,
estimate the following equations:
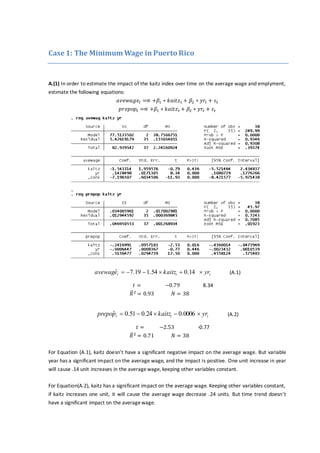
𝑎𝑣𝑒𝑤𝑎𝑔𝑒𝑡 =∝ +𝛽1 ∗ 𝑘𝑎𝑖𝑡𝑧 𝑡 + 𝛽2 ∗ 𝑦𝑟𝑡 + 𝜀𝑡
𝑝𝑟𝑒𝑝𝑜𝑝𝑡 =∝ +𝛽1 ∗ 𝑘𝑎𝑖𝑡𝑧 𝑡 + 𝛽2 ∗ 𝑦𝑟𝑡 + 𝜀𝑡
ttt yrkaitzeavewag 14.054.119.7ˆ (A.1)
𝑡 = −0.79 8.34
𝑅̅2 = 0.93 𝑁 = 38
ttt yrkaitzpprepo 0006.024.051.0ˆ (A.2)
𝑡 = −2.53 -0.77
𝑅̅2
= 0.71 𝑁 = 38
For Equation (A.1), kaitz doesn’t have a significant negative impact on the average wage. But variable
year has a significant impact on the average wage, and the impact is positive. One unit increase in year
will cause .14 unit increases in the averagewage, keeping other variables constant.
For Equation(A.2), kaitz has a significant impact on the average wage. Keeping other variables constant,
if kaitz increases one unit, it will cause the average wage decrease .24 units. But time trend doesn’t
have a significant impact on the averagewage.
2. A. (2) In order to see the impact of kaitz index and average minimum wage lagged one period and two
periods on average wage, estimatethe following equations:
tttttt yrkaitzkaitzkaitzavewage **** 322110
tttttt yraveaveaveavewage *min*min*min* 322110
tttttt yrkaitzkaitzkaitzprepop **** 322110
tttttt yraveaveaveprepop *min*min*min* 322110
3.
4. ttttt yrkaitzkaitzkaitzeavewag *12.0*59.2*21.0*08.188.6ˆ 21 (A.3)
𝑡 = −0.36 − 0.05 0.8 5.68
𝑅̅2
= 0.94 𝑁 = 36 𝐷𝑊 = 0.08
ttttt yraveaveaveeavewag *03.min*52.min*14.min*66.70.1ˆ 21 (A.4)
𝑡 = 3.11 − 0.39 2.50 5.74
𝑅̅2 = 0.99 𝑁 = 36 𝐷𝑊 = 0.53
ttttt yrkaitzkaitzkaitzpprepo *0003.*01.*17.*11.50.ˆ 21 (A.5)
𝑡 = −0.67 − 0.75 0.09 − 0.25
𝑅̅2
= 0.64 𝑁 = 36 𝐷𝑊 = 0.33
ttttt yraveaveavepprepo *002.min*05.min*08.min*01.32.ˆ 21 (A.6)
𝑡 = −0.47 − 1.58 1.66 2.33
𝑅̅2 = 0.80 𝑁 = 36 𝐷𝑊 = 0.60
As shown above, kaitz still doesn’t have significant impact on average wage, but the time trend and
average minimum wage have significant impact on average wage. The impact of time trend and average
minimum wageare positive.
Neither kaitz nor average minimum wage have significant impact on employment. In (A.6), time trend
has significant impact on employment; however, the impact is quite small.
Benefit:
This method takes in to account both current and past impact of kaitz and avemin, making the models
more consistent with economic theory.
Cost:
1) The various laggedvalues of kaitz and avemin arequite likely to be severely multicollinear, making
coefficient estimates unreliable.
2) The estimated coefficients arenot smoothly declining which is not consistent with theory.
3) Since we use lagged variables, the degrees of freedom tend to decrease, making the estimate tend
to be imprecise.
4) There exists severely positive serial correlation.
A.(3)
Estimate the following equations:
𝑎𝑣𝑒𝑤𝑎𝑔𝑒 𝑡 =∝ +𝛽1 ∗ 𝑘𝑎𝑖𝑡𝑧 𝑡 + 𝛽2 ∗ 𝑎𝑣𝑒𝑤𝑎𝑔𝑒 𝑡−1 + 𝛽3 ∗ 𝑦𝑟𝑡 + 𝜀𝑡
𝑝𝑟𝑒𝑝𝑜𝑝𝑡 =∝ +𝛽1 ∗ 𝑘𝑎𝑖𝑡𝑧 𝑡 + 𝛽2 ∗ 𝑝𝑟𝑒𝑝𝑜𝑝𝑡−1 + 𝛽3 ∗ 𝑦𝑟𝑡 + 𝜀𝑡
5. The results are:
𝑎𝑣𝑒𝑤𝑎𝑔𝑒 𝑡̂ = −.34 + .81 ∗ 𝑘𝑎𝑖𝑡𝑧 𝑡 + .96 ∗ 𝑎𝑣𝑒𝑤𝑎𝑔𝑒 𝑡−1 + .004 ∗ 𝑦𝑟𝑡 (A.7)
(. 304) (. 026) (.004)
𝑡 = 2.67 36.48 .87
𝑅̅2
= 0.99 𝑁 = 37 𝐷𝑊 = 1.16
𝑝𝑟𝑒𝑝𝑜𝑝̂ 𝑡 = .08 − .14 ∗ 𝑘𝑎𝑖𝑡𝑧 𝑡 + .76 ∗ 𝑝𝑟𝑒𝑝𝑜𝑝𝑡−1 + .0007 ∗ 𝑦𝑟𝑡 (A.8)
(. 056) (. 094) (.0005)
𝑡 = −2.52 8.17 1.49
𝑅̅2
= 0.89 𝑁 = 37 𝐷𝑊 = 1.54
Both kaitz and lag averagewagehave significant impact on average wage, and the impact is positive.
Both kaitz and lag employment have significant impact on average wage, and the impact of kaitz is
negativewhile the impact of lag employment is positive.
Long Run Multiplier
Long run multiplier measures the totalimpact of kaitz on averagewage(employment).
For (A.7),
25.2025*81.0
96.01
1
*81.0
1
1
1
Therefore, the totalimpact of kaitz on averagewageis 20.2
For (A.8),
6. 58.017.4*14.0
76.01
1
*14.0
1
1
1
Therefore, the totalimpact of kaitz on employ is -0.58
Durbin’s h statistic
For (A.7),
96.126.2
026.0371
37
)16.1*5.01(
1
*)5.01( 22
sn
n
dh
Since the absolute value of h is greater than 1.96, reject the null hypothesis of no first-order serial
correlation. There exists serial correlation.
For (A.8),
96.1079.2
094.0371
37
)54.1*5.01(
1
*)5.01( 22
sn
n
dh
Since the absolute value of h is greater than 1.96, reject the null hypothesis of no first-order serial
correlation. There exists serial correlation.
Benefit:
1) Koyck distributed lag model can solve some problems which occur in ad hoc model, like
multicollinearity.
2) It also considers the past impact of kaitz, making the estimation more consistent with economic
theory. It also imposes the declining impact of the variables over time, which did not occur in the ad
hoc laggedmodels.
Cost:
1) The error term in the koyck model is almost sure to be serially correlatedwhich violate Classical
Assumption.
2) Because the uncorrected serial correlation acts like an omitted variable, in this sense, all the
estimated coefficients, their standard errors, and residuals which are in OLS estimation are biased,
especially the coefficient of lag dependent variable.
3) In small samples (less than 50) the estimates arealso likely to be biased.
(A.4)
According to the results above, I come up with this equation system:
Structure Equation 1: 𝑎𝑣𝑒𝑤𝑎𝑔𝑒 𝑡 = 𝑓(𝑝𝑟𝑒𝑝𝑜𝑝𝑡, 𝑘𝑎𝑖𝑡𝑧𝑡, 𝑎𝑣𝑒𝑤𝑎𝑔𝑒𝑡−1, 𝑦𝑟𝑡)
Structure Equation 2: 𝑝𝑟𝑒𝑝𝑜𝑝𝑡 = 𝑓(𝑎𝑣𝑒𝑤𝑎𝑔𝑒𝑡, 𝑘𝑎𝑖𝑡𝑧𝑡, 𝑝𝑟𝑒𝑝𝑜𝑝𝑡−1,𝑦𝑟𝑡 )
Reduced From Regressions:
Reduced Form Equation 1: 𝑎𝑣𝑒𝑤𝑎𝑔𝑒 𝑡 = 𝑓(𝑝𝑟𝑒𝑝𝑜𝑝𝑡−1, 𝑘𝑎𝑖𝑡𝑧 𝑡,𝑎𝑣𝑒𝑤𝑎𝑔𝑒 𝑡−1,𝑦𝑟𝑡)
Reduced Form Equation 2: 𝑝𝑟𝑒𝑝𝑜𝑝𝑡 = 𝑓(𝑎𝑣𝑒𝑤𝑎𝑔𝑒𝑡−1, 𝑘𝑎𝑖𝑡𝑧 𝑡,𝑝𝑟𝑒𝑝𝑜𝑝𝑡−1, 𝑦𝑟𝑡)
Stage1: Create instrument to replace prepop, avewage
7. The instrumental variables are avewage_iand prepop_i. Since these two variables are good proxies
for the endogenous variable, and uncorrelated with the error term. So If I then use these two
instrumental variables to replace the endogenous variables where they appear as explanatory variables,
the new explanatory variables will be uncorrelated with the error term, and Classical Assumption III will
be met, without losing important information.
Stage2: Use theinstruments in theoriginal structuralequations
8. 𝑎𝑣𝑒𝑤𝑎𝑔𝑒 𝑡 = −.69 + 1.08 ∗ 𝑝𝑟𝑒𝑝𝑜𝑝_𝑖 𝑡 + 1.11 ∗ 𝑘𝑎𝑖𝑡𝑧 𝑡 + .99 ∗ 𝑎𝑣𝑒𝑤𝑎𝑔𝑒 𝑡−1 + .0007 ∗ 𝑦𝑟𝑡 (A.9)
𝑡 = 1.33 − 2.97 29.43 − 0.13
𝑅̅2
= 0.998 𝑁 = 37 𝐷𝑊 = 1.29
𝑝𝑟𝑒𝑝𝑜𝑝𝑡 = .04 − .01 ∗ 𝑎𝑣𝑒𝑤𝑎𝑔𝑒𝑖 𝑡
− .16 ∗ 𝑘𝑎𝑖𝑡𝑧 𝑡 + .68 ∗ 𝑝𝑟𝑒𝑝𝑜𝑝𝑡−1 + .002 ∗ 𝑦𝑟𝑡 (A. 10)
𝑡 = −2.58 − 3.11 7.34 3.03
𝑅̅2
= 0.907 𝑁 = 37 𝐷𝑊 = 1.66
As shown above, for (A.9), employ, kaitz index and lag average wage have significant impact on average
wage. All the impacts are positive.
For (A.10), all the explanatory variables in this equation have significant impacts on employment. And
kaitz index has negative impact on employment which is consistent with economic theory.
Benefit:
1) In addition to former consideration, this method also considers jointly determination of average
wageand employment, making the estimation much closer to the reality.
2) This method use two stageleast square estimate to avoid simultaneity bias.
3) It is far more accurateto use t-test for hypothesis testing with 2SLS estimators than it is with OLS
estimators.
Cost:
1) With small sample size, 2SLS still has expected negative bias in terms of estimation.
9. (B)
Best Specified StructureEquation System:
),,,/min,/( 1 tttttttt yrprgnpprepopprdefaveprdefavewagefprepop
),,,/,/min(/ 11 ttttttttt yrprgnpprepopprdefavewageprdefavefprdefavewage
In this structure equation system, I use real wage instead of nominal variable to indicate the wage
level. Since kaitz index and avemin are highly correlated, so I drop kaitz by using real average
minimum wage.
Reduced From Regressions:
Reduced Form Equation 1:
),,,/,/min( 111 tttttttt yrprgnpprepopprdefavewageprdefavefprepop
Reduced From Equation 2:
),,/,,/min(/ 111 ttttttttt yrprgnpprdefavewageprepopprdefavefprdefavewage
Stage1: Create instrument avewage_r_i , prepop_i to replace prepop and tt prdefavewage /
11. Employment (A.11)
tttttttt yrprgnpprepopprdefaveprdefavewageprepop *001.*000.*56./min*11./*07.23. 1
𝑡 = 1.10 − 1.92 2.63 0.26 − 0.45
𝑅̅2 = 0.88 𝑁 = 37 𝐷𝑊 = 1.44
Real AverageWage (A.12):
yrprgnpprdefaveprdefavewageprepopprdefavewage tttttttt *007.000./min*28./*95.*43.10./ 11
𝑡 = 0.60 5.78 1.82 0.84 − 1.11
𝑅̅2 = 0.99 𝑁 = 37 𝐷𝑊 = 1.61
Policy implication:
From the two equations above, real minimum wagedoesn’t have significant impact on either
employment or real averagewage. Inthis sense, there is no need to consider allowing a lower
minimum which is helpless to raising the earnings of workers on the island.
Benefits:
1) This method considers jointly determination and uses 2SLS to avoid the simultaneity bias.
2) This method also considers both current and past impact of averagewageand employment.
3) This method even considers the impacts from GNP, making the model more consistent with
economic theory.
4) This method uses realeconomic variable instead of nominal ones to make it more accurate.
Cost:
1) This method has the potential problems of 2LSL. The estimated coefficients might be biased.
2) It is likely to have serial correlation.