Call Girls Service Jaipur {9521753030 } ❤️VVIP BHAWNA Call Girl in Jaipur Raj...
Ash 2010 poster
1. 0
20
40
60
80
100
120
140
1H 24H
No DNase I
DNase I
Percentcellyield
1
10
100
1,000
10,000
100,000
1,000,000
10,000,000
3 12 21 30 39 48 57 66 75 84
Size (µm)
Concentration(#/mL)
Cell aggregation can be readily observed after thawing peripheral blood progenitor cell
(PBPC) products used in HSCT
•The impact on total cell number available for reinfusion into recipients is unknown and
precise quantification of cell clumping has been difficult.
•Whether aggregation occurs more often in PBPCs or in umbilical cord blood units has
not been addressed.
•Micro-flow imaging (MFI) is a novel method of imaging biologic fluids and provides a
means for investigating cell aggregation following cryopreservation.
•Most transplant centres have clear targets in terms of thawing and rates of stem cell
product infusion to limit cellular injury and prevent cell clumping.
•Further, some centres have reported the use of washing the thawed stem cell product
and/or treating with DNase I as a method of reducing cytotoxicity and preventing cell
clumping.
•MFI is a specialized flow microscope which provides size distribution, concentration
and morphological data on multi-component populations of sub-visible particles in
solution.
120
1.40E+06
1.60E+06
Cell aggregation in thawed hematopoietic stem cell products
visualized using micro-flow imaging
Luke Wu1, Teresa Martin2, Lin Yang3, Michael Halpenny3, Antonio Giulivi3, David Allan1,4,5
1Regenerative Medicine Program, Ottawa Hospital Research Institute; 2Brightwell Technologies, Ottawa, ON; 3Stem Cell Laboratory, Canadian Blood Services, Ottawa, ON;
4Blood and Marrow Transplant Program, The Ottawa Hospital and 5Department of Medicine, University of Ottawa, ON, Canada
ResultsIntroduction
Methods
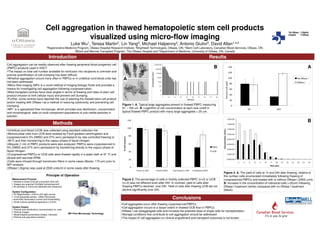
Figure 1. A. Typical large aggregates present in thawed PBPC measuring
61 – 162 um. B. Logarithm of cell concentration at each size cutoff in
typical thawed PBPC product with many large aggregates > 20 um.
A
B
B
A
0
20
40
60
80
100
Fresh (1-4H) Fresh (24H) Post thaw (1-4H) Postthaw (24H)
%Cellrecovery
PBPC
UCB
0.00E+00
2.00E+05
4.00E+05
6.00E+05
8.00E+05
1.00E+06
1.20E+06
1.40E+06
3 4 5 6 7 8 9 10 11 12 13 14 15 16
Size (µm)
Concentration(#/mL)
•Umbilical cord blood (UCB) was collected using standard collection kits
•Mononuclear cells from UCB were isolated by Ficoll gradient centrifugation and
cryopreserved in 5% DMSO and 37% (w/v) pentastarch by rate controlled freezing to
-80°C and then transferring to the vapour phase of liquid nitrogen.
•Aliquots (1 ml) of PBPC products were also analyzed: PBPCs were cryopreserved in
5% DMSO and 37% (w/v) pentastarch by transferring directly to the vapour phase of
liquid nitrogen.
•Cryopreserved PBPCs or UCB cells were thawed rapidly in a water bath at 37 °C and
diluted with warmed RPMI.
•Cells were infused through transfusion filters in some cases (Baxter, 170 µm) prior to
MFI analysis.
•DNase I (Sigma) was used at 2500 units/ml in some cases after thawing.
Methods
Figure 2. The percentage of cells in freshly collected PBPC (n=3) or UCB
(n=3) was not different even after 24h. In contrast, yield of cells after
thawing PBPCs declined over 24h. Yield of cells after thawing UCB did not
decline significantly over 24h.
Figure 3. A. The yield of cells at 1h and 24h after thawing, relative to
the number cells enumerated immediately following thawing of
cryopreserved PBPCs and treated with or without DNase I (2500 u/ml).
B. Increase in the concentration of individual cells (<20um) following
DNase I treatment (white) compared with no DNase I treatment
(black).
Conclusions
•Cell aggregates occur after thawing cryopreserved PBPCs
•Cell aggregation occurs to a lesser extent in thawed UCB than in PBPCs
•DNase I can disaggregate cells and increase the potential dose of single cells for transplantation
•Storage conditions that contribute to cell aggregation should be addressed
•The impact of cell aggregation on clinical engraftment and transplant outcomes is not known
Measurement Process:
• Sample is drawn through a precision flow cell
• Images are acquired (multiple frames/second)
• All particles in frame are detected and measured
System Configuration:
• 5X Magnification, 475nm LED light source
• 10 bit grayscale sensor, 1280x1024 pixels
• Automatic illumination control and thresholding
• Small volume sampling apparatus (<0.5ml)
System Output:
• Particle size distributions (concentration vs. size)
• Particle images
• Morphological parameters (shape, intensity)
• Particle sub-population isolation
Principle of Operation
Detection
Zone
MFI Flow Microscopy Technology