March 2018 Greater Palm Springs Area Housing Market Report

Some markets have had increases in signed contracts but the vast majority of the nation continues to experience fewer closed sales and lower inventory compared to last year at this time. Greater Palm Springs Area Housing Market was one of market that had increases in singed contracts. In March 2018, Closed Sales decreased 9.4 percent, Pending Sales increased 2.5 percent, Inventory decreased 9.9% percent over last year. The overall Median Sales Price was up 2.7 percent to $340,000. Buyer demand remains very strong throughout the Coachella Valley with fewer inventory. If you thought about selling your home this year, now may be the time to do it. Team Michael Keller Williams Realty (CalBRE#00938044) Trusted Since 1986 http://www.servingpalmsprings.com Team Michael Keller Williams Realty (CalBRE#00938044) Trusted Since 1986
Recommended
Recommended
More Related Content
Recently uploaded
Recently uploaded (20)

Featured
Featured (20)
March 2018 Greater Palm Springs Area Housing Market Report
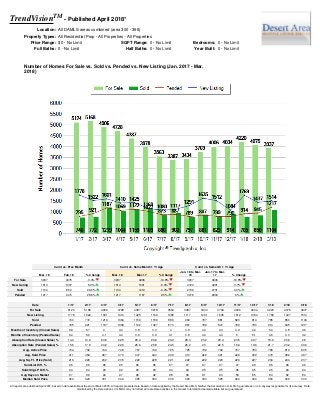
- 1. TrendVisionTM - Published April 2018* Location: All DAMLS areas combined (area 300 - 398) Property Types: All Residential Prop - All Properties - All Properties Price Range: $0 - No Limit SQFT Range: 0 - No Limit Bedrooms: 0 - No Limit Full Baths: 0 - No Limit Half Baths: 0 - No Limit Year Built: 0 - No Limit Number of Homes For Sale vs. Sold vs. Pended vs. New Listing (Jan. 2017 - Mar. 2018) Curnt vs. Prev Month Curnt vs. Same Month 1 Yr Ago Curnt vs. Same Qtr 1 Yr Ago Mar. 18 Feb. 18 % Change Mar. 18 Mar. 17 % Change Jan. 18 to Mar. 18 Jan. 17 to Mar. 17 % Change For Sale 3937 4075 -3.4% 3937 4906 -19.8% 3937 4906 -19.8% New Listing 1514 1437 5.4% 1514 1601 -5.4% 4720 4901 -3.7% Sold 1104 850 29.9% 1104 1219 -9.4% 2739 2731 0.3% Pended 1217 945 28.8% 1217 1187 2.5% 3076 2903 6% Date 1/17 2/17 3/17 4/17 5/17 6/17 7/17 8/17 9/17 10/17 11/17 12/17 1/18 2/18 3/18 For Sale 5124 5168 4906 4728 4387 3978 3563 3387 3434 3769 4006 4034 4220 4075 3937 New Listing 1778 1522 1601 1410 1425 1169 1080 1117 1291 1635 1512 1084 1769 1437 1514 Sold 740 772 1219 1064 1159 1189 886 960 797 881 823 914 785 850 1104 Pended 795 921 1187 1069 1122 1027 873 887 789 847 799 790 914 945 1217 Months of Inventory (Closed Sales) 6.9 6.7 4 4.4 3.8 3.3 4 3.5 4.3 4.3 4.9 4.4 5.4 4.8 3.6 Months of Inventory (Pended Sales) 6.4 5.6 4.1 4.4 3.9 3.9 4.1 3.8 4.4 4.4 5 5.1 4.6 4.3 3.2 Absorption Rate (Closed Sales) % 14.4 14.9 24.8 22.5 26.4 29.9 24.9 28.3 23.2 23.4 20.5 22.7 18.6 20.9 28 Absorption Rate (Pended Sales) % 15.5 17.8 24.2 22.6 25.6 25.8 24.5 26.2 23 22.5 19.9 19.6 21.7 23.2 30.9 Avg. Active Price 734 732 744 748 757 749 725 725 739 762 767 783 796 819 835 Avg. Sold Price 411 459 467 473 437 443 439 410 422 421 429 439 479 482 467 Avg. Sq. Ft. Price (Sold) 216 229 232 235 222 228 221 222 222 223 229 227 234 244 237 Sold/List Diff. % 96 96 96 95 96 96 97 97 97 97 97 96 96 96 96 Sold/Orig LP Diff. % 94 94 93 92 93 93 94 94 95 95 95 95 95 94 94 Avg Days on Market 97 99 94 97 96 92 98 96 91 90 83 85 84 82 84 Median Sold Price 304 320 331 349 325 330 336 320 330 325 324 340 350 349 340 All reports are published April 2018, based on data available at the end of March 2018. All reports presented are based on data supplied by the Desert Area MLS. Neither the Association nor its MLS guarantees or is in anyway responsible for its accuracy. Data maintained by the Association or its MLSs may not reflect all real estate activities in the market. Information deemed reliable but not guaranteed.