1. BACKGROUND and AIMS:
Based on Andrews et al. (2011) metal-on-metal hip replacement (MOMHR) seems to be an
alternative to hip surgical procedure, however, this metal replacement have some negative
side effects in the health of the patients. It has been proved that notable concentrations of
both cobalt (Co) and chromium (Cr) are responsible in the total bone mineral density and
reduced bone turnover in affected individuals (Andrews et al., 2011).
Under these circumstances, this study aims to analyse the correlation
between patients with MOMHR and the function and survival of their
osteoclast. 16 patients were selected after 8 years to observe their
MOMHR application; 2 groups with high or low metal exposure (HME/LME)
with median Co and Cr serum concentrations of 0.4μg/L and 0.65μg/L
respectively for HME, and 0.09μg/L and 0.08μg/L for LME.
OSTEOCLAST SURVIVAL AND FUNCTION IN PATIENTS WITH WELL-
FUNCTIONING METAL-ON-METAL HIP RESURFACING (MOMHR)
GROUP H
FIGURE 1 - ILLUSTRATION OF
METAL-ON METAL HIP
REPLACEMENT PROSTHESIS
HYPOTHESIS:
Four variables were tested to correlated the ion levels in each patient and the osteoclast
survival and activity. Through observation and the analysis of the results, it is expected to notice
a difference between HME and LME patients.
In this case, four specific hypothesis were made for each measured variable.
VARIABLE 1 - Osteoclast number:
H0 - There is no significant difference in osteoclast survival in patients with HME and LME. (H0 =
HME Osteoclast number𝜇 - LME Osteoclast number𝜇 = 0).
Ha - There is significant difference in osteoclast survival in patients with HME and LME. (Ha = HME
Osteoclast number𝜇 - LME Osteoclast number𝜇 ≄ 0).
VARIABLE 2 - Resorbing osteoclasts per disc:
H0 - There is no significant difference in the number of functional osteoclasts when comparing
patients with HME and LME. (H0 = HME Functional osteoclasts𝜇 - LME Functional osteoclasts𝜇 = 0).
Ha - There is significant difference in the number of functional osteoclasts when comparing
patients with HME and LME. (Ha = HME Functional osteoclasts𝜇 - LME Functional osteoclasts𝜇 ≄ 0).
VARIABLE 3 - % resorption per disc:
H0 - There is no significant difference between the total proportion of osteoclastic resorption in
groups of patients with HME and LME. (H0 = HME Osteoclastic resorption𝜇 - LME Osteoclastic resorption𝜇 = 0).
Ha - There is significant difference between the total proportion of osteoclastic resorption in
groups of patients with HME and LME. (Ha = HME Osteoclastic resorption𝜇 - LME Osteoclastic resorption𝜇 ≄ 0).
VARIABLE 4 - Resorption/resorbing osteoclast per dis:
H0 - There is no significant difference in relative activity when comparing patients with HME and
LME. (H0 = HME Relative activity𝜇 - LME Relative activity𝜇 = 0).
Ha - There is significant difference in relative activity when comparing patients with HME and
LME. (Ha = HME Relative activity𝜇 - LME Relative activity𝜇 ≄ 0).
RESEARCH QUESTION:
Is there a difference in osteoclast survival and function in patients with HME and LME?
METHODS:
Authors used osteoclastogenic media (OM) containing RANKL and M-CSF for the formation of
osteoclast cells. Sample was taken from peripheral blood. All patients cell were treated with OM
to analyse:
1. Osteoclast survival.
2. Number of resorbing osteoclasts
3. Percentage resorption were quantified following tartrate resistant acid phosphatase TRAP-
staining.
ANALYSIS OF DATA:
16 patients were divided in 2 groups (HME and LME) to analyse the correlation between the
level of metal exposure and the survival and function of their osteoclast.
For the analysis both Excel and Prism software were used. Firstly, Excel was used to obtain
descriptive statistics: mean, median, percentiles and IQR (Table 1 - 4). Secondly, Prism served
to proved Excel results and for statistical analysis (Table 5). With both software possible outliers
and data distribution were observed.
Each patient had more than one measure for each variable. Hence, an average of the measures
was made as it can be seen in Table 1 - 4. Once the mean of each variable was calculated a box
and whisker plot was used to displayed the values obtained (Figure 2-5).
Regarding to the statistical analysis data was analysed as numerical continuous, therefore the
type of test used depended if data was normally distributed or not. D’Agostino-Pearson omnibus
normality test was used to test if values were in a normal distribution. Then depending on the
distribution, either unpaired t test with Welch’s correction or Mann-Whitney test were used.
REFERENCES:
Andrews, R.E., Shah, K.M., Wilkinson, J.M. & Gartland, A. (2011) Effects of cobalt and chromium ions at clinically equivalent concentrations after metal-on-metal hip replacement on human
osteoblasts and osteoclasts: Implications for skeletal health. Bone, 49 (4), pp.717–723.
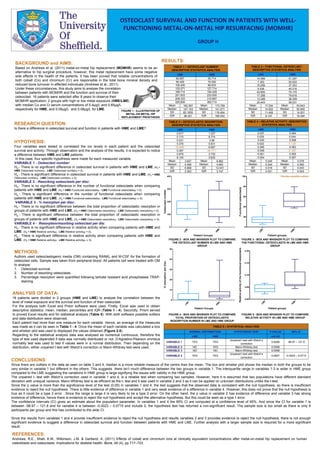
RESULTS:
CONCLUSIONS:
Since there are outliers in the data as seen on table 3 and 4, median is a more reliable measure of the centre than the mean. The box and whisker plot shows the median in both the groups to be
very similar in variable 1 but different in the others. This suggests there isn’t much difference between the two groups in variable 1. The interquartile range in variables 1-3 is wider in HME group
compared to the LME suggesting the variations in HME group is large signifying the issues with validity in the HME group.
The unpaired t- test with Welch’s correction used in variable 1 and 4, is a reliable test when comparing two samples. However, here it is assumed that two populations have different standard
deviation with unequal variance. Mann-Whitney test is as efficient as the t- test and it was used in variable 2 and 3 as it can be applied on unknown distributions unlike the t-test.
Since the p value is more than the significance level of the test (0.05) in variables 1 and 4, the test suggests that the observed data is consistent with the null hypothesis, so there is insufficient
evidence to reject the null hypothesis. There is little evidence of difference in variable 1 and very weak evidence of a difference in variable 4. However, this does not prove that the null hypothesis is
true as it could be a type 2 error . Since the range is large it is very likely to be a type 2 error. On the other hand, the p value in variable 2 has evidence of difference and variable 3 has strong
evidence of difference, hence there is evidence to reject the null hypothesis and accept the alternative hypothesis. But this could be seen as a type 1 error.
The confidence intervals (CI) gives an estimate about the population parameter. In variables 1 and 4 the 95% CI are computed at a confidence level of 95%. And since the CI for variable 1 is
between -98.97 – 121.8 and for variable 4 is between -0.0023 – 0.0715 and include 0, the hypothesis test has returned a non-significant result. The sample size is too small as there is only 8
participants per group and this has contributed to the wide CI.
Since the results from variables 1 and 4 provide insufficient evidence to reject the null hypothesis and results variables 2 and 3 provides evidence to reject the null hypothesis, there is not enough
significant evidence to suggest a difference in osteoclast survival and function between patients with HME and LME. Further analysis with a larger sample size is required for a more significant
result.
FIGURE 2 - BOX AND WHISKER PLOT TO COMPARE
THE OSTEOCLAST NUMBER IN LME AND HME
GROUP
FIGURE 4 - BOX AND WHISKER PLOT TO COMPARE
TOTAL PROPORTION OF OSTEOCLASTIC
RESORPTION NUMBER IN LME AND HME GROUP
FIGURE 5 - BOX AND WHISKER PLOT TO COMPARE
RELATIVE ACTIVITY IN LME AND HME GROUP
FIGURE 3 - BOX AND WHISKER PLOT TO COMPARE
THE FUNCTIONAL OSTEOCLASTS IN LME AND HME
GROUP
TABLE 1 – OSTEOCLAST NUMBER:
DESCRIPTIVE STATISTICS ANALYSIS
LME HME
60.857 35.714
95.429 79.000
108.400 88.833
125.571 127.714
168.714 154.429
201.833 233.000
208.333 310.667
329.800 360.714
Mean 162.367 Mean 173.759
Median 147.143 Median 141.071
SD 85.1855 SD 116.464
IQR 98.301 IQR 166.042
TABLE 2 – FUNCTIONAL OSTEOCLAST:
DESCRIPTIVE STATISTICS ANALYSIS
LME HME
14.589 51.297
7.353 50.503
15.056 37.353
5.536 45.316
42.655 70.170
17.268 79.616
13.369 38.359
20.443 56.531
Mean 17.034 Mean 53.643
Median 14.822 Median 50.900
SD 11.448 SD 14.831
IQR 6.197 IQR 16.364
TABLE 3 – OSTEOCLASTIC RESORPTION:
DESCRIPTIVE STATISTICS ANALYSIS
LME HME
0.617 1.237
0.173 8.774
0.231 2.86
0.376 5.631
18.468* 6.657
0.367 39.171*
0.879 3.735
8.145 3.632
Mean 3.657 Mean 8.962
Median 0.496 Median 4.683
SD 6.568 SD 12.431
IQR 2.363 IQR 3.747
TABLE 4 – RELATIVE ACTIVITY: DESCRIPTIVE
STATISTICS ANALYSIS
LME HME
0.037 0.064
0.029 0.044
0.040 0.058
0.022 0.129*
0.066 0.063
0.049 0.165*
0.061 0.055
0.054 0.057
Mean 0.045 Mean 0.079
Median 0.044 Median 0.060
SD 0.016 SD 0.043
IQR 0.021 IQR 0.024
TABLE 5 – STATISTICAL ANALYISIS
NORMAL DISTRIBUTION HYPOTHESIS TEST P-VALUE 95% CI
LME HME α=0.05
VARIABLE 1 YES YES
Unpaired t test with Welch’s
correction
0.8268 -98.97 – 121.8
VARIABLE 2 NO YES Mann-Whitney test 0.0006
VARIABLE 3 NO NO Mann-Whitney test 0.0499
VARIABLE 4 YES YES
Unpaired t test with Welch’s
correction
0.0627 -0.0023 – 0.0715
* Denotes possible outliers