1. Documentation - Software
Research
The majority of the research involved with the software side of the project was conducted
through online forums as well as online documentation provided by Microsoft. The so called
“MSDN” forums provided by said company provide detailed descriptions of each class
contained within the pre-defined C# libraries in addition to information on how to use them.
Since the programming experience acquired in previous courses was sufficient in solving most
software issues encountered, the key component of the research for this project consisted of
examining code examples and syntax explanations.
Since Inversa expected a software package that both suits their needs as well as has a
professional and clean look, some research included investigating similar software packages
used in other industries for similar tasks. This was especially useful for designing the
functionality of the security features for this software package.
Communication
The process of designing the communication protocol was fairly complex and involved close
cooperation with team member Parker Menzies who was in charge of programming the micro
controller. There were, initially, several viable options to be considered for the design of the
communication protocol. The micro could have a cache of measurements and send the most
recent ones based on specific requests from the software client, or it could continuously stream
the data with a time stamp indicating the time difference in measurements. Since the
measurements in question are RMS values, and the exact time of the each measurement is
actually irrelevant to the field laptop operator, it was decided that a continuous stream of data
with a time indication would suit this project the best.
Connecting to the micro
In order to establish a connection between the software client and the micro controller while
making the process as unnecessarily complicated for the user as possible, a simple “start” and
“stop” button design was chosen. The software will contact the windows device manager in
order to scan for all serially connected devices and then display their associated communication
port numbers in a drop down menu. This makes it easy for a user to select the correct port and
it ensures that it is impossible to select an unassigned port by mistake. If the start button is
then pressed the program will scan that port for an open connection (where an “open
connection” is defined by whether or not Windows has detected a connected device sending
data) and if the port is in fact open, the program will receive and process data from the device
on that port until the stop button is pressed. Once the start button has been pressed and the
2. connection was successful, the error log will receive an entry stating the occurrence of said
event. In addition to that, the start button will become inactive once successfully connected to
make it impossible to accidentally spama press of the start button. Naturally, pressing the stop
button will in turn close the connection, although there are unsolved issues if this is done while
there is an incoming data stream as was described previously. If the communications port that
was selected in the drop down menu does not have an active connection (implying that the
micro is assigned to a different port) a pop up will appear prompting the user to modify their
port selection.
Graphical Layout of communication Modules:
Figure x.x – Communication Module (GUI)
In addition to the functions previously described, another helpful indicator for the user was
included with the communication module. Once data from the microcontroller is received the
software client will display the mode that that the systemis currently in while also providing a
helpful indicator “LED” to aid in quickly determining the mode. The color scheme for the
indicator light was chosen in such a way that it reflects universally accepted standards, ie. Black
simply means the systemhas not even started and green displays “On” which is the regular
mode of operation. The following series of figures will display all of the modes of system
operation as displayed by the software client.
Figure x.x – Charging Mode as displayed by the GUI
Figure x.x – Standby Mode as displayed by the GUI
3. Figure x.x – On Mode as displayed by the GUI
Communication Protocol
The micro sends a continuous stream of a static data structure, in which each measurement has
2 bytes. Serial communication protocol forces the MSB to be sent first at all times, meaning the
software was designed to decipher the incoming message by shifting each second byte to the
left by one byte and then store it as a value. To allow for expandability, a start and stop byte
was implemented. The software client will only attempt to reconstruct received data structures
if a start byte was received and it will cease to create an array of incoming data when the stop
byte is received. As is implied by this method the array storing the received data is of dynamic
size and changes as the software client receives additional data. As an additional software
stability feature, the program will force the thread responsible for graphing the data to wait for
complete data transmission before attempting to redraw the graphs. This is to ensure that the
program will never read from the same place in memory while attempting to write to it (see
error section).
Debugging and Testing
Testing and debugging for this large software package was a very lengthy and careful process.
Initially the entire software package and the front end hooks for each module were al included
in the same project file. It quickly became apparent that this is not an efficient way to go about
debugging such a large software package due to the fact that the initial code quickly became
cluttered and difficult to debug properly. The next attempt at debugging and coding the
software was much more efficient and consisted of creating a separate module for each
individual major function of the project, and individually testing them for proper performance.
Each individual module was tested and modified on its own, while being commented and
documented properly. This process vastly accelerated the overall development of the code.
Some of the separately coded modules included the error log, the graphing module as well as
the individual pop ups that were necessary to implement.
The most complex module that was part of the software package and was also by far the most
difficult module when it came to testing and debugging, was the communication module
4. between the software package and the micro controller. The initial testing consisted of
understanding how the micro sends data to the PC and how a communication protocol could be
implemented. Group member Parker Menzies proceeded to design the final version of the data
structure sent by the micro, and using software tools such as Putty, the first task was to
understand how data is received by the PC and how to reconstruct it in the proper order. Prior
to this part of the testing, a loopback test was conducted using the software itself with a
physical serial loopback connection and an oscilloscope. Characters sent from the software
were properly received both back in the software itself and on the scope. The function used to
implement the software loopback testing is included in the final code but is commented out as
it was no longer needed. At first testing simply included sending the same predefined structure
in an infinite loop until it was confirmed using a simple test module that the software received
the data properly. From this point on, testing was conducted with actual measurements as
described in the next section.
Test platform debugging with micro
In order to simulate the input that would normally be received from the sensor that were
designed by group B1, a simple breadboard test platform was constructed. Each potentiometer
was responsible for simulating one input measurement. Since each measurement was
represented by 2 bytes in the data structure the potentiometer readings were interpreted as
readings from 0-1023. These readings were reconstructed in the software and then plotted on
graphs. By adjusting the resistance of the individual potentiometers and cross referencing the
plotted results in software with physically measured voltages the design team was able to
debug and confirm the proper operation of the communication between the micro and the
software.
Errors/Problems encountered
There were numerous issues when debugging this software package. Most were based on
issues derived from the fact that the connection between the field laptop and the
microcontroller is based on a serial connection emulated on USB port. Even the though the
physical connection is in fact a USB connector, Windows will treat the connection as if it was in
fact a serial connection. This can lead to a number of issues, especially when attempting to
disconnect from the micro while said device is still streaming data.
Key Features
One of the most fundamental features included in this software package is the one that could
potentially save the entire product from a fatal current overload or short circuit. By pressing the
“Kill Switch” button, the user can remotely as well as safely shut down the entire system by
simply pressing one button. After pressing this button the software will prompt the user to
5. make sure if the press of the button was not accidental and if “Yes” is pressed the software will
proceed to send the shut down signal to the microcontroller which in turn proceeds to switch
the relays in their proper shut down order. The signal sent is the ASCII character “X” and the
micro controller treats this as an interrupt, in other words if “X” is received by the micro, it will
cease any other operations and proceed to safely shut the systemdown.
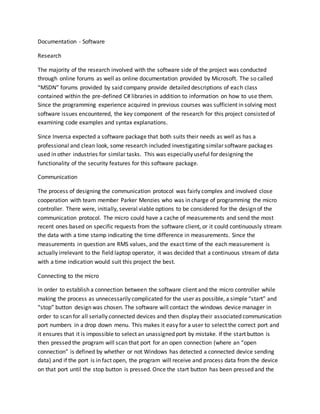
Figure x.x – The pop up that appears when the kill switch button is pressed.
Since one of the original requirements from Inversa’s problem statement required the team to
design a software client that can display relevant measurements, it was clear that when it came
to software design, designing a clear and logical method for displaying these measurements
was crucial. The chosen design is actually a replica of the design Microsoft uses in the Task
Manager when displaying CPU performance.
The following snapshot shows the graphs (with no data input):
6. Figure x.x – The graphs used in the GUI (no input)
The dark background was chosen so that the light and lime green lines showing the grid and the
actual received data will be easily visible at all times (regardless of the environment the field
laptop is operated in). The y-axis scales were chosen based on a combination of the limits
imposed by the fuses in the physical design as well as the maximum possible values the sensors
can read. There are no actual x-axis scales as can be seen in the above screenshot. This is
intentional because the actual time of received data is irrelevant to the operator. Rather than
implementing axis labels for the horizontal axis the microcontroller timestamps every single
7. measurements and the points are plotted based on how far apart the measurements were
taken. This can be observed especially when the micro is switching modes. While the micro is
switching modes its highest priority is to send the correct signals to the different relays and only
when it has completed this task successfully will it again start streaming data to the software.
The graphs should then simply have a line connecting the last two data points due to the
timestamps. Thus this method allows the user to have some reference to time in terms of
measurement times relative to one another, which is essentially the only necessary x-axis
reference needed for this software client.
The second major feature of the program is the capability to log errors and important events
for future reference. This is done using the error log located on the left half of the GUI.
Event Warning Error Error Sound Logged Popup
Connectiontomicrocontroller No No No Yes No
Disconnectedfrommicro No No No Yes No
Software cannotconnectto micro No No No No Yes
OutputCurrentbetween1.5A-2.0A Yes No No Yes No
InputCurrentbetween1.5A-2.0A Yes No No Yes No
DC bus currentbetween13.5A-14.0A Yes No No Yes No
DC bus voltage between10.5V-11.0V Yes No No Yes No
Temperature between55-65 Yes No No Yes No
Batterybelow10% Yes No No No No
Batterybelow5% No Yes No Yes Yes
Outputcurrentabove 2.0A No Yes Yes Yes Yes
Inputcurrentabove 2.0A No Yes Yes Yes Yes
DC current above 14.0A No Yes Yes Yes Yes
Temperature above 65 No Yes Yes Yes Yes
Additional features
Aside from the features required by Inversa in the problem statement, some additional non
essential features were implemented. As mentioned in the research section, a major part of the
research required for the software section of the project included taking a look at similar
software used in the industry and some of the features included in these software packages. To
make the software package easier to use, a help function was implemented. This allows the
8. user to simply select help in the main menu bar and it will create a help pop up which in detail
explains every function of the program. The text file used for this help function is included in
the Application Manifest and can be easily modified for future changes.
Figure x.x – This image shows the pop up displaying useful help information
Another bonus feature includes the user being able to select graph grid colors in the settings
tab. This feature was implemented in case the user is color blind and perhaps certain colors will
contrast better for different people in environments with different ambient lighting. Since one
of Inversa’s must have features included everything to be easily visible in any environment, this
simple yet effective feature seemed like a worth wile addition to the software package.
9. Future recommendations
There are a number of ways in which this software could easily be improved, and which would
have been implemented if the team had not been under the imposed time constraints. Firstly,
one can easily improve the overall structure of the core by proper indenting and commenting,
which has been done for the most part. In addition to that, better variable and constant
definitions may also clean up some of the code.
As far as improvements to the actual functionality go, a developed could find a way to
implement a way to automatically connect to the microcontroller without having to select the
proper communication port manually. Also if it were possible to find a solution to the issues
that were discovered while closing the connection when data is being received simultaneously,
then this could greatly improve the stability and performance of the software.