Big Data Transformation Powered By Apache Spark.pptx
Everything CAN be a Data Scientist
1. 1
Paper SAS2746-2016
Everyone CAN be a Data Scientist: Using SAS®
Studio to Create a Custom
Task for SAS®
In-Memory Statistics
Stephen Ludlow, Marlow, UK, SAS Institute Inc.
ABSTRACT
SAS®
In-Memory Statistics uses a powerful interactive programming interface for analytics, aimed
squarely at the data scientist. We show how the custom tasks that you can create in SAS® Studio (a web-
based programming interface) can make everyone a data scientist! We explain the Common Task Model
of SAS Studio, and we build a simple task that carries out the basic functionality of the IMSTAT
procedure. This task can then be shared amongst all users, empowering everyone on their journey to
becoming a data scientist. During the presentation, it will become clear that not only can shareable tasks
be created but the developer does not have to understand coding in Java, JavaScript, or ActionScript. We
also use the task we created in the Visual Programming perspective in SAS Studio.
INTRODUCTION
Data scientists come from all fields and look to gain insight from the data they are presented with. It is
widely acknowledged that "there aren't enough data scientists, not even close" (Alex Pentland, 2013).
Some people are good statisticians but do not have the time to learn to code in multiple languages. Other
people are great programmers but have only an elementary knowledge of statistics or data mining.
Wouldn't it be great if we could empower more people to become data scientists?
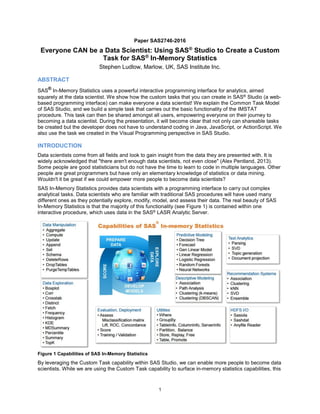
SAS In-Memory Statistics provides data scientists with a programming interface to carry out complex
analytical tasks. Data scientists who are familiar with traditional SAS procedures will have used many
different ones as they potentially explore, modify, model, and assess their data. The real beauty of SAS
In-Memory Statistics is that the majority of this functionality (see Figure 1) is contained within one
interactive procedure, which uses data in the SAS® LASR Analytic Server.
Figure 1 Capabilities of SAS In-Memory Statistics
By leveraging the Custom Task capability within SAS Studio, we can enable more people to become data
scientists. While we are using the Custom Task capability to surface in-memory statistics capabilities, this
2. 2
functionality could provide an interface to data input screens, forecasting engines, and report builders. In
fact, you can create anything that can generate SAS code. An excellent introduction can be found in the
Corcoran and Peters (2015) paper presented at SAS Global Forum 2015. For those people who have
been around the SAS world for a reasonable time, SAS Studio custom task capabilities provide some of
the functionality of SAS/AF and SAS/FSP but in a web-based interface.
This paper takes you beyond building a simple task and demonstrates building a task for the purpose of
making some SAS In-Memory Statistics functionality available to everyone.
A CUSTOM TASK FOR SAS IN-MEMORY STATISTICS
SAS Studio is an HTML5 web-based front end that is the primary interface to SAS In-Memory Statistics.
However, any client, such as SAS Enterprise Guide or SAS Display Manager, could be used if the
purpose was to submit code written for SAS In-Memory Statistics. SAS Studio provides a number of pre-
built tasks, which expands with each release. In SAS Studio, end users have the ability to create their
own tasks without having to understand JavaScript, ActionScript, or Java.
In addition to the Corcoran and Peters (2015) paper, custom task documentation can be found at
support.sas.com/documentation/onlinedoc/sasstudio/index.html. This includes SAS Studio: Developer’s
Guide to Writing Custom Tasks, SAS Studio: Task Reference and SAS Studio: Writing Your First Custom
Task.
SAS Studio tasks conform to the Common Task Model (CTM). The CTM is an XML definition that defines
how a task will be rendered in the SAS Studio interface. Tasks can range from the very simple with little
input from the end user to the more complex, where actions taken by end users will require further actions
to be undertaken before code is created and can be submitted.
Tasks have a number of compulsory elements plus additional elements that might be required depending
on the complexity of the task. In the Metadata section of a task, we enter information about the task itself,
the data sources it uses and the Options that we want to display. Nothing, however, is displayed until you
choose where you want results to appear in the User Interface (UI) section. To gain more control over the
task, we use Dependencies and Requirements. The required elements are very clearly explained in the
Corcoran and Peters (2015) paper.
Armed with the information about what is required to build a custom task and some tips, we will build a
custom task. This task allows you to complete the task without having to learn how to code in SAS In-
Memory Statistics. This expands the usage of the product far beyond people who are programmers. The
bonus is that as you use the task, you will see the code being produced, which is a great way of learning
SAS code. The code can be commented so that explanations of what is being generated are presented to
an end user. Our task will be built for a specific purpose—providing an interface for calculating price
elasticities for demand on alcohol consumption. This task is generic enough that when a new task is
given, you can use it for that as well. Tasks can also be shared, surfaced to other colleagues to use, or be
easily enhanced.
THE TASK AHEAD
In the United Kingdom, people can buy beer from public houses (known as pubs). Buying beer in pubs is
known as on-trade purchasing. Buying beer from shops, supermarkets, or off license is known as off-
trade purchasing. Suppose that you have been presented with monthly data, already loaded in a LASR
Analytic Server for about 1000 people (male and female) over 3 years. The SAS LASR Analytic Server is
extremely quick, so there is no requirement to sample the data.
The data has regional information, including number of hours worked, quantity of beer consumed in the
public houses, price of beer, and price of alternative products (both in the public house and elsewhere).
Some information about segments (Experian® Mosaic codes and types -
http://www.experian.co.uk/marketing-services/products/mosaic-uk.html) is also present within the data.
The task for you, our budding data scientist, is to calculate the price elasticity of demand for beer
consumption in public houses. This information would have a multitude of uses, from getting a better
understanding of the impact of a price rise to being able to quantify how much of a price rise would be
3. 3
needed to reduce consumption by 5%. Implications of price changes in the off-trade market will also have
impacts on consumption in the public houses.
A data scientist will need to choose the correct data, gain an understanding of that data, produce models,
and generate a report with associated commentary. As a final step, they need to email the report to the
requestor of the research.
From basic Economics classes, if you take the logs of both sides of the equation, then the parameters
can be interpreted as elasticities (http://support.sas.com/rnd/app/examples/ets/simpelast/). The quantity
of beer consumed is obviously the dependent variable. The data as prepared, however, does not contain
log values, so some transformations will need to be carried out.
A data scientist typically takes this approach: choose the data, explore that data, modify the data if
required, model, assess, and report the results. Our SAS In-Memory Statistics custom task contains this
functionality – see Figure 2.
Figure 2 Functionality in the SAS In-Memory Statistics Custom Task
The elements numbered 1 to 5 are essential steps. The data scientist must choose some data (Step 1).
Once the data is chosen, you could investigate that data, produce statistics, modify it, or move straight to
modeling it (Step 2). Without developing a model (Step 3) there is nothing to report on (Step 4), so the
custom task will need to take into account that the end user will not be able to do anything on the
reporting section until Step 3 has been undertaken. The final step (Step 5) enhances the analyses. The
completed custom task with the functionality required is shown in Figure 3.
A demonstration of the SAS In-Memory Statistics custom task can be found at
https://www.youtube.com/watch?v=T1bqFZY3Djc.
4. 4
Figure 3 SAS In-Memory Statistics Custom Task
Note that the Task preferences, which are reached by clicking More application options just to the left of
the Help icon , have been set as shown in Figure 4. To tidy-up the code window, we have deselected
Generate header comments for task code, but we have left Show task code and Show task log
selected.
Figure 4 Task Preferences
ONE STEP AT A TIME
As a data scientist, you need to be able to choose a data set that is loaded in the LASR Analytic Server
and identified by a LASR libref. To ensure that you choose data that is assigned to the LASR libref, we
built into the task the ability to notify them if they have chosen incorrectly.
In this task, we will do this in two ways. First, find what libref has been chosen using the getLibrary()
function and displaying a text string (LASRRET) explaining the need to choose a LASR table. Second,
make it a requirement that a LASR libref is chosen or NO code will be submitted.
In the Dependencies section, adding the following code will show a text string called LASRRET in the
custom task if the return value is not equivalent to LASR:
5. 5
<Dependency condition="($DATASOURCE.getLibrary() =='LASR')">
<Target action="show" conditionResult="false" option="LASRRET"/>
<Target action="hide" conditionResult="true" option="LASRRET"/>
</Dependency>
In Figure 5, the string LASRRET appears just above the choice of table. Choosing any table from the
LASR library will hide it. Note that a message also appears in the code window informing the user that the
following requirements have not been met if a LASR libref is not selected. This was achieved by adding
into the <Requirements> section:
<Requirement condition="($DATASOURCE.getLibrary() =='LASR')">
<Message>You must choose a LASR Table for your analysis. </Message>
</Requirement>
It’s at this point that some further explanation can also be provided to the end user. You can add either
additional text or additional, identical requirement conditions. The downside of adding additional text to a
single requirement is that the text string becomes very long and does not flow within the code window.
The user would have to scroll to the right to see all the information. The 5 lines of requirements in Figure
5 are achieved by 5 identical requirements statements, each with different message statements.
Figure 5 When a non-LASR Table Is Chosen
Why both ways you might ask? If the custom task is executed in a situation where a code window is not
shown, for instance when we use the Test Task Report link ( ), then no code window displays (Figure
6). The little SAS running man is grayed out and without the LASRRET string being shown, an end user
would not know why.
6. 6
Figure 6 Task with No Code Window
After a correct LASR table has been chosen, a typical task would be to gain an understanding of the table
itself. We provide the ability to carry out these tasks by using check boxes. Each check box typically
generates a single line of SAS In-Memory Statistics code. The TableInfo statement provides us with
information about the number of rows and the number of columns. Selecting ColumnInfo generates a
statement that provides a feel for the data in terms of character or numeric type, whether the data is
properly labeled, and what the fields are. While the TableInfo statement gives the number of rows, the
NumRows statement is useful for when a WHERE clause has been applied.
Figure 7 Using the Task as a Learning Tool
As you can see from Figure 7, we can provide the task as a learning tool as well. With the
Help/Comments check box selected, explanations of the code being generated are provided. Over time,
the comments might become obtrusive to the end user, so by simply deslecting the Help/Comments
check box the Help/Comments are turned off.
7. 7
The Help / Comments check box is defined in the Options section of the Metadata with the following
code:
<Option defaultValue="1" inputType="checkbox" name="HELPCM">Help / Comments</Option>
Within the CDATA section simply add help code for each section that requires it. The sample below is for
the NUMROWS statement. Hence, when the NUMROWS check box and the HELP / Comments check
box are selected, then the comment will be displayed:
#if ($NUMROWS == '1' && $HELPCM == '1')
************************************************************
* The NUMROWS statement identifies how many rows satisfy a *
* selection criterion. The selection observes the WHERE clause *
* and records marked for deletion or purging. *
****************************************************************
; #end
After we have an understanding of the fields, typically we would want to view the data. By choosing the
Print check box, a fetch statement is generated:
fetch / from=1 and to=5 format;
A slider appears so that you can visualize more than the default 5 records, if required. As we saw earlier,
the ability to hide (or show) items is provided by Dependencies. Looking at this data, our next step might
be to rank the data to get a feel for highs and lows. Expanding the Rank group allows us to either select
the Top and Bottom 5 values for all Variables generating the following statement:
simple topk / k1=5 k2=5;
Alternatively, we could hone in one particular variable. In building this type of interface, the designer has
to have in mind how the end user would interact with it. Simple additions could be made where the user
makes a decision about how many top or bottom values he requires. In our scenario, the end user wants
to know the top and bottom price paid for beer in pubs, so by choosing the variable price_on_trade_beer,
we generate the TOPK statement:
topk price_on_trade_beer / k1=10 k2=10;
We can see in Figure 8 that somebody was paying £4.53 for a pint and someone else claimed to be
paying £0.35. Further investigation of where they are paying £0.35 for a pint would need to be carried out!
Figure 8 TopK Statement on Price of On-Trade Beer
NEXT STEPS
Typically, an analyst with an understanding of the fields in the data would start to produce one-way
frequencies and cross tabulations to explore the data. Using the explore grouping on the DATA tab allows
us to request distinct values for all the variables and save them in a temporary table. This is done in one
line of SAS In-Memory Statistics code:
distinct _all_ / save=alc1;
We then provide for the end user the ability, via a number stepper, to choose how many distinct values of
a variable are required before writing the variable names into a macro variable called list1:
store alc1(where="NDistinct le 12", 1)=list1;
8. 8
A simple frequency statement using list1 then generates multiple frequency tables:
frequency &list1;
Once a Data Scientist has an understanding of the data, they are likely to want to move on to look at it
from a statistical perspective. Before we do so the next step in our Custom Task is to add in Reset
functionality. On the bottom of Figure 3 you will notice a check box has been created that allows the end
user to reset (clear) the check boxes. Without this functionality, the end user, when he moves to another
tab, would need to deselect each item or the code will be resubmitted. There are times when the end user
will want all the code, as they can save what they have chosen in this mode. The reset functionality works
by using the set capabilities of an action. When the user selects the Reset check box, then all the other
check boxes on this tab are set to 0 by using the code below:
<Dependency condition="$RESET == '1'">
<Target action="set" conditionResult="true" option="TABLEINFO" property="value" value="0"/>
<Target action="set" conditionResult="true" option="COLUMNINFO" property="value" value="0"/>
<Target action="set" conditionResult="true" option="PARTINFO" property="value" value="0"/>
…
<Target action="set" conditionResult="true" option="RESET" property="value" value="0"/>
</Dependency>
The interesting action, though, is the last set action. It needs to be last in this dependency condition, as
we’ve built it so that the RESET check box is also set to 0. Hence, it clears whenever you select it.
Alternatively, the user interface might be a radio button, but the code above works well for this purpose.
STATISTICAL UNDERSTANDING
Moving onto the STATISTICS tab gives the you, as the data scientist, the ability to look deeper into the
data. In Figure 9 you can see the end user has already selected 3 items from the SIMPLE group, which
produce the following code within PROC IMSTAT:
summary;
percentile;
histogram quantity_beer_on_trade /save=hist;
ods output histogram=work.hist;
9. 9
Figure 9 STATISTICS Tab with Expanded DESCRIPTIVE and MULTI DIMENSIONAL Groups
The SUMMARY statement calculates Min, Max, N, Sum, Mean, Std Dev, Std Error, Coefficient of
Variation, and the Number Missing for all variables. The PERCENTILE statement provides percentiles
and quantiles for every numeric field. Selecting the histogram check box in the custom task does two
things:
1. Allows the end user to choose a variable for the histogram (using a ROLEITEM). The selected field
(quantity_beer_on_trade) is the quantity of beer consumed in public houses.
2. Saves the values from the HISTOGRAM statement to a temporary table called hist. We then use an
ODS output statement to create a work table also called hist.
We are creating a table as the HISTOGRAM statement within PROC IMSTAT creates no graphical
output. So by selecting the Histogram check box and corresponding field, the end user creates a
histogram table and then runs SGPLOT code on that table. See Figure 10.
Figure 10 SGPLOT Output
10. 10
Looking at this, you might well infer that we have a number of groups present in the data. One of our
variables is gender, so let’s use a WHERE clause to subset by gender. As this is a typical request the
custom task was built so that the WHERE clause on the DATA tab has this as a default option. The code
for this was taken from one of the supplied tasks and then enhanced for the SAS In-Memory Statistics
task. In this case, the enhancement was to add a default value and explanatory text around it.
Note that in SAS Studio 3.4, there was a limit to one DataSource statement. This limit has been removed
with SAS Studio 3.5. There appears no limit on RoleItem statements and they are used liberally
throughout the custom task, as you need to select variables for dependent, independent, group, and
modification purposes. On the RoleItem statement, you can specify type of variable, maximum, and
minimum variables. You can also specify variables to exclude, which is particularly useful once you have
chosen a dependent variable. The dependent variable can then be excluded from choices for
independent variable.
The descriptive group gives you, as the data scientist, the ability to start seeing the relationship between
variables. Checking the Correlation check box inserts the following simple one-line statement:
corr;
This will calculate a correlation matrix based on all numeric fields within the data. In Figure 11 a portion of
the correlation matrix is displayed, and you can see that there appears to be a negative relationship
between the price_on_trade_beer and the quantity_beer_on_trade. This -0.1191 correlation is across
both males and females. Using the WHERE clause capability that is built into the task gives very different
results by gender. You likely want to model by gender to see if the calculated elasticities differ by gender.
Figure 11 Partial Correlation Matrix Output
MODIFY
With SAS In-Memory Statistics you can create computed fields in memory. In our scenario, the Alcohol
consumption data had not been transformed in any way. You want to calculate elasticities using a log-log
model, and you have the ability to convert any fields that you select. The price of beer in public houses
(price_on_trade_beer), price of spirits (price_of_spirits), price of wine (price_of_wine), total household
income (total_household_income), hours in employment (hours_in_employment) and the quantity of beer
purchased in public houses (quantity_beer_on_trade) are all selected. The generated COMPUTE
statements can be seen in Figure 12. Once added to LASR memory, these variables can’t be overwritten,
and hence functionality to drop variables has been provided.
11. 11
Figure 12 Modification of Existing Data
MODEL
As a data scientist, you understand your task, but you still need to decide on the type of model to
produce. To help you, choose either a GLM - Multiple Linear Regression Model or a Generalized Linear
Model. With the Generalized Linear Model you can also choose the LINK function and specify the
distribution of the response variable. In Figure 13, we give the you the ability to quickly view the data
(including modifications) using the Variable Summary inputType, which appears in the Rapid Predictive
Modeler task (not in the documentation). The XML defining the input type goes in the Options section of
the Metadata and is then used with an OptionItem statement in the UI section:
<Option inputType="variablesummary" name="variableSummary"/>
<OptionItem option="variableSummary"/>
Figure 13 Initial Model Screen
Other model types could be utilized as SAS In-Memory Statistics has this functionality (Figure 1). Once
you pick the model type that you are interested in using, the roles appear. The screen was built so that
the roles are displayed above the Model Type. By choosing one model type, you hide the other.
Deselecting the box brings both model types back, so the other can be chosen for model comparison if
required. Additional model types to deal with binary type data, such as Logistic regression, could easily
12. 12
be added. The trade-off is between making the custom task meet the requirements and over-complicating
the interface by providing unnecessary functionality.
The Role section as defined requires a dependent variable and at least one independent variable to be
chosen. We don’t restrict how many variables can be selected. You can also group by chosen variables.
We can see from the distribution of beer consumption in Figure 10, that we are likely to have a number of
groups.
Notice that in this custom task we have used multiple role items. You are not restricted in building your
custom task to choosing variables for one role and having to use them throughout the custom task. You
are however, restricted to only using one DataSource statement at a time in SAS Studio 3.4. To guide
you, we provide Help / Comments where appropriate on the other tabs.
Variable selection could have been carried out by modifying the custom task so that a VARSELECTION
option is added to the GLM or GENMODEL statement – but we didn’t want to do all the work for the data
scientist!
Figure 14 Chosen Model
Suppose the data scientist has chosen a GLM with the log_quantity_beer_on_trade created in the Modify
step as the dependent variable, all the other log variables, and three seasonal variable values. The Fit
Statistics check box is selected by default. In our custom task, the only additional information that is
enabled when the end user selects a Generalized Linear Model is the ability to select a distribution and
LINK function. With our Alcohol data, there is no requirement to select a distribution of the response
variable other than NORMAL if we group by gender. If the end user selects the Generalized Linear Model
type, then the Help/Comments functionality provides information about the DIST and LINK elements. If
we leave the LINK function blank, then the server will select the most appropriate function for the
distribution of the data.
Should you, as the data scientist, decide to switch model types, all the choices made will be kept.
Running the code in leads to the partial output shown in Figure 15.
13. 13
Figure 15 Results of the GENMOD Statement for Both Male and Female Groups
The most interesting result shown in Figure 15 is that the price elasticity of beer in public houses
(log_price_on_trade_beer) differs from -0.47 for males to 0.40 for females. This suggests that increasing
the price of beer by 1% in public houses cause a -0.47% fall in consumption for males and a 0.40%
increase in consumption for females. Further investigation would be required, but suspicions are raised
that as the price rises, males request females buy further rounds!
SAS In-Memory Statistics also has the ability to assess one or more models. For regression models the
ASSESS statement returns the summary statistics of the response variable for each bin of the predictions
after a quantile binning of the predictions. In the SAS In-Memory Statistics custom task we allow the end
user to select this and to choose the number of bins for lift calculations as shown in Figure 16. The output
from the ASSESS statement is written to an ODS defined temporary table, which we then use in an
SGPLOT procedure.
14. 14
Figure 16 Assessment Selected and SGPLOT Code Created
The output from the chosen options in Figure 16 are displayed in Figure 17. The models chosen seem to
be very good fits.
Figure 17 SGPLOT of Predicted and Response Mean from the GLM Model
15. 15
REPORTING
Your final task as a data scientist is to produce a report and email it out. We want to ensure that the
report cannot be sent until modeling has been carried out. When an end user selects the Reporting Tab,
before modeling has been undertaken, they will see the result shown in Figure 18. That is, a string is
displayed stating that reporting is not available until modeling has been completed.
Figure 18 Reporting Tab Before Modeling Is Completed
This was slightly trickier to achieve as there is nothing on that Tab checked at that point and we will want
to uncheck the model so that the reporting can be created without the model having to be re-run. It does
show that an action taken on one tab can impact other tabs.
We achieved this by creating a couple of items in the Options section of the Metadata, which are set to 0
by default and are not surfaced anywhere. As below for GLM and repeated (but not shown) for the
Generalized Linear Model.
<Option defaultValue="0" name="HIDE_GLM" inputType="checkbox">HIDDEN NOT SURFACED
ANYWHERE</Option>
Then in the Dependencies section you will find the following code:
<!-- On Initialization HIDE_GLM is set to O, so GLMR will be hidden -->
<Dependency condition="$HIDE_GLM == '0'">
<Target action="hide" conditionResult="true" option="GLMR"/>
</Dependency>
<!-- Once GLM is selected then $HIDE_GLM becomes 1, so GLMR will be unhidden and remains
unhidden as $HIDE_GLM is always 1 -->
<Dependency condition="$HIDE_GLM == '1'">
<Target action="show" conditionResult="true" option="GLMR"/>
</Dependency>
16. 16
Figure 19 Reporting Tab After Modeling Is Completed
Depending on which models have been run on the modeling tab, you will now be presented with the
choice of either Multiple Linear Regression Model results or Generalized Linear Model results and we
give the end user the opportunity to enter titles, analysis and commentary on particular variables. The
final task you were given was to email the results. We could simply create a drop-down list of possible
emails but we want to give you the opportunity to email results to anyone with a properly defined email
address. To achieve this, we put in the Options section of the Metadata an inputType of validationtext and
a regular expression (regExp) that specifies the regular expression pattern to use for validation. (The
syntax for regExp comes directly from JavaScript Regular Expressions). We then use the CEMAIL item in
the UI section.
<Option name="CEMAIL" inputType="validationtext" promptMsg="Enter your email address"
invalidMsg="Not an email address!" regExp="[a-zA-Z0-9._%+-]+@[a-zA-Z0-9.-]+.[a-zA-Z]{2,}">email
address</Option>
DISTRIBUTION
Once the custom task has been completed, you will want other people to benefit from it. It can of course
be emailed to other users, stored on a shared drive or used, for example, within a process flow see
Figure 20.
Figure 20 IMSTAT Custom Task Being Used in a SAS Studio Process Flow
17. 17
If you save the Custom Task with an item pre-defined, such as the chosen table, then it is saved as a
CTK file. Executing this allows you to run the Test Task Report by selecting the second icon from the right
. (This functionality is experimental in SAS Studio 3.4 and 3.5). This surfaces
the report without a code or log window (see Figure 21). At this time, the interface cannot be used to
surface a message to an end user. Hence, the use of the LASSRET string as mentioned in section One
Step at a Time.
Figure 21 Custom Task Surfaced Using the Test Task Report
Alternatively, you can distribute the results using a mechanism such as a GitHub repository. The
IMSTAT.CTM file is stored within an open GitHub repository at http://suksel.github.io/data/IMSTAT.CTM.
The reader is welcome to take a copy and review all of the code discussed in this paper.
In SAS Studio 3.5, custom repositories can be used (see Figure 22). This allows us to control
dissemination of the SAS In-Memory Statistics task to multiple Data Scientists. Every time a user starts
SAS Studio, that user will have access to the latest version of the task.
18. 18
Figure 22 GitHub Repository Being Used in SAS Studio 3.5
More information about SAS Studio repositories will be presented in the SAS Global Forum 2016 Swapnil
Ghan paper “Developing SAS Studio Repositories.”
Figure 23 Using the IMSTAT Custom Task from a GitHub Repository
THE CUSTOM TASK JOURNEY
There are things to be aware of in building any custom task though and a few tips that will help:
1. Make sure that capitalization is correct. Datasource is not the same as DataSource. Only DataSource
will work. InputTypes apart from String all need to be lowercase.
2. Match tags as you enter them. That way you won’t find you have forgotten to end a group or
container. Using Snippets with pre-built functionality is a good approach as in Figure 24.
19. 19
Figure 24 Snippets for Use in Custom Task Creation
3. Layout is decided by the UI engine and while you can indent certain items, we found you can use an
inputType of String to create a SPACE in the UI. Each space string will need a different name as you
can only use them once.
<Option name="SPACE" inputType="string"> </Option>
4. A great learning tool is to save a task to My Tasks, and then edit it to see how it was created. Cut and
paste comes in handy then. We wanted to add WHERE clause functionality, which was achieved by
copying from an existing task and enhanced by adding labels and providing a default value.
5. Learning Apache Velocity Code for basic tasks is not required. Follow step 4 above and learn by
example. Be aware that ‘==’ is equivalence, AND is ‘&&’, OR is ‘||’, and NOT is ‘!’. Velocity variables
are defined with a ‘$’ on the front of them. Don’t forget the ‘$’.
6. Hiding a group hides all elements within a group.
7. Keep a record of names you have used for your items. As your task gets bigger you don’t want to
have a name clash. We kept a glossary of names in a spreadsheet, with information about where
they were used and their type and purpose.
8. When you make changes, such as when entering an Option, place an OptionItem element in the UI
section and create some SAS code for the CDATA section. Then run and save before moving on to
ensure that the XML is well defined.
9. The order of dependencies is important.
10. You can create variables that have no presence on the UI screen. In the CDATA section, using the
following code allowed me to use the $UNDERSCORE variable to add a ‘_’ between variables:
#set( $UNDERSCORE ='_')
I could then use the variable later in the code:
compute $comboMOD$UNDERSCORE$item
"$comboMOD$UNDERSCORE$item=$comboMOD($item);";
11. For consistency in the look and feel of the task, use uppercase for containers (Tabs) and groups.
Don’t mix and match cases.
20. 20
CONCLUSION
The Custom Task capability within SAS Studio is a superb means of providing the advanced capabilities
of SAS In-Memory Statistics to a much wider audience. Tasks can be easily developed for a particular
purpose, whether that is functional or educational.
Initially, we looked at building a task to provide a solution for a particular problem. However, as we
developed the task we realized that it could be used for so many things. Now, whenever we receive data
we want to analyze, we quickly load it into the SAS LASR Analytic Server and then use our custom task
on it. The early phases of a typical analytical lifecycle can be achieved very quickly and concisely when
compared with the approach taken by traditional SAS products.
REFERENCES
Corcoran, Christie, and Peters, Amy. (2015). “Teach Them to Fish—How to Use Tasks in SAS Studio to
Enable Co-Workers to Run Your Reports Themselves.” Proceedings of the SAS Global 2015 Conference,
Dallas, TX. Available at http://support.sas.com/resources/papers/proceedings15/SAS1831-2015.pdf.
Ghan, Swapnil. (2016). “Developing SAS Studio Repositories.” Proceedings of the SAS Global 2016
Conference, Las Vegas, AZ. Available at
http://support.sas.com/resources/papers/proceedings16/SAS6140-2016.pdf.
Pentland, Alex. “Not enough data scientists, MIT expert tells Computing.” Computing. 04Sep2013.
Available at http://www.computing.co.uk/ctg/news/2292485/not-enough-data-scientists-mit-expert-tells-
computing
ACKNOWLEDGMENTS
Thanks to Amy Peters, Meredyth Bass and Chrisopher Battiston for their useful comments and
proofreading. Thanks to Darren Rhodes for help with the look and feel of Figure 2. All errors are my own.
RECOMMENDED READING
SAS Studio 3.4: Writing Your First Custom Task
SAS Studio 3.4: Administrator’s Guide, Second Edition
SAS Studio 3.4: Developer’s Guide to Writing Custom Tasks
SAS LASR Analytic Server 2.7: Reference Guide
CONTACT INFORMATION
Your comments and questions are valued and encouraged. Contact the author at:
Stephen Ludlow
SAS UK
Wittington House
Henley Road
Marlow
SL7 2EB
United Kingdom
Stephen.Ludlow@sas.com
http://www.sas.com
SAS and all other SAS Institute Inc. product or service names are registered trademarks or trademarks of
SAS Institute Inc. in the USA and other countries. ® indicates USA registration.
Other brand and product names are trademarks of their respective companies.