1. Stephen Leslie (15204627) Carbon Footprint assessment
Carbon Footprint Assignment
Introduction
I am a student in UCD who lives 51Km away from college in the countryside. Due to the long distance
and lack of local public transport I have to drive to college every day. I give my friend a lift in most
days and he travels 40Km with me there and back which means that he is responsible for around
40% of my college commuting emissions.
In September, I visited my aunt and uncle in England. I flew to Leeds Bradford Airport and returned
to Dublin airport. In May, I flew to Biarritz in France for a summer holiday, I will only include the
England flight in my carbon footprint as the time period for this assessment will be from the start of
Term (1st
of September 2015) to when this assignment is due (16th
of October 2015).
I am a meat eater, so for lunch I would have chicken or a beef sandwich, a Muller fruit corner, an
apple (from France) and a twix bar. My breakfast usually consists of two bowls of cornflakes and a
cup of coffee. Dinner is my main meal of the day and it tends to vary, meals would include Donegal
catch (Cod), baked potatoes and broccoli, chilli con Carni (minced beef) with rice, lasagne (minced
beef), chicken and rice, pork chops with a baked potato and carrots. I am unable to remember all of
the different dinners that I eat but I think that these are a good representation of them all.
Goal
The goal of this report is to calculate my personal carbon footprint. As I am intending to enter a
career in sustainable energy and CO2 emission reductions, it is important that I learn how to
calculate the impacts that I am associated with and report them in a concise manner. This will help
me for future projects involving more complex calculations and data sourcing. The target audience
for this report is the person assessing my work (Nick Holden) and myself. I am hoping that this report
will shine light on areas of my life that are carbon intensive so that I might be able to make changes
to reduce my carbon footprint.
Scope
In theory, my carbon footprint started when I was 0 years old and has accumulated over the last 23
years. For me, to be able to calculate all of that would be impossible which is why I am using the first
7 weeks of college as my time frame for this study. The system boundaries include car transport,
flights, electricity use, food consumption and things that I buy. The primary unit will be the metric
tonne of carbon per year. The limitations of this study include the fact that I do not document all of
my actions and the things that I buy which means that things will get left out. Fuel consumption in
my car varies with outside temperature, traffic, speed and weight in the car. In this report I will
compare my personal calculations with the calculations provided by carbonfootprint.com to show
how accurate they are.
1. Data inputs
Electricity Consumption
Electricity in my house is sourced from SSE Airtricity which according to their website sources 60% of
their energy from renewable energy (Sseairtricity,com, 2015). The readings being used were taken
from 24/08/2015 to 23/09/2015. The total day and night KWh between this period was 1029 KWH.
Car Transport
2. Stephen Leslie (15204627) Carbon Footprint assessment
For the calculator, I entered the following, travelled 102Km to and from college 5 days a week for 7
weeks in a 2011 Skoda Fabia Hatchback 1.2CR TDI 75PS Greenline 11 MS. The calculator assumed
that the car emitted 89 g/km. In my calculation, I based the figures on the average fuel consumption
which I usually get (75mpg). I am assuming that I am only 60% responsible for these emissions as I
give my friend a lift in every day (he travels 80km of the total 102km of my journey). The data for the
online calculator comes from Ecoinvent, the Skoda website stated that its emissions were ‘’as low as
88g/km (Hamilton, 2011).
Flights
During the start of Term I went to England to visit family for a weekend. I did a return trip from
Dublin to Leeds Bradford Airport in two fully booked airplanes in Economy Class.
Food
In the calculator I imputed the following, I eat a mix of white and Red Meat, I never buy or eat
organic food, I try to buy in season food and I try to buy food produced close to home. The food,
recreation, recycling, fashion, car manufacture and finance were all put under the heading
‘’Secondary activities’’. In my calculation, I will assume that I eat 300g of corn flakes and consume
1litre of milk every 3 days for breakfast, a loaf of bread, 200g of chicken and 200g of beef every 6
days, an apple, a twix bar and a yogurt every day for lunch. For dinner I will assume Monday is
Donegal Catch (225g) with broccoli and baked potato, Tuesday I eat Chilli con Carne (125g serving of
minced beef) with rice, Wednesday I eat Lasagne (125g of minced beef), Thursday I eat Chicken
(200g) with rice, Friday I eat pork chops (200g) with carrots and baked potato, Saturday I eat mashed
potato , sausage (100g) and baked beans and Sunday I would eat roast beef (150g), roasted
potatoes, carrots and cauliflower. To make calculations easier, emissions will only include those from
the farm and will exclude processing and transportation. The carbon emissions associated with
cooking the food will be covered in the electricity consumption aspect of the report. On an average
week I would consume 2 litres of beer from 8 250ml glass bottles.
2. Results
Electricity
Data readings taken were only for one month, in order to convert this to the 7 weeks, I divided the
1029KWh by 31 and then multiplied it by 49 to get 1626 Kwh. Carbonfootprint.com have calculated
that I have emitted 0.25metric tonnes of CO2 from my electricity consumption in the home.
My calculations were as follows
CO2 emissions form Airtricity Electricity 2014 average= .253t/mwh (Sseairtricity,com, 2015)
.253t/mwh = .000253t/kwh
.000253t/kwh*(1626kwh)/3 people living in the house= 0.137metric tonnes
Car Transport
Carbonfootprint.com calculated my emissions in the following way:
3. Stephen Leslie (15204627) Carbon Footprint assessment
3570Km*89g/km*(emissions from car manufacture)= .37 metric tonnes. I multiplied the g/km by the
km and was 52 kg short of the stated .37 metric tonnes. I have assumed that the extra 52Kg has
come from the energy required to manufacture the car.
I calculated my emissions in the following way
3570Km*0.621= 2219miles
2219miles/75mpg= 29.6 gallons
29.6 gallons*0.6= 17.7 gallons (my friend takes responsibility for half of 80% of the journey meaning
60% of the burden belongs to me)
17.7 gallons*4.546 ltr= 80.5 litres. (Metric Conversion charts and calculators, 2003)
80.5 ltr*2.64Kg (C02 per litre)= 212Kg (Ecoscore, 2015)
212Kg + 52Kg= 0.264 metric tonnes.
Flights
Carbonfootprint.com stated that my emissions from flying to Leeds Bradford and Back were .05
tonnes of CO2.
Food
0 Food Functional
Unit
unit
Value
C02
eq/Kg
Days g (CO2) Reference
breakfast
cornflakes Grams 300 0.95 49 13965 (anon, 2012)
milk Litre 333 1 49 16317 (Teagasc.ie, 2010)
Coffee (instant coffee) Grams 5 4.98 49 1220.1 (Carbon Footprint Across
the Coffee Supply Chain:
The Case of Costa Rican
Coffee, 2012)
0
Lunch 0
Kingsmill (1 every 6
days) tasty whole meal
Loaf 1000 0.95 7 6650 (Kingsmillbread.com,
2015)
Chicken tikka Grams 200 3.3 7 4620 (Teagasc.ie, 2010)
Beef Grams 200 19 7 26600 (Teagasc.ie, 2010)
apple Apple 0.1 1 49 4.9
twix (mini) twix bar 50 2 49 4900
0
Day Dinner 0
Mon Donegal Catch (Cod) Grams 225 1 7 1575 (Smarason, 2014)
Broccoli Grams 100 2 7 1400 (Green Eatz, 2015)
Baked potato Grams 200 2.9 7 4060 (Green Eatz, 2015)
0
Tues Chilli (minced beef) Grams 125 19 7 16625 (Teagasc.ie, 2010)
rice Grams 100 2.7 7 1890 (Green Eatz, 2015)
0
5. Stephen Leslie (15204627) Carbon Footprint assessment
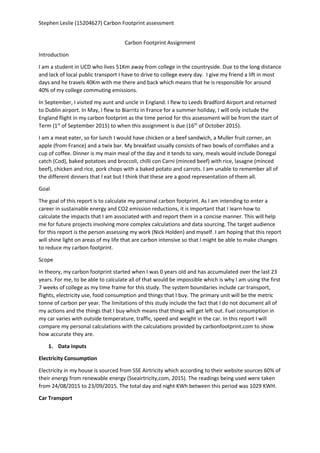
Figure 2 CO2 Emissions Based on Type of Meal
Total Result
Figure 3 Comparison of Emissions based on Calculation Method
As seen in the above graph, the calculations done by carbonfootprint.com were a lot higher
(1.17tonnes) than my personal calculation (0.65 tonnes) over the seven weeks of my study. One of
the biggest differences is the segment marked as secondary activities. Flights have remained the
same in both as I was not able to calculate the flight emissions by myself. House emissions changed a
lot. There was a visible drop in the emissions from the car based on my calculations because I placed
40% of the CO2 on my friend as he was in the car with me. The metric tonnes per year form the
website was 8.7 and my calculations came out as 4.8.
breakfast, 31.5021
lunch, 42.7749
dinner, 92.995
CO2 EMISSIONS BASED ON TYPE OF MEAL
0
0.2
0.4
0.6
0.8
1
1.2
1.4
CarbonFootprint.com My calculation
MetrictonnesofCO2
Comparison of emissions based on calculation
method
house flight car secondary
6. Stephen Leslie (15204627) Carbon Footprint assessment
3. Interpretation
Based on the above graph it is very clear that my car and secondary activities are the biggest
contributors to my carbon footprint in both my calculations and those done through the online
calculator. Reliability of the data is a major factor in terms of accuracy of the result which I got. Kwh
readings which was used for the house were taken a month ago and might not reflect my actual
electricity use as the temperature has gotten colder since then and thus more energy would be
required. Values which I took for the CO2 emissions from my electricity represent the average 2014
values, the emissions from my electricity this year will probably be less due to more sustainable
energy being added to the grid.
The online calculator assumes that you drive the car around everywhere by yourself and does not
take into consideration that you might be carpooling with other people, this is a major flaw in the
calculation process as it does not place any burden on the passenger. As stated in the result section
of this report, the online calculator added an extra 52 kilos to the calculation and it did not state
why. The extra emissions might be due to the fact that a well-to-wheel calculation was done which
included the energy required to pump, process and transport the fuel to the pump.
The biggest difference between the two calculations was the secondary activities section. This is
probably due to the fact that I did not include clothing, furniture or appliances in my calculation. I
did however include by food intake for this period which amounted to over 200kg including the
estimation on how much I waste (20%). While this was the most in depth part of my investigation
the data inputs were not very accurate. The emissions from food is based on the CO2 emissions from
1kg of the food product yet I do not weigh out the portions of meat on a plate before I eat it which is
why I guessed the weight of most of my food intake. While I tried to make my diet as honest and
truthful as possible, I do tend to impulse buy sweets, chocolate, coffee, chewing gum and pints of
beer which I did not include which could have probably lifted my food carbon footprint even higher.
I created the spreadsheet with simplicity in mind which is why I did not include all the recipes for
lasagne and chilli con carne which would again increase my footprint. There was 300Kg difference
between the two secondary calculations which in my opinion should be expected due to the
crudeness and limited nature of my study.
4. Critical review
An LCA and a personal carbon footprint are similar in the sense that both reports follow a similar
style and the outputs from both show a quantitative value from consumption of raw materials,
water, energy and CO2 emissions per functional unit, yet a problem arises when one must find a
functional unit for a human being. If I was a factory worker who never left the factory in my life and
went to work every day, it would make defining my FU a lot easier as you could add up the total
products I made and divide it by the CO2 emissions I was responsible for thus using the product as
my FU. Fortunately I am not in that position and I am free to make my own decisions which is a
defining difference between my carbon footprint and the LCA for a t-shirt for example. I think this is
why the online calculators use time as the result output.
The results provided can be used to help me make changes in my life to reduce my carbon footprint.
The graph of all my meals shows that beef is a major contributor in both lunch and dinner. For lunch
I could eat only chicken sandwiches and I could have a day where I don’t eat meat in the week (meat
free Monday). I was very surprised to learn that Cod has only 1kgC02eq/kg of emissions (Smarason,
2014), I could probably eat more fish.
7. Stephen Leslie (15204627) Carbon Footprint assessment
My car is already very efficient (88g/km) which means that buying a new one wouldn’t make a huge
amount of difference. Parking in Maynooth and getting the bus in and out every day would add
huge financial costs to my commute along with added commuting time. I could add more people
into the car when I’m going to college buy picking people up in Maynooth or celbridge but this will
only lead to those people having a larger carbon footprint as they are probably currently taking
public transport. My best option would probably be to stay at home one day during the week and
telecommute. This would reduce emissions, financial cost and give me an extra two hours of working
time which I am losing due to commuting every day.
Flight emissions from visiting relatives can’t be avoided, however I could probably spend twice as
long with them in their country and visit them half as much during the year which would reduce the
quality time/emission ratio.
House emissions all come from the electricity used, this could be reduced by finding things in the
house which use a lot of electricity and replace them with more efficient things, putting a wind
turbine beside the house and getting electricity from it.
I have mixed opinions on how meaningful the personal carbon footprint is in combating climate
change. As stated in the goal, I intend to enter a low carbon focused career path which means that
these types of calculations will be important in my career, if you consider this as practice then I
believe that this exercise was both useful and meaningful for me, on the other hand, climate change
is a global issue created by seven billion people, How much can really be done by one person?.
Another argument for the carbon footprint is the beef consumption, a cow is a massive animal which
means that if I eat 1kg less of its carcass every week this will not lead to 1 less cow being grown and
could lead to increased food wastage as that beef might enter the bin. The point that I am trying to
get across is that real results which need to be achieved should be focused on the macro scale of the
problem eg. The source of our electricity should come from 100% renewable and energy costs
should be increased to limit household usage and to help finance more renewable energy projects
around the country. If meat is a big emitter of greenhouse gases, then it should be taxed like our
petrol and diesel is.
Bibliography
Anon, (2012). 1st ed. [ebook] Available at:
https://www.tescoplc.com/assets/files/cms/Tesco_Product_Carbon_Footprints_Summary(1).pdf
[Accessed 18 Oct. 2015].
Carbon Footprint Across the Coffee Supply Chain: The Case of Costa Rican Coffee. (2012). 1st ed.
[ebook] Available at:
http://www.balas.org/BALAS_2013_proceedings_data/data/documents/p639212.pdf [Accessed 18
Oct. 2015].
Ecoscore, (2015). Ecoscore.Be. [online] Available at: http://www.ecoscore.be/en/how-calculate-co2-
emission-level-fuel-consumption [Accessed 18 Oct. 2015].
Hamilton, Mark. 'Skoda Fabia Greenline II (2011) Review'. CAR Magazine. N.p., 2011. Web. 18 Oct.
2015.
Kingsmillbread.com, (2015). Kingsmill : Fresh Thinking from Kingsmill : Kingsmill and the Environment
: Kingsmill are committed to reducing our carbon footprint. [online] Available at:
http://www.kingsmillbread.com/fresh-thinking/environment/carbon-footprint/ [Accessed 18 Oct.
2015].
8. Stephen Leslie (15204627) Carbon Footprint assessment
Metric Conversion charts and calculators, (2003). UK Gallons to Liters conversion. [online] Available
at: http://www.metric-conversions.org/volume/uk-gallons-to-liters.htm?val=1 [Accessed 31 Oct.
2003].
Smarason, B. (2014). Life Cycle Assessment of Fresh Icelandic Cod Loins. 1st ed. [ebook] Available at:
http://Birgir Örn Smárason, Jónas R. Viðarsson, Gunnar Þórðarson and Lilja Magnúsdóttir [Accessed
Sep. 2014].
Sseairtricity.com, (2015). About our energy sources. [online] Available at:
https://www.sseairtricity.com/ie/business/about-us/about-our-energy-sources/ [Accessed 18 Oct.
2015].