1. Page 1 of 5
Mirvac FacilityManagement2014/15
Mirvac Facility Management
(MFM - formerly Engineering & Operations)
Snapshot 2014/15
Overview of the Portfolio Managed
MFM manages the Mirvac investment portfolio and a number of smaller portfolios for
external owners. The Vital Statistics of the Mirvac Portfolio are as follows:
Value : $7.2B with another $2B in the pipeline
Physical Area: Office (43) 725,000 m2 NLA, Retail (15) 327,000 m2 GLA, Industrial
(22) 315,000 m2 NLA
Locations: 76 Locations around Australia located in Sydney CBD and Suburbs,
Melbourne CBD, Perth CBD, Canberra, QLD CBD, outer Suburban and North QLD.
Developments - MFM are actively involved in the Major development projects in the
Design, PCG, DLP and Transition. Currently 5 Major office projects are underway
with a total NLA of 140,000 m2
Customers & Visitors
338,000 people visit the MFM managed locations daily and of these 60,000 are tenants.
The Tenants contacted us (through the MFM Customer Service Centre) on more than
15,000 occasions in 2014. 3442 by phone and 12,000 using Email or our Web Portal, The
average closure time (request to completion) was less than 2.5 days. Over a 12 month
period 500 Incidents were reported, 30 became claims and only 6 resulted in a payout with
the average <$8,000.
Financial Management
We develop and manage an Expenditure Budget (Opex) of $300M and a Capital (Capex)
Expenditure Budget (varying year on year) from $50M to $150M. The team manages all of
the programming, planning, work orders (73,000pa), contracts (>1000pa) and financial
approvals associated with this expenditure. The Budget to Actual Variance are managed
within a tight range with current performance controllable Opex -3.81% and budgeted Capex
-1.61%.
Procurement Savings achieved by MFM (nett of those identified in Energy Procurement and
Savings below) have delivered cost reductions in Opex $1.6M and Capex $540K in the
14/15 fiscal year up to March 2015.
Contractors
MFM manage 400 contractor visits per day equating to an average of 54,000 contractor
hours per month. The Contractors complete 7000 general and 11000 site specific inductions
online and we review in excess of 1000 Safety Management Plans and 4000 Safe Work
Method Statements centrally.
2. Page 2 of 5
Mirvac FacilityManagement2014/15
People
91 people currently work in the MFM team with approximately 80% embedded in the
locations managed, supported by 20% in Head Office.
Gender Diversity has increased from a low of 3% pre 2005 to the current 18.6%. The
encouraging signs are that the number of females working in the field (traditionally male
dominated) is where all of the recent increases are coming from. 17.5% of the team have
Flexible work Plans and the Engagement score for MFM is a credible 68% (Aon Hewitt “High
Performance - Best Employer” Range). The skillset, ethnic background and experience of
the team is diverse.
The total cost of delivery of the MFM team, when compared to the Property Council of
Australia (PCA) Benchmarks (2014) is 11.7% below the mean for Office and 46% below
for Retail
Integration
The MFM team is fully integrated with the other areas of the business providing direct
management services to the properties. Integration also extends to the development
business with MFM providing design input and testing out new concepts that eventually
become part of new developments. MFM provides services to the Investment arm of the
business during disposals and acquisitions and via management reporting
Income Stream
MFM operates manages (through a third party) Embedded Energy Networks that are
currently delivering and additional $2.1M pa to the Owner with additional networks
feasibilities completed reflecting a further $365Kpa.
Funding
MFM has secured $6.75 million of funding towards its energy and water efficiency initiatives
from government programs such as the Green Building Fund, Energy Saving Scheme and
Victorian Energy Efficiency Target scheme
Energy Procurement
MFM’s energy procurement work has secured new electricity supply agreements across
calendar years 2014, 2015 and 2016 which are delivering approximately $2.9 million in
electricity cost savings.
MFM utilised an industry tender process that cost $38,760 and delivered a procurement cost
saving of $183,203 compared to a broker approach with fees of 1.5% of the procured energy
cost per year of the contract, equating to a total cost of $221,963 from 2014 to 2016.
MFM have also been active in the gas market securing $50,000 pa saving through the tender
of gas supplies across NSW, ACT and VIC.
3. Page 3 of 5
Mirvac FacilityManagement2014/15
At the Como Centre MFM identified a significant ‘take or pay’ risk of approximately $70,000
due to planned works on the Como Centre’s boilers. MFM achieved a small reduction in gas
price rates and secured a contract with no ‘take or pay’ clauses to mitigate the $70,000 risk.
MFM have also utilised our procurement expertise for new developments. At 699 Bourke St
the Development team were about to contract for 38TJ of gas supply with a 90% ‘take or pay’
requirement. This contract would have resulted in a minimum annual charge of approximately
$340,000 irrespective of if the property used any gas. MFM successfully challenged the
contract amount and had it reduced by approximately two thirds and achieved savings of over
$200,000 pa.
Group Environmental Strategy
Mirvac Group launched a new Sustainability Strategy titled “This Changes Everything” for the
wider organisation which included some ambitious targets. MFM were well down the road to
achieving these targets and the Group Strategy assisted in negotiations (particularly around
timing) with the other stakeholders in the business.
Energy Efficiency
Since 2009, Mirvac’s Office portfolio has reduced its electricity use per square meter by 56%
which equates to a saving in 2014 of $7,438,706.
As approximately 30% of the Office portfolio is gross lease there is a direct benefit to Mirvac
of $2.23 million pa and the remaining $5.2 million pa reduces tenant outgoings
Using a cap rate of 7.45%, the $7.4 million in energy cost savings has a potential $99.8 million
valuation uplift or $69.9 million if only the net lease portion is used.
As an individual example 275 Kent Street has reduced carbon emissions by 3,144 Tonnes
CO2 pa representing an outstanding 38% reduction in Greenhouse Gas emissions and
delivered a $500,000 reduction in energy costs.
Carbon
Through energy efficiency and low carbon generation the Office portfolio has reduced Carbon
emissions by 48% per square metre from FY2009 to FY2014. Reflected by an increase in
the average NABERS Energy Rating for the Office Portfolio increasing from 2.5 Stars to 5+
Stars during this period. Mirvac are one of the few portfolios to successfully operate
cogeneration and we have achieved both the first Office building cogeneration plant and the
highest number of operating plants in the Australian property industry.
In FY2014 Mirvac’s 4 Cogeneration plants offset 2,845 tonnes of CO2 – equivalent to taking
800 cars off the road.
Mirvac is also the first to achieve a 6 star NABERS Energy rating at a major property without
the use of Green Power. The 6 Star rating at 23 Furzer St was recognised by the NABERS
governing office:
“A 6.0 Star NABERS rating is classified as ‘market leading’, and Mirvac’s ability to realise
this achievement for a major office building demonstrates their leadership in sustainability.”
4. Page 4 of 5
Mirvac FacilityManagement2014/15
“Mirvac’s achievement has raised the bar for the property industry, and is an inspiration for
the retrofit movement to continue in Australia, ensuring Australia retains its place as global
market leaders in sustainability.”
Director of the Metropolitan Branch, Office of Environment& Heritage,Mr. Tom Grosskopf
Water
From FY13 to FY14, Mirvac Investments reduced water intensity by 6% which equates to an
annual saving in 2014 of $314,692
Rainwater and Grey Water systems offset 14,747 KL of potable water at 23 Furzer Street in
2014, saving $76,684 in potable water charges.
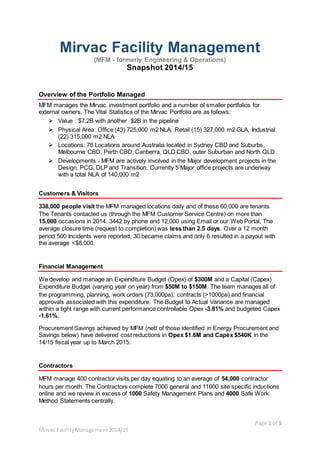
When we reach our target of 15% reduction in water by 2018, from 2013 baseline, we will
reduce our water bill by $2,629,623 and avoid $469,292 from predicted water cost increases.
Waste
Since the end of FY2013 the Investment portfolio’s recycling rate has increased by 10%,
rising from 34% to 44% and are on target to achieve our 45% target at the end of FY2015.
This improvement has been achieved by the introduction of new technology and close
engagement with our tenants.
MFM have implemented an innovative organics processing system called Pulpmaster, from
April 2014 the system has diverted over 314 Tonnes of organic waste from landfill and saved
$47,000 in landfill costs.
Auditing waste data has identified further savings for tenants. Cardboard collection costs have
been reduced by almost $25,000 across 5 NSW sites and at 275 Kent St MFM identified
$5,300 in overcharges to Westpac from their secure paper supplier
$4,010,787
$5,118,893
$4,649,601
$2,489,271
$0
$1,000,000
$2,000,000
$3,000,000
$4,000,000
$5,000,000
$6,000,000
FY13 FY14 FY15 FY16 FY17 FY18
This Changes Everything - Water Cost Savings
Bussiness as Usual CPI This Changes Everything
$2,629,623 Water
costsavings
$469,292 price
increase saving
5. Page 5 of 5
Mirvac FacilityManagement2014/15
MFM continue to work toward the This Changes Everything recycling rate target of 75% in
2018. When the Investment portfolio reaches this target we will reduce our landfill costs in
NSW alone by $783,218 and avoid $373,801 of cost from set landfill tax increases. In
NSW landfill fees have increased from $266/tonne in FY13 to $310/tonne in FY15 and
expected to reach $352/tonne in FY17.
Charity
MFM support the Think Pink charity through an innovative strategy to donate redundant
building material such as disconnected electrical cabling. The MFM team and our
contractors donate time to remove and scrap the redundant materials with the resulting
scrap value donated to Think Pink.
At 20 Bond St, MFM raised $13,369 for Think Pink and we are currently working on another
initiative at the Harbourside Shopping Centre.
Recognition
2014 FMA Provider of FM Services In-House
2014 Green Globes 10 Year Sustainability Award
2014 PCA Best Sustainable Existing Buildings 10-20 Bond Street.
2013 FMA Contribution to Energy Efficiency Mirvac Office Portfolio
2012 FMA Contribution to Energy Efficiency 275 Kent Street
Innovation
Constantly changing Customer and Business expectations and pressure on head –count
means that MFM need to view Innovation as critical to “business as usual”. There is a heavy
use of technology by MFM (where possible) for monotonous, repetitive yet critical activities.
Examples include; online inductions, automated maintenance management, key control,
contractor access management. Other innovations are necessary to continually reduce the
cost of operation particularly in the variable cost areas such as utilities (e.g. Energy
Management).
$1,536,520
$2,155,049
$1,781,248
$998,030
$0
$500,000
$1,000,000
$1,500,000
$2,000,000
$2,500,000
FY13 FY14 FY15 FY16 FY17 FY18
This Changes Everything - NSW Landfill Costs
Business as usual CPI This Changes Everything
$373,801 price
increase
saving
$783,218
Landfill cost
savings