Predicting cancellation probabilities of airline bookings using a discrete hazard model

In airline revenue management, an accurate prediction of cancellations is crucial, since a significant number of bookings are cancelled before departure. Accurate estimation of cancellation behavior is essential for airlines, so that they can allow more reservations on a flight than there is physical capacity (“overbooking”), which is a significant source of revenue. Cancellation probabilities depend in a complex manner on several flight-related and passenger-related attributes. A proportional hazard model is applied to predict the “hazard rates”, i.e. the conditional risks of a reservation being cancelled. These are used to forecast the expected number of cancellations depending on bookings on hand and forecasted future demand. We enhanced the standard maximum-likelihood estimator in order to obtain practicable processing time and memory consumption. The new method provides stable predictions and improves accuracy significantly compared to a time series approach.

Recommended
More Related Content
Viewers also liked
Recently uploaded
Recently uploaded (20)
Predicting cancellation probabilities of airline bookings using a discrete hazard model
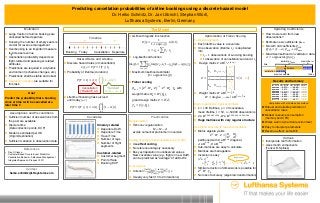
- 1. Predicting cancellation probabilities of airline bookings using a discrete hazard model Dr. Heiko Schmitz, Dr. Jan Ulbricht, Stephan Würll, Lufthansa Systems, Berlin, Germany Motivation ► Large fraction of airline bookings are cancelled before departure ► Knowing the number of empty seats is crucial for revenue management ► Overbooking is an important measure to increase revenue ► Cancellation probability depends on flight-related and passenger-related attributes ► Predictions are required in a dynamic environment (schedule changes, etc.) ► Predictions shall be stable and robust ► Regression models are suitable for this task The Model Goal Predict the probability that a booking done at time t will be cancelled at a later time t‘. Assumptions and Preconditions ► Sufficient number of observations from the past are available ► Discrete time (Data collection points, DCP) ► Model is estimated per OD (Origin/Destination) ► Sufficient variation in observation data ► GLM with logistic link function 𝐹 𝜂 = 1 1 + exp −𝜂 ∈ 0,1 , 𝜂 = 𝛾0 + 𝛽𝑗 ∙ 𝑥𝑗 ► Log-likelihood function ln𝐿 𝛽 = 𝑦𝑖𝑗ln𝜆 𝑗|𝑥𝑖 + 1 − 𝑦𝑖𝑗 ln 1 − 𝜆 𝑗|𝑥𝑖 𝑡 𝑖 𝑗=1 𝑛 𝑖=1 ► Maximum likelihood estimator 𝛽 = argmax ln 𝐿 𝛽 ► Fisher scoring 𝛽 𝑘+1 = 𝑍T ∙ 𝑊𝑘 ∙ 𝑍 −1 ∙ 𝑍T ∙ 𝑊𝑘 ∙ 𝑦 𝑘 with weight matrix 𝑊𝑘 = 𝑊 𝛽 𝑘 , grand design matrix 𝑍 = 𝑍 𝑥 , 𝑦 𝑘 = 𝑦 𝑦, 𝛽 𝑘 . • 𝑑𝑑𝑑𝑑𝑑𝑃(𝑇dddd = 𝑡) = 𝜆(𝑡) 1 − 𝜆(𝑖) , 𝑡 = 0,1, … , 𝑘, 𝑘 + 1 𝑡−1 𝑖=0 Practicalities Regularization ► Tikhonov regularization 𝑀 → 𝑀 − 𝜀I avoids numerical problems in inversion Coding of categorical covariables (e.g. DoW) ► Use effect coding ► No reference category necessary ► Easy extrapolation to unobserved values New covariate value (e.g. flight on new DoW can be predicted as “average” of all DoWs Convergence ► Criterion ln𝐿 𝛽 𝑘+1 −ln𝐿 𝛽 𝑘 ln𝐿 𝛽 𝑘+1 +0.1 ≤ 𝜀 ► Usually very fast (10 to 20 iterations) Hazard Rates and Lifetime ► Discrete hazard rates (of cancellation) 𝜆 𝑡 ≔ 𝑃 𝑇 = 𝑡|𝑇 ≥ 𝑡 ► Probability of lifetime (duration) 𝑡 ► Lifetime if booking has survived until today (=r ) 𝑃(𝑇 = 𝑡|𝑇 ≥ 𝑟) = 𝜆(𝑡) ∙ 1 − 𝜆 𝑖 𝑡−1 𝑖=𝑟 𝑃(𝑇 = 𝑡) = 𝜆(𝑡) ∙ 1 − 𝜆 𝑖 𝑡−1 𝑖=0 Cancellation (”Hazard“) at 𝑡 “Survival“ 𝑖 = 0, … , 𝑡 − 1 DepartureTodayBooking Cancellation Timeline T1 T2 Covariates Itinerary-related ► Departure DoW ► Departure Time ► Travel Time ► Number of legs ► Number of flight segments Customer-related ► Customer segment ► Point of Sale ► Booking DCP Outlook ► Incorporate tariff information ► Use smooth components (Tensor B-Splines) Updating Coefficients ► How do we learn from new observations? ► Estimate new coefficients 𝛽new ► Mix with old coefficients 𝛽old 𝛽 𝛼 = 1 − 𝛼 𝛽old + 𝛼 𝛽new ► Maximize likelihood on validation data 𝛼∗ = argmax ln𝐿 𝛽 𝛼 today time estimation validation validationestimation previous update maximize ln𝐿estimate 𝛽new Results and Summary Comparison with old time series method ►Robust and reliable prediction of cancellation rates ►Modest resource consumption (memory and CPU) ►Works well in dynamical environment ►Easy to interpret parameters ►Revenue effect: some M$ Market PMAD old PMAD new Diff pp 1 0.372 0.350 2.2 2 0.372 0.349 2.3 3 0.622 0.549 7.3 4 0.654 0.555 9.8 5 0.422 0.389 3.3 Mean 0.530 0.471 5.9 Optimization of Fisher Scoring Textbook approach ► Each lifetime value is a covariate ► One observation (lifetime 𝑡𝑖 ) is duplicated into ►𝑡𝑖 − 1 observations of surviving booking ►1 observation of cancellation/survival at 𝑡𝑖 ► Design matrix 𝑍 ∈ ℝ 𝑡 𝑖×(𝑘+𝑝) 𝑍 = 𝐈 𝑡1 𝟎 𝑡1×(𝑘−𝑡1) 𝐱1 T ⋮ 𝐱1 T ⋮ ⋮ ⋮ 𝐈 𝒕 𝒏 𝟎 𝑡 𝑛×(𝑘−𝑡 𝑛) 𝐱 𝑛 T ⋮ 𝐱 𝑛 T = 𝑍1 𝑍2 ► Weight matrix 𝑊 ∈ ℝ 𝑡 𝑖× 𝑡 𝑖 𝑊 = diag 𝑤1, … , 𝑤 𝑛 ∈ ℝ 𝑡 𝑖× 𝑡 𝑖 Matrix operations: Typical numbers ► 𝑘 = 100 lifetimes, 𝑝 = 20 covariates, mean lifetime 𝑡 = 50, 𝑛~50,000 observations ► 𝑍 ∈ ℝ2,500,000×120 , 𝑊 ∈ ℝ2,500,000×2,500,000 ► Huge matrices with very regular structure Use block structure to reduce dimensions ► Matrix algebra yields 𝑍T ∙ 𝑊 ∙ 𝑍 = 𝐷 𝐵 𝐵T 𝐴 ; partitioned with 𝐷 ∈ ℝ 𝑘×𝑘 diagonal, 𝐴 ∈ ℝ 𝑝×𝑝 , 𝐵 ∈ ℝ 𝑘×𝑝 ► Sub-matrices are easy to calculate ► Matrices are manageable ► Inversion is easy 𝑍T 𝑊𝑍 −1 = 𝐷−1 0 0 0 + −𝐷−1 𝐵 I 𝐴 − 𝐵T 𝐷−1 𝐵 −1 −𝐵T 𝐷−1 I ► Similar reduction of dimensions is possible for 𝑍T ∙ 𝑊 ∙ 𝑦 𝑘 ► No loss of accuracy (algebraic transformation) References ■ Dan C. Iliescu, Customer Based Time-to-Event Models for Cancellation Behavior: A Revenue Management Integrated Approach, Proquest, 2011 Contact heiko.schmitz@LHsystems.com Regularize!