1. Stephan DiTullio
11/21/16
Forest ecology/ Prof. Singleton
Comparison of Canopy and Understory trees in the Forest Ecology Permanent Research Plot
Introduction:
This study compared the forest canopy and understory trees in a permanent research plot located
near the Franklin Pierce University Red Trail in Rindge, NH. The permanent plot contains
several different tree species, some only found in the canopy some only found in the understory.
The forest floor in the plot includes numerous treefall pits and mounds. There were several
standing dead trees, along with dead limbs on the ground.
The permanent plot is 30 m by 60 m. A mix of deciduous and coniferous trees cover the plot.
There are treefall gaps that surrounding trees have started to fill in with lateral growth. In my
study, I considered any trees greater than 10 cm dbh as canopy trees, and any < 10 cm dbh as
understory trees. My basic question was whether the mix of tree species in the understory was
similar to that in the canopy. If yes, the mix of species may not change much in the future; if no,
the mix of tree species in the forest is likely changing.
Methods:
To gather the data, I ran four transects running south to north from the top edge of the plot
running downhill. Each transect measured 30 meters long, with four sample points for each
transect. The sample points were located at 5 meters, 10 meters, 20 meters, and 30 meters. At
each sample point I recorded the species of canopy and understory trees using the point-quarter
2. method. I also measured the distance to the tree from the sample point. After the data was
collected I used Microsoft Excel to run three tests: assuming equal variances Based on my
distance measurements, I also calculated density estimates and compared density of canopy vs
understory using a t-test assuming equal variances. Lastly a chi-square analysis was run to
compare tree species composition of the understory with the canopy.
Results:
In the first analysis of the t-test comparing mean values (Table 1) revealed that the mean species
richness was the same for canopy (2.94) and understory (2.94). The p-value is 1, meaning there
is no statistical significance based on species richness. The second test was the density estimate
(Figure 1 and Table 2), to compare the density between the canopy and the understory. Figure 1
shows the density estimate scatter plot graph. The graph does not show much variation of density
estimates. Table 2 reports that the mean value of canopy is 9.585 and the understory mean is
11.863. The t-test describing Table 2 revealed that the two sets of data are not statistically
significant (p-value= 0.102.) Figure 2 is an error bar graph comparing the mean values of density
estimates. The error bar indicated that is no statistical significance between the canopy and the
understory.
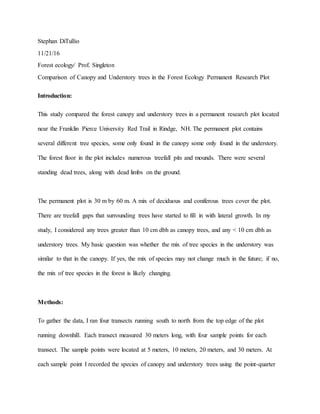
The last analysis I ran was the chi-squared test. The results from this test are shown in Figure 3
and Table 3. Figure 3 is a bar graph showing the percent of each species in the community. The
graph is from most abundant in the canopy too lowest in the canopy. Table 3 shows that is there
is statistical significance (p-value at 0.0015). The X2 value is 30.14 with a degree of freedom of
12.
3. Discussion:
The results of the comparison between mean species richness values for canopy vs understory
were the same, meaning the p-value is 1 (Table 1). The results for density estimates between
canopy and understory was not significant because the p-value is .102 found in Table 2. We can
say that the densities throughout the transect in the canopy are less than the densities found
throughout the understory, shown in Fig. 1 and Fig. 2. This makes sense because there are gaps
with in the transects that allows light in for the young saplings to grow. The error bar graph (Fig.
2) clearly shows that the error bars overlap one another meaning there is no statistical
significance.
The chi-squared test measures the percent of each species in the community (canopy/understory).
The results of this chi-squared analysis in Fig. 3 revealed that eastern hemlock, red maple,
yellow birch, make up roughly 15% of the canopy community and are the dominant species. In
the understory, yellow birch is the dominant species making up roughly 33% of the understory
community. The second highest species abundance is eastern hemlock at 25%, and a close third
between red maple and American beech at 15%. This analysis proved to be significant with a p-
value of 0.0015 (Table 3). Bases on this analysis we can prove what species will be in the future
canopy. In this case, yellow birch and eastern hemlock are most likely to be present.
Conclusion:
In conclusion species richness is similar in the canopy and the understory. Species richness is the
number of different species found. This analysis was conducted for each sample plot. There was
no significance found. The density estimate test found that there was no significance between the
canopy and understory densities. We can determine that there is slightly higher density in the
4. understory, but not enough to be significant. The understory density is higher than the canopy
density because the gaps allow the growth of new species on the forest floor. The chi-squared
analysis provided the percent of species in the community and demonstrated what trees might be
in the future canopy. The important to understand how forests change through time, helps us
determine the impact and response to climate change and natural disasters.
Figures and Tables:
Table 1: T-Test assuming equal means of species richness.
Table 2: T-Test comparing densities of species in canopy vs understory.
Table 3: Results of chi-squared analysis
canopy understory
Mean 2.94 2.94
Variance 0.6 0.73
Observations 16 16
df 15
p-value 1
canopy understory
Mean 9.585 11.8625
Observations 4 4
df 3
p-value 0.102
chi square 30.14
observ. 13
df= 12
p-value 0.0015
5. Figure 1: Scatter plot of density estimate comparing canopy vs understory
Figure 2: Error bar graph comparing density estimates.
0
5
10
15
20
25
0 0.5 1 1.5 2 2.5
DENSITYESTIMATES
FOREST TYPE (CANOPY=1, UNDERSTORY=2)
Density Etimates of Canopy vs
Understory
2
7
12
17
AverageDensityEstimates(%)
Canopy Understory
groups
Density estimates canopy vs understory
6. Figure 3: Bar graph chi-squared analysis comparing percent of species in canopy vs understory.
(AB= Am. Beech, RM= Red Maple, EH= Eastern Hemlock, YB= Yellow Birch, SM= Sugar
Maple, StM= Striped Maple, PB= Paper Birch, BB= Black Birch, BF, Balsam Fir, RS= Red
Spruce, WA= White Ash, RO= Red Oak.)
0
5
10
15
20
25
30
35
RelativeAbundance(%incommunity)
Tree Species
Number of Trees in the Canopy vs the Understroy
canopy understory