1. Group #1 6/14/2013
I
Final Design Report
MAE 162E –
Mechanical Engineering Design II
Instructors: Robert Shaefer, Herrick Chang, and Sarah Warren
Teaching Assistants: Christopher Kang, Sandeep Singh Rai, and Kuo-Tai Teng
Miracle Robot
Group Number 1
Daniel Lee
Layne Sakamoto
Austin Liu
Sonny Pham
Jonathan Harrison
University of California Los Angeles
Mechanical and Aerospace Engineering Department
6/14/2013
2. Group #1 6/14/2013
II
ABSTRACT
This report explores the preliminary design considerations as well as the final design
specifications for the autonomous disc transporter robot, “Miracle Robot.” The design
specifications are changed as the new dimensions and weight of the robot is: 11.37 in x 8.64 in
x 14.25 in and the loaded weight with 6 disks is 49.36 lb. According to our approximated center
of masses, RWD has lower minimum friction coefficients than FWD with loaded and unloaded
values of (0.258, 0.371) compared to (7.583, 0.75). With the steepest ramp angle being 14.036,
the required force to climb the incline is 4.138 lb for unloaded case and 12.085 lb for loaded
case. The calculated total traction forces using a friction coefficient of 0.50 is 8.275 lb and
24.171 lb for unloaded and loaded cases. The maximum required torque is 13.966 lb-in, which
is less than the optimal torque output for our chosen drive motor, the Hennkwell PD264M
Planetary Gear Motor. The drivetrain system is a direct-drive system due to the low optimal
RPM of the motor. The unloading mechanism consists of a motorized force gate that drops
down to allow the discs to roll off and re-lifts the gate after unloading. In the product testing
and evaluation, we performed six test runs using five discs, and the average complete run time
was 78.6 seconds and the deviation between runs was small. Overall, the “Miracle Robot” final
design adheres to all of the high level requirements.
TEAM PICTURE
Pictured from left to right: Austin Liu, Jonathan Harrison, Layne Sakamoto, Daniel Lee, Sonny
Pham
3. Group #1 6/14/2013
III
TABLE OF CONTENTS
MIRACLE ROBOT .............................................................................................................................. I
ABSTRACT........................................................................................................................................ II
TEAM PICTURE ................................................................................................................................ II
TABLE OF CONTENTS...................................................................................................................... III
LIST OF FIGURES..............................................................................................................................V
LIST OF TABLES.............................................................................................................................VIII
LIST OF SYMBOLS ........................................................................................................................... IX
I. INTRODUCTION....................................................................................................................... 1
I. NEED STATEMENT .................................................................................................................... 1
II. HIGH-LEVEL DESIGN REQUIREMENTS ........................................................................................... 1
III. PRIOR STATE-OF-THE-ART.......................................................................................................... 2
IV. STRUCTURE OF REPORT ............................................................................................................. 2
II. DESIGN DESCRIPTION ............................................................................................................. 3
I. DESIGN CONCEPT DEVELOPMENT................................................................................................ 3
II. DESIGN OVERVIEW................................................................................................................... 6
III. SYSTEMS SPECIFICATIONS ........................................................................................................ 10
IV. OVERALL SYSTEM DESIGN........................................................................................................ 11
IV. MECHANICAL SYSTEM OPERATION ............................................................................................ 16
V. CONTROL SYSTEM OPERATION.................................................................................................. 16
III. SUBSYSTEMS DESIGN DESCRIPTION ..................................................................................... 18
IV. DESIGN ANALYSIS.................................................................................................................. 24
I. TORQUE CALCULATIONS........................................................................................................... 30
II. UNLOADING MECHANISMS....................................................................................................... 34
V. CONTROL SYSTEM DESIGN.................................................................................................... 38
I. MOTOR SELECTION FROM TORQUE CALCULATIONS....................................................................... 38
II. UNLOADING MECHANISMS ...................................................................................................... 38
III. SENSORS AND THEORY OF OPERATIONS...................................................................................... 39
IV. STATE DIAGRAMS................................................................................................................... 40
VI. PRODUCT FABRICATION ....................................................................................................... 47
I. MACHINING OF SELECTED PARTS............................................................................................... 47
II. ASSEMBLY ............................................................................................................................ 49
4. Group #1 6/14/2013
IV
VII. PRODUCT TESTING AND EVALUATION ............................................................................. 53
VIII. WORK BREAKDOWN SCHEDULE ....................................................................................... 58
IX. BILL OF MATERIALS AND COST ANALYSIS............................................................................. 62
I. BILL OF MATERIALS ................................................................................................................ 62
II. COST ANALYSIS...................................................................................................................... 64
X. DESIGN REQUIREMENT SATISFACTION ................................................................................ 64
XI. CONCLUSIONS....................................................................................................................... 65
XII. REFERENCES...................................................................................................................... 65
XIII. APPENDIX.......................................................................................................................... 67
A. LENGTHY CALCULATIONS ......................................................................................................... 67
B. DETAILED FIGURES/LONG TABLES.............................................................................................. 71
C. CONTROL SOFTWARE .............................................................................................................. 75
D. ENGINEERING DRAWINGS ........................................................................................................ 77
5. Group #1 6/14/2013
V
LIST OF FIGURES
Figure 1: Isometric View of “Catapult” Concept Design #1............................................................ 3
Figure 2: Motor Placement in “Catapult” Concept Design #1........................................................ 3
Figure 3: Isometric View of “Disc Roller” Concept Design #2......................................................... 4
Figure 4: Isometric view of “Dump Truck” Concept Design #3 ...................................................... 4
Figure 5: Motors in the front and back will drive all of the wheels for “Dump Truck” design #3.. 5
Figure 6: Sensor Placement for “Dump Truck” Design #3.............................................................. 5
Figure 7: Isometric View ................................................................................................................. 7
Figure 8: Top View .......................................................................................................................... 8
Figure 9: Bottom View .................................................................................................................... 9
Figure 10: Side View...................................................................................................................... 10
Figure 11: Isometric View of Developed Design without Discs .................................................... 12
Figure 12: Bottom View of Developed Design.............................................................................. 12
Figure 13: Internal Gate Mechanism Used to Hold Discs in Place................................................ 13
Figure 14: Isometric View of Structural Base for Developed Design............................................ 13
Figure 15: Isometric View of Electronics and Circuit Board Mount.............................................. 14
Figure 16: Isometric View of Drive Train for Developed Design................................................... 15
Figure 17: Isometric View of Unloading Mechanism for Developed Design................................ 15
Figure 18: Exploded View of Electronics Board and Mount ......................................................... 18
Figure 19: Motor Driver ................................................................................................................ 18
Figure 20: Exploded View of Sensors............................................................................................ 19
Figure 21: Isometric View of Unloading Mechanism.................................................................... 20
Figure 22: Exploded View of Unloading Mechanism.................................................................... 21
Figure 23: Exploded View of Unloading Mechanism Servo.......................................................... 21
Figure 24: Isometric View of Servo Under Gate ........................................................................... 22
Figure 25: Exploded View of Drive Train....................................................................................... 23
Figure 26: Friction Coefficient Comparison Chart without Load.................................................. 25
Figure 27: Friction Coefficient Comparison Chart with Full Load................................................. 26
Figure 28: Motor Performance Curves ......................................................................................... 32
Figure 29: Free body diagram for forced gate after unloading disks ........................................... 35
Figure 30: Disk rolling down the slope.......................................................................................... 36
Figure 31: Motor Circuit Diagram ................................................................................................. 38
Figure 32: Sensor and Servo Circuit Diagram ............................................................................... 40
Figure 33: LabVIEW Statechart Diagram for Whole Demonstration Code & Testing Code ......... 41
Figure 34: State Diagram between Demonstration Code and Testing Code................................ 42
Figure 35: Demonstration Code Statechart Diagram ................................................................... 43
Figure 36: Testing Code Statechart Diagram ................................................................................ 44
Figure 37: Wall Follow Going Up Starting Area Sub-Statechart Diagram..................................... 44
6. Group #1 6/14/2013
VI
Figure 38: Wall Follow Going Up Ramp Sub-Statechart Diagram................................................. 45
Figure 39: Turn 180o
deg. In Counter Loop Sub-Statechart Diagram........................................... 46
Figure 40: Move in Reverse to Edge of Ramp Sub-Statechart Diagram....................................... 46
Figure 41: Section wall CAD drawing (top), Section wall finished piece (bottom)....................... 47
Figure 42: Motor mount CAD drawing (top), Motor mount finished piece (bottom).................. 48
Figure 43: Ramp Extender............................................................................................................. 49
Figure 44: Drive train subsystem showing the attachment of the motors .................................. 50
Figure 45: Two views of the shaft coupler press-fitted into the rear wheel................................ 50
Figure 46: Side view of toggle mechanism used for unloading.................................................... 51
Figure 47: Fully Assembled Robot ................................................................................................ 52
Figure 48: Up times using five discs.............................................................................................. 54
Figure 49: Unloading Times using five discs ................................................................................. 54
Figure 50: Down times using five discs......................................................................................... 55
Figure 51: Total times using five discs .......................................................................................... 55
Figure 52: Up times using three discs........................................................................................... 56
Figure 53: Unloading times using three discs............................................................................... 56
Figure 54: Down times using three discs...................................................................................... 57
Figure 55: Total times using three discs ....................................................................................... 57
Figure 56: Work Breakdown Schedule.......................................................................................... 58
Figure 57: Gantt Chart .................................................................................................................. 61
Figure 58: Exploded Robot Materials ........................................................................................... 62
Figure 59: Free Body Diagram of Vehicle on Incline Plane [1]...................................................... 67
Figure 60: Ramp Isometric View [4].............................................................................................. 69
Figure 61: Ramp Engineering Drawing [4] .................................................................................... 69
Figure 62: Side Dimension of Ramp 1........................................................................................... 70
Figure 63: Side Dimension of Ramp 2........................................................................................... 70
Figure 64: LabVIEW Front Panel ................................................................................................... 76
Figure 65: LabVIEW Main Block Diagram...................................................................................... 77
Figure 66: SB-RIO L-bracket Mount .............................................................................................. 77
Figure 67: Gate Servo Arm............................................................................................................ 78
Figure 68: Mount Mounting Strip................................................................................................. 78
Figure 69: Rear Shaft Support for Motor...................................................................................... 79
Figure 70: Rear Shaft Support Base .............................................................................................. 79
Figure 71: Servo Mount ................................................................................................................ 80
Figure 72: Shaft Coupler to Rear Wheel ....................................................................................... 80
Figure 73: Back U-Channel............................................................................................................ 81
Figure 74: Front U-Channel........................................................................................................... 81
Figure 75: Left U-Channel ............................................................................................................. 82
8. Group #1 6/14/2013
VIII
LIST OF TABLES
Table 1: Parameters used in friction coefficient calculation with and without load ................... 24
Table 2: Drive Systems and their respective friction coefficients with and without load............ 24
Table 3: Normal and Traction Forces without Load ..................................................................... 27
Table 4: Normal and Traction Forces with Full Load .................................................................... 27
Table 5: Center of mass lengths for loaded and unloaded cases (g = 386.088 in/s2
) .................. 28
Table 6: Weight Fraction Tables ................................................................................................... 28
Table 7: Inertial accelerations for each section............................................................................ 28
Table 8: Propulsion Force for each Section .................................................................................. 29
Table 9: Required propulsion torque for each section (RDriveWheel = 1.00 in)................................. 30
Table 10: Force and Torque Needed per Path Due to Weight (Forward) .................................... 31
Table 11: Motor Specifications..................................................................................................... 31
Table 12: Drive torque and required torque comparison table................................................... 32
Table 13: Wheel and Motor Dimensions...................................................................................... 33
Table 14: Torque Required per Track Path (Forward).................................................................. 33
Table 15: Torque Required per Track Path (Back) ........................................................................ 34
Table 16: HD High-torque Servo Specifications............................................................................ 37
Table 17: Miracle Robot Run-Times with Five Discs..................................................................... 53
Table 18: Miracle Robot Run-Times with Three Discs.................................................................. 55
Table 19: WBS Dictionary.............................................................................................................. 58
Table 20: Bill of Materials ............................................................................................................. 63
Table 21: Subsystem Design Requirement Satisfaction ............................................................... 64
Table 22: Ramp Section Parameters............................................................................................. 70
Table 23: Pairwise Comparison Chart........................................................................................... 71
Table 24: Weighted Design Scores................................................................................................ 71
Table 25: Types used in Objectives Tree Chart............................................................................. 71
Table 26: Objectives Tree Chart.................................................................................................... 72
Table 27: Bill of Materials Sorted by Parts.................................................................................... 73
Table 28: Error Analysis Tables for Five Discs............................................................................... 75
9. Group #1 6/14/2013
IX
LIST OF SYMBOLS
Symbol Definition Units
vinitial Velocity at the section start in/s
vfinal Velocity at the section end in/s
vave Average velocity at the section in/s
t Time to travel through section s
vmax Maximum velocity at section in/s
θ Ramp section elevation angle Degrees º
β Weight fraction over wheels
L Length of wheelbase in
CG Center of gravity
Lc Distance between rear wheelbase to CG in
h Height from base to CG in
value used to indicate front-wheel drive (value
of 1 for FWD and AWD, a 0 for RWD
value used to indicate rear-wheel drive (value
of 1 for RWD and AWD, a 0 for FWD
µrol Rolling friction coefficient
µf Friction coefficient between wheel and ramp
N Normal force lbf
Finertia Inertial force lbf
Fm Weight force lbf
FW Weight force along slope lbf
Frol Rolling force lbf
Ff Friction force lbf
FT Traction force lbf
Fprop Propulsion force lbf
ε Efficiency of the motor
r Drive wheel radius in
m Robot mass lbm
md Disc mass lbm
Force acting along vertical line lbf
Required force that the motor delivers lbf
Treq Total propulsion torque lb-in
Ft Tension force lbf
Etotal Total Energy Btu
Epotential Potential Energy Btu
Ekinetic Kinetic Energy Btu
g gravity ft/s2
Vd Velocity of the disk in unloading mechanism ft/s
Vdx Disk velocity in horizontal direction ft/s
10. Group #1 6/14/2013
X
Vdy Disk velocity in vertical direction ft/s
xf Final disk horizontal position ft
xi Initial disk horizontal position ft
yf Final disk vertical position ft
yi Initial disk vertical position ft
ax Horizontal acceleration ft/s2
ay Vertical acceleration ft/s2
11. Group #1 6/14/2013
1
I. INTRODUCTION
I. Need Statement
The design need of our project is to design an autonomous vehicle that performs bulk
material transportation within the team budget of $350. The vehicle must
autonomously deliver lead-disc cargo up a ramp path, unload the cargo into a collection
bin, and come down the ramp to receive additional cargo loads and re-perform this
cycle.
II. High-Level Design Requirements
The High Level Design Requirements discussed in this section are requirements that
each team must follow. These requirements were already set from the beginning of the
quarter.
The High Level Design Requirements are as follows:
1. The vehicle can move up and down the pre-designed ramp path autonomously
through several cycles.
2. The vehicle can load multiples (minimum 3 per run) of the cargo (lead discs – 6lbs)
and store them throughout its movement path and deliver the cargo through the
delivery mechanism in the collection bin area through several cycles. The lead discs
are loaded manually. The vehicle is only allowed to unload when completely inside
the unloading area marked on the top platform.
3. The whole device must fit inside a rectangular box of 12’’ x 12’’ x 16’’. If your box is
part of your design, then external dimensions can be no larger than 12’’ x 12’’ x 16’’.
The device must be fully assembled when it fits inside the box.
4. Vehicles must be powered by ordinary & readily available batteries, which can be
disposable (13 max) or rechargeable (15 max) but not both types. No other sources
of energy are permitted. Battery packs are allowed as long as the batteries comply
with above rules & are easily verifiable by judges.
5. All powered devices must have a readily accessible and clearly labeled emergency
kill switch to shut off the device.
6. One on/off switch can be installed on the vehicle and it can only be accessed in the
starting/ loading area to start or to end a load delivery trip.
7. Except those on the vehicle, no other devices or sensors are allowed to be on or
around the pathway.
8. For the conceptual design, the primary design parameters are: device dimensions,
cargo delivery system, load capacity, drive system, wheel size, wheel position, wheel
material, motor power requirements, and gear ratio. Choice of design parameters
must be based on engineering fundamentals.
9. The total budget for the project is $350.
12. Group #1 6/14/2013
2
III. Prior State-of-the-art
There are various examples in the real world of bulk transporters. A few examples of
prior work in this area include: freight trains, ships, tank truck, and dump trucks. Each
transport bulk material, but the type of material they transport is what differentiates
them from one another. Considering a tank truck as an example, its main purpose is for
“delivering gasoline, chemicals, foodstuff, and other products” [1]. Tank trucks, as well
as the other bulk transporters mentioned previously, were a result of the increasingly
need to transport bulk items from one place to another. Likewise, dump trucks are used
to transport bulk materials, such as construction materials, and then dump its contents
at its desired destination. Our design is similar to these bulk transporters in terms of its
purpose, but unlike dump trucks, our unloading mechanism does not require the carrier
to be raised and tilted, since we will have an incline already built in, thus requiring less
energy than traditional bulk transporters. In addition, our bulk transport will be
autonomous, whereas the prior examples are all controlled by human operators.
IV. Structure of Report
This report will be structured as follows. First, in Section II we provide a detailed
description of our design and our system operations followed by Section III where we
provide a detailed description of our subsystems’ designs. Next, in Section IV we provide
our design analysis which shows our power requirements along with our calculations
that we used to size our motors and our unloading mechanism. Section V shows our
control system design for motor selection, unloading mechanism, and sensors. We also
introduce the entire state diagram that was designed to run our robot. In Section VI, we
describe our product fabrication and assmebly. In section VII, we go into product testing
and evaluation, as well as provide a simple error analysis calculation regarding our run
times. In section VIII, we show the work breakdown schedule. Next, in section IX, we go
into our cost analysis and bill of materials. In section X, we go into details regarding our
design requirement satisfaction. This is followed by our Conclusion section which
summarizes our final design product along with analysis.
13. Group #1 6/14/2013
3
II. DESIGN DESCRIPTION
I. Design Concept Development
In order to arrive at a final design we first considered three possible concepts depicted
below.
Concept #1 “C pu ” Robo
Figure 1: Isometric View of “Catapult” Concept Design #1
Figure 2: Motor Placement in “Catapult” Concept Design #1
Our first concept is based on a catapult delivery system. For this concept, the robot will
be loaded with 2 lead discs and travel along the defined path using the pressure sensors
around its body in order to detect walls and send signals to turn robot. Figure 1 shows
the delivery system as a plate with a sliding actuator to push the lead discs into the
targeted area. As seen, the discs will be placed horizontally in the slot and when the
robot senses it is at the end of the track it will actuate the delivery system. Figure 2
shows this concept will be a front wheel drive and because of the lighter load this unit
carries it will be able to make faster and more trips within the allotted time.
Concept #2 “D s Ro ” Robo
Actuator
for delivery
system
Motor
Pressure
Sensors Front
14. Group #1 6/14/2013
4
Figure 3: Isometric View of “Disc Roller” Concept Design #2
This concept uses a slot system to hold the lead discs standing vertically on their round
sides. There are two advantages to this way of carrying the lead discs. First, this method
makes it easy to load multiple discs quickly and transport up to 8 per run. It also uses
less energy to release the payload into the box at the end of the run because no force
need be applied from the battery. The back plate will just drop down and allow the
plates to roll out of the carrier, due to the slope of the carrier base. This concept is
driven by a rear-wheel drivetrain (two motors, each on the back two wheels). Varying
the speeds of these motors can steer the robot while in motion. Three ultrasonic
detectors on the bottom of the vehicle, each spaced equally apart (with separation
distance equaling the thickness of the black tape), will be able to tell if the robot is
steering off course as it travels up the ramp from the start to the drop-off destination.
Concept #3 “Dump T u k” Robo
Figure 4: Isometric view of “Dump Truck” Concept Design #3
Delivery System
Delivery
system/Container
Front
Front
15. Group #1 6/14/2013
5
Figure 5: Motors in the front and back will drive all of the wheels for “Dump Truck” design #3
Figure 6: Sensor Placement for “Dump Truck” Design #3
Our third concept is based on a dump truck. The basic idea behind this concept design is
that it unloads the disks by dumping the disks as a dump truck would. Figure 4 shows
the isometric view of this design. As shown, the container that holds the lead disks has
an inclined top surface that allows for easy delivery. There will be a hydraulic
mechanism that allows the container to have this “dumping” feature. A pressure sensor
will be placed on the container that will signal the robot to go once the container has
reached its full capacity (or weight). Furthermore, Figure 5 indicates that this design is
an all-wheel drive. As a result, this design will require more energy to power the
additional motor compared to if it was a rear-wheel or front-wheel drive. Thus, this
design may be more complicated than the previous ones. In addition to the pressure
sensor, we will also put in some infrared sensors as shown in Figure 6. The infrared
sensor will be used to find the walls. Even though the figures shown do not depict it, this
overall appearance of this design will be tank shaped to give it the more robust look.
The most beneficial reason for using this design is that its storage capacity is larger than
the other designs. This allows for us to transport more lead disks than if we were using
the previous designs. Of course, this design may require more power and energy to
perform such tasks.
MotorMotor
Infrared
sensor
16. Group #1 6/14/2013
6
In order to arrive at a final decision between our three concepts we created a pairwise
comparison chart and decided as a team what criterion was important for our design.
We considered the cost, load capacity, power available, durability, aesthetics, and
sensitivity of the design. After weighing each criterion appropriately, we distributed
points to each design concept deservingly. The pairwise comparison chart, objectives
tree chart and all other accompanying charts are provided in the Appendix.
Once we made our pairwise comparison chart, we were able to begin our objectives
tree chart for each of our three designs. From here, we assigned evaluation marks from
0 to 10 for each design concept. Then we were able to assign order of merits based on
which design was best. We decided to continue development of our second design
concept, since it had the highest score, as shown in Tables 24 and 26 in the Appendix.
II. Design Overview
Our overall system design is based around a unidirectional vehicle that will be doing a
360 degree turn. The idea is based off of our second conceptual in which we have a
sloped ramp, but instead of an external gate, we added an internal gate that is a
detached ramp that pops up to hold the discs in place. To further iterate the basis of the
unloading mechanism, we are using a four-bar toggle mechanism. Instead of slots, we
are holding the discs together using bolts and nuts and in doing so the cargo will be able
to keep itself upright. In terms of drive train, our robot will be rear wheel drive because
most of the load is more towards the rear end and this will provide more traction on the
wheels. Also having a rear wheel drive train allows for sharper turns. Because of the
availability of reasonably sized and powerful motors, we are able to utilize a direct drive
system. The front wheels are casters because of the ease of usage and this allows all
control to be done using the rear wheels. Images and further explanation of each
component is detailed later in this report.
17. Group #1 6/14/2013
7
Figure 7: Isometric View
As noted in the picture, we are using three ultrasonic sensors for our navigation and
under the shown lead disc is a contact sensor. This sensor is used to detect the existence of a
load on the robot. On the backside are 2 more contact sensors used to detect the walls once
the robot backs up against the edge of the ramp.
18. Group #1 6/14/2013
8
Figure 8: Top View
Our SB-RIO will be mounted in a vertical position so that we can minimize space and
keep our electronics easily visible throughout the entire project. Our circuitry and wires will be
wrapped around the backside of our given SB-RIO board so having this format allows for ease of
access to all of the electrical components and allows us to change any components without
having to dissemble everything.
19. Group #1 6/14/2013
9
Figure 9: Bottom View
We kept our overall structure simple as well. Our structural base is an assembly of U-
channels and L-channels. This allows for ease of attachment and assembly with all of the other
components. The simplicity also allows for a larger tolerance because of the simplicity.
Considering our entire robot was manufactured in a simple machine shop, this decision
benefitted us greatly. We also encompassed handles into our design for ease of transportation
and handling during the testing phase. Along the back of the structure is a extruding portion of
our ramp. This part of the ramp will make contact with the edge of the track during unloading
to prevent any possible tipping while unloading because the load itself is about the weight of
the robot.
20. Group #1 6/14/2013
10
Figure 10: Side View
III. Systems Specifications
The Low-Level Design Requirements are the technical requirements that our team set
for our robot. These are more of the specifics of how our robot will run on the
competition day.
Our Low Level Design Requirements are as followed:
1. High load carrying capacity so that the maximum number of discs can be transported
per run (6-8 discs).
2. Delivery system that can be loaded and unloaded with minimal complications.
3. A combination of sensors in order to follow the track and sense when the loading
bay is emptied. If using an actuated unloading system a pressure sensor is needed.
4. At least one motor for rear or front wheel drive. All-wheel drive is considered in our
conceptual designs. Front wheel steering is preferred, but not required.
5. 2 run minimum in the allotted 10 minute time frame.
6. Average speed of at least 5ft/minute in order to meet the minimum number of runs.
7. A maximum of 13 disposable batteries will be used.
8. The shape of the robot must be a rectangular prism in order to maintain simplicity
and ease of accurate welding.
9. Unloading mechanism must use a minimum amount of power to actuate.
10. Wheelbase must be short enough to allow turning sharp corners.
21. Group #1 6/14/2013
11
Fortunately, we were able to satisfy most of our low level design requirements that are
listed above. Our traveling time for going up the ramp is about 40 seconds. Time for turning
and unloading takes about 6 seconds. When it is going down the ramp, the robot takes
about 32 seconds to get to its initial position. The total traveling time for one round trip is
approximately 78 seconds. During one round trip, we are able to carry up to 5 discs.
Our maximum velocity is 6in/s and dividing this by our wheel circumference we find our
required motor revolutions per minute are 57.3RPM. Hence we decided to use the Gear
Head Motor (GHM-13) from Lynxmotion [10].
Our motor is in a direct drive system and hence our drive torque is the direct torque
from our motors. Our drive torque at 94RPM will be 76.375 lb-in per motor. Hence our
total drive torque is this value multiplied by 2:
Drive Torque =
For our particular unloading mechanism, we only need one servo motor to control the
force gate and the required force and torque values are 0.112 lb and 0.173lb-in. Since the
initial potential energy is sufficient enough to fulfill require horizontal displacement, we
don’t need any additional subsystems. We used HD High-torque servo which has stall
torque of 14.76lb-in at 6V and 13.45 lb-in at 4.8V.
To run our system, which includes motor, servo motor, and Sb-rio board, we choose to
use two 12V battery packs and two 9V batteries. Although one 12V battery could be
sufficient enough to power both motor and Sb-rio, we choose to individual 12V battery pack
to power each component to be safe. One 9V battery is connected to the servo motor and
another one is connected to the sensor.
IV. Overall System Design
We kept the original foundations of our second design concept which is to have vertical
discs, held by a gate, unloaded off a ramp into the targeted area. Our changes included
to have the discs be held together vertically and kept in place with an internal four-bar
mechanized gate as shown in figure 11 below.
152.75 lb-in.
22. Group #1 6/14/2013
12
Figure 11: Isometric View of Developed Design without Discs
Figure 12: Bottom View of Developed Design
Front
23. Group #1 6/14/2013
13
Figure 13: Internal Gate Mechanism Used to Hold Discs in Place
This overall design holds 6 lead discs held together on a ramp. The above internal
gate mechanism holds the cargo in place while the robot travels up the track and to
the delivery zone. Once at that point it will use its sensors to execute a 180 degree
turn and then drop its external gate directly on to the unloading zone. Our robot is
split into several subsystems that help obtain this goal: structural base, electronics,
drive train, and the unloading mechanism.
Everything is attached to a structural base sub-assembly which is essentially a
combination of U-channels that are readily available, Figure 14.
Figure 14: Isometric View of Structural Base for Developed Design
Using this as our main assembly point we can attach the electronics around the
perimeter and the circuit board to the front in an upright vertical position so that we
will be able to access any and all wiring easily.
24. Group #1 6/14/2013
14
The electronics and circuit board will be mounted to the front of the robot as
depicted in Figure 11. Below is the sub-assembly of the electronics mount.
Figure 15: Isometric View of Electronics and Circuit Board Mount
The electronics is the brain of our robot. Here is where the programs are executed
and hence all of our sensors will be wired to our board. We are utilizing three
ultrasonic range finders located at the front, and one on each side. With this we are
also using a force sensor in our cargo area to detect the presence of our load. Details
of their function will be discussed in the subsystems section.
Our drive train is a rear wheel drive using two motors; one motor per wheel. Our
wheels are 2 inch diameter wheels and are connected to the motor directly because
our motor selection is powerful enough to propel our robot without a gearing
system. The front wheels will be simply a pair of freely swiveling casters. Turning will
be done by adjusting the speed of each motor individually allowing us to make our
desired 180 degree turn at the end of the track.
25. Group #1 6/14/2013
15
Figure 16: Isometric View of Drive Train for Developed Design
The last of our subassemblies is the unloading mechanism. We implemented a gate
within the ramp that inclines in order to hold the lead discs in place. Once the robot
is ready to unload the gate will recline and allow the load to roll off the ramp into
the box.
Figure 17: Isometric View of Unloading Mechanism for Developed Design
26. Group #1 6/14/2013
16
IV. Mechanical System Operation
Our mechanical systems include the drivetrain and the unloading mechanism. Our
drivetrain uses two motors attached to a dual-motor controller, which determines
speed and direction of our robot using voltage potentials across the motors. Since we
are using the analog mode on the controller, we can vary the voltage applied to each
wheel to independently make the wheels spin at various velocities, either forward or
backward. Since each wheel’s motion is independent of each other, our robot can turn
by having each wheel spin in different directions or both forward at different rates. In
the front of the robot are two casters to allow easy rolling and turning in all directions.
The unloading mechanism uses a servo attached to a toggle mechanism. This system is
comprised of a four bar mechanism that either locks two sets of linkages parallel or
allows them to fold. The parallel linkages are the basis for the force gate that protrudes
from the ramp, as shown in figure 17. This allows us to apply force up to the yield
strength of the aluminum linkages without needing much force from the servo. Our
FPGA board sends pulse-width modulation signals to our servo, which translates into a
specific position. These positions will be the reclined state, not supporting any weight,
and the inclined state, supporting the discs due to the parallel linkages.
V. Control System Operation
The user control system consists of a LabVIEW program that is interfaced with SB-RIO,
which acts as our FPGA. The LabVIEW programming is discussed in detail in section VI.
Control System Design. The entirety of the robot navigation is written in the main statechart
diagram that is linked to the main code. The SB-RIO is connected to three ultrasonic
proximity sensors, which are located at the middle front of the robot, and the two sides
near the front of the robot. Three connected contact sensors are placed at the area where
the discs are loaded and two are on the rear where the robot contacts the ramp during
unloading. The robot uses the ultrasonic sensor readings for the following actions: it uses
the left sensor reading to wall follow at a certain distance along the ramp, it uses the right
sensor reading to determine the correct wall following distance along the ramp, and it uses
the front sensor reading to determine if there is an object in front of it so the robot has to
perform a 180 degree turn. The robot uses the three contact sensors for the following
actions: it uses the two rear sensors to determine whether or not it is in the correct position
to unload the discs and it uses the button on the disc loading area to determine whether or
not discs are currently loaded.
In order to control the mechanical devices on the robot, which are the two drive motors
and the positional servo, the statechart outputs analog outputs from the FPGA to control
the motors and the servo. For the motor, the command output is sent to the Sabretooth
27. Group #1 6/14/2013
17
dual motor controller, which receives separate analog voltages to set the speed and
direction of each drive motor. Straight movement is induced by setting the motor speeds to
the same value and turning is induced by creating a speed differential between the motors.
To control the servo, a PWM signal with a pulse width high and low that corresponds to the
servo’s position is sent from the SB-Rio directly to the servo.
28. Group #1 6/14/2013
18
III. SUBSYSTEMS DESIGN DESCRIPTION
I. Electronics
Description
Our electronics will consist of the following components: SB-RIO 9632 electronics board,
three ultrasonic range finders, two push button sensors, force sensor made from a
spacebar, dual DC motor drive controller, 5V voltage regulator, a rechargeable 12V
battery pack, 9V alkaline battery pack, on/off switch. The servo and drive train motors
will be described in separate sections.
Figure 18: Exploded View of Electronics Board and Mount
Figure 19: Motor Driver
29. Group #1 6/14/2013
19
The SB-RIO is our overall interface between the host pc and the entire system. It is the
unit that incorporates our field-programmable gate array (FPGA) and our
microcontroller. Our FPGA connects to our motor drive controller and then our drive
train which will be described in the motor sizing portion of this report. Our 6.2V voltage
regulator will be used for the drive train and servos. Our on/off switch will be attached
to our board as well to serve as our point of main power and our batteries will be used
to supply that power. We will be using the rechargeable battery pack during testing and
hold the alkaline battery pack for our actual runs.
Figure 20: Exploded View of Sensors
Our three ultrasonic range finders will be used to locate the robot along the path. The
two on the sides, as shown in figure 20 will be used to keep the robot in the center of
the track. Though only one is needed we will be using two as a redundant system. One is
mounted on the front to determine when there is a wall which will translate into a
turning movement. Our two push button sensors on the rear beneath the unloading
gate serve the following purpose. When the robot turns around, both buttons need to
make contact with the ramp wall in order to unload the lead discs. This serves the
function of permitting the force gate to drop down once the push buttons make contact
with the ramp wall. Our sensors run with a voltage of 5V and this will be achieved using
our 5V voltage regulators.
The force sensor will be placed on the loading bay, Figure 17. The concept of operation
is simple. When the force button sensor is pressed, it closes a circuit and sends a signal
to indicate that the robot is fully loaded. Once this occurs, it will start traveling. In this
manner, we will not have to turn the robot off in order to reload the next run.
Requirements
30. Group #1 6/14/2013
20
The force button sensor is made out of a space bar and only requires to be pressed or
not to serve its function. We followed the circuit diagram from the Electronics Lab to
construct this sensor. We only require the correct resistor and 5V regulator for proper
operation.
Our ultrasonic sensors are used to measure the distance from the side walls and keep
our robot in the middle hence it will need an accuracy of a few centimeters. Our chosen
HC-SR04 model has a minimum range of 2cm and a maximum range of 4m with an
accuracy of + 3mm which is a very tight tolerance and will allow our sensors to serve its
purposes well.
Both sensors run off of a working voltage of 5V DC and hence we use a 5V regulator for
all of our sensors. Our 9V alkaline batteries will be used to power all of the sensors
because of the little power needed to operate them.
Because we set our round-trip time to 136.1 seconds we need a battery pack that can
last the entire trip and can be recharged because of the testing that will be done. With
this run time and the 12V voltage required by our motors we chose a rechargeable 12V
battery pack with an energy capacity of 4200mA-h. Our robot will run at a current root
mean squared value of 2.934A. This allows us to run for 1.4 hours which is much greater
than the required round-trip time.
II. Unloading Mechanism
Figure 21: Isometric View of Unloading Mechanism
31. Group #1 6/14/2013
21
Figure 22: Exploded View of Unloading Mechanism
Figure 23: Exploded View of Unloading Mechanism Servo
32. Group #1 6/14/2013
22
Description
To reiterate our objective, we are aiming to deliver six lead weight discs up a defined
path. From there we will have our robot execute a 180 degree turn and unload our
cargo into the targeted area. Figure 17 shows our unloading mechanism and figure 21
shows our four bar mechanism under the gate. Our gate protrudes from the ramp in
order to hold the cargo. Figure 22 shows the cargo area of the unloading mechanism in
an exploded view. Figure 23 shows the exploded view of the servo mount under the
platform. Once our force button sensor senses no discs, our gate will revert back to its
starting position and the robot will travel back for the next load.
Figure 24: Isometric View of Servo Under Gate
Requirements
The unloading mechanism needed a method of holding the load in place and a method
of unloading the load. Hence we used the internal four bar mechanized gate to keep the
discs on the force button sensor. This portion needs to be able to hold up a weight of
36lb. The mechanism also has to be able to adjust to both the inclined and reclined
position in appropriate time in order to achieve our desired round-trip time.
III. Direct Drive Train
Description
The direct drive train pictured in figure 16 encompasses two sets of motors, wheels,
shaft support bars, and couplers. The overall function of this subsystem is to propel our
robot. Using a direct drive train our outputted torque comes directly from our motors,
which are described under the Power Requirements and Motor Sizing section of this
report. Our selected motor, the Planetary Metal Geared Motor (PD264M) outputs
76.375 lb-in of torque, which is overcomes our needed propulsion torque of 14 lb-in up
the steepest incline as derived later in this report. Because our wheel radius is 1 inch,
33. Group #1 6/14/2013
23
our outputted torque will be that provided by the motor. The coupler attaches the
wheels to the gear shaft. Furthermore, the support bars will structurally strength our
motor placement.
Figure 25: Exploded View of Drive Train
Requirements
This is our most important subsystem because it is the physical system that propels our
robot up the track. Our requirements include the ability to run fast enough in order to
achieve our round-trip time of 136.1 seconds for at least one trip and accommodate our
maximum velocity. The subsystem must also be able to overcome friction and gravity
forces to propel our system up the ramp in an efficient manner. Lastly, because our
robot must be able to turn around the system must be capable of making a 180 degree
turn.
34. Group #1 6/14/2013
24
IV. DESIGN ANALYSIS
After narrowing down a large selection of materials for our wheels, we decided on using rubber
for our front and rear wheels to achieve the friction coefficient we desire. We found that our
friction coefficient ( ) is 0.5 [7] and our rolling friction coefficient (μrol) to be around 0.01 [8].
These values will satisfy the minimum friction coefficient needed to sustain our robot up the
ramp. Further explanation will be provided on the next few pages. On the next page is the
comparison of the minimum friction coefficients if our robot was an all-wheel drive, a front-
wheel drive, or a rear-wheel drive.
One formula used in the analysis is provided below [2]:
( )( )
(1)
This formula gives us a useful insight on the minimum coefficient of friction needed to sustain
our robot. All formulas regarding the minimum friction coefficient, normal and traction forces
are derived in the Appendix along with the corresponding free body diagram. For the all-wheel
drive, we set = 1 and = 1, for the front-wheel drive, we set = 1 and = 0, and for the
rear-wheel drive, we set = 0 and = 1. Provided on below are the values of the parameters
used in the calculations as well as the final minimum friction coefficient values based on this
procedure for both cases in which there is no load and a full load:
Table 1: Parameters used in friction coefficient calculation with and without load
Parameter Without Load With Load
Wheel Base Length (L) 5.84 in 5.84 in
CG from rear wheels (LC) 3.19 in 2.00 in
CG height from ground (h) 5.13 in 7.23 in
S p s Ang of R mp (θ) 14.036° 14.036°
Table 2: Drive Systems and their respective friction coefficients with and without load
Type of Drive System Minimum Coefficient of
Friction without Load
Minimum Coefficient of
Friction with Load
All-Wheel Drive 0.250 0.250
Front-Wheel Drive 0.765 7.583
Rear-Wheel Drive 0.371 0.258
In our analysis of choosing the wheel material, we used Table 2 as a guideline, being sure to
select material that had a higher friction coefficient with plywood than the values above. This
also helped us narrow our selection of which drive system would be best for our design. Since
front-wheel drive required a large friction coefficient greater than 1.0, we concluded that front-
wheel drive was not feasible, so we eliminated this type of drive system from our list of possible
ones.
Another useful way that might be of interest is showing a plot of minimum friction coefficient
vs. LC. This analysis helps with deciding where to place our center of gravity to minimize how
35. Group #1 6/14/2013
25
much friction each wheel needs. Provided below are the formulas as functions of LC used for
the graph.
All-Wheel Drive:
(2)
Front-Wheel Drive:
(3)
Rear-Wheel Drive:
(4)
Values for L, h, and θ are fixed values for this analysis, while we vary LC. Figures 26 and 27 are
the minimum friction coefficient comparison charts for the type of drive systems when the
transporter is without the load and when it is with a full load, respectively.
Figure 26: Friction Coefficient Comparison Chart without Load
-3
-2
-1
0
1
2
3
2 3 4 5 6 7 8
FrictionCoefficent
Center of gravity horizontal distance from rear wheels (in)
Minimum Required Friction Coefficient
Without Load
AWD
FWD
RWD
36. Group #1 6/14/2013
26
Figure 27: Friction Coefficient Comparison Chart with Full Load
Through observation of the plots, we see that they are very similar. This is due to the fact that
only h in the formulas on the previous page is different, which just shifts the graph by a small
amount. From both plots, we see that for equal rear-wheel drive and front-wheel drive friction
coefficients, we get a value of about 0.5 at a center of gravity distance of about 4.1 inches from
the rear wheel. These plots also show that front-wheel drive is not feasible due to the fact that
it requires large friction coefficients if we were to concentrate most of our weight towards the
back. Thus, confirming our previous conclusion. In addition, due to the complications of an all-
wheel drive, we find that the rear-wheel drive system is best for our robot design. From there,
we were able to choose a wheel material whose friction coefficient with plywood is greater
than that of the minimum for a rear-wheel drive system.
Moving forward with the calculations, we now can calculate the normal force between the
wheels and the ground. The front wheel and rear wheel normal forces are given by:
(5)
( )
(6)
From here, we can calculate the maximum traction forces before slip on both the front wheels
and rear wheels to find the total traction force on our robot’s wheels. The formulas used to
calculate the traction force is given by:
(7), (8)
(9)
Below are Table 3 and Table 4 showing the parameters used to calculate the traction forces for
our rear-wheel drive concept without and with the load.
-3
-2
-1
0
1
2
3
2 3 4 5 6 7 8
FrictionCoefficent
Center of gravity horizontal distance from rear wheels (in)
Minimum Required Friction Coefficient With
Load
AWD
FWD
RWD
37. Group #1 6/14/2013
27
Table 3: Normal and Traction Forces without Load
Wheel (front/rear) Normal Force Traction Force
(μ=0.5)
Front Wheel 5.406 lbf 2.703 lbf
Rear Wheel 11.145 lbf 5.572 lbf
Total 16.551 lbf 8.275 lbf
Table 4: Normal and Traction Forces with Full Load
Wheel (front/rear) Normal Force Traction Force
(μ=0.5)
Front Wheel 1.594 lbf 0.797 lbf
Rear Wheel 46.749 lbf 23.374 lbf
Total 48.343 lbf 24.171 lbf
When the transporter is not loaded, the force of gravity acting along the slope for the steepest
angle (θ = 14.036°) is calculated as follows:
(10)
( ) ( )
Likewise, when the transporter is fully loaded, the force of gravity acting along the steepest
slope is calculated using the same equation above:
(11)
( ) ( )
To conclude, when the transporter robot is unloaded, the force of gravity due to the steepest
part of the ramp is 4.138 lbf, which is means that:
(12)
So our robot will be able to climb the ramp when unloaded. Similarly, the force of gravity due
to the steepest part of the ramp when fully loaded is 12.085 lbf, which leads to the same
conclusion that . Thus, our transporter robot will be able to climb up the ramp
with a full load.
Figure 59 from the Appendix is used as a reference when applying the equations later on in this
section. In the figure, the traction force, Ft, is facing up the ramp. This is the case when the
robot is going up the ramp, and the direction is reversed when the robot is going down it.
The following equations are used to calculate the weight fractions, Βf and Βr, and are shown and
derived in [2].
Bf = (13)
Bf =
( )
(14)
38. Group #1 6/14/2013
28
The following table contains the parameters used to determine the weight distribution between
the wheels.
Table 5: Center of mass lengths for loaded and unloaded cases (g = 386.088 in/s2
)
Robot w/ Disks Robot w/o Disks
L (in) 5.84 5.84
Lc (in) 1.34 3.17
L – Lc (in) 4.50 2.67
h (in) 7.14 5.12
2r (in) (drive wheel diameter) 2.00 2.00
m (lbm) 1.55 0.53
mg (lb) 49.83 17.06
The weight fractions, Βf and Βr, are shown in the following table for each section during
the trip up and the trip down.
Table 6: Weight Fraction Tables
A B C D E F G
Βf (%) going up 19.40 34.25 34.25 34.25 6.18 34.25 34.25
Βr (%)going up 80.60 65.75 65.75 65.75 93.82 65.75 65.75
Βf (%)going down 43.31 54.62 54.62 54.62 31.69 54.62 54.62
Βr (%)going down 56.69 45.38 45.38 45.38 68.31 45.38 45.38
Estimation of Required Propulsion Torque and Geared Motor Output Torque:
ainertia is calculated using the same set of assumptions used to calculate the times for each
section, which is shown in the set of equations above the velocity profile in part a. Since
the velocity profile for each section is linear, the acceleration ainertia for the robot traveling
up the ramp is calculated using the equation:
ainertia = (vfinal - vinitial)/t (15)
When the robot is travelling down the ramp, we apply the modified equation below:
ainertia = - (vfinal - vinitial)/t (16)
We apply this equation because our notation for the velocities travelling down the ramp is
to assign negative values for when the robot is travelling back to the starting point in order
to be consistent with the velocity profile notation (negative velocity values when moving
back to starting point). The values for vfinal, vinitial, and t areshown in table 7 below. The
calculated values for ainertia are shown in the following table below:
Table 7: Inertial accelerations for each section
Section vinitial (in/s) vfinal (in/s) t (s) ainertia (in/s2
)
Going Up
A 0.000 4.000 24.00 0.167
B 4.000 4.000 7.461 0.000
C 4.000 6.000 5.333 0.375
39. Group #1 6/14/2013
29
D 6.000 6.000 4.974 0.000
E 6.000 6.000 5.333 0.000
F 6.000 2.500 9.948 -0.352
G 2.500 0.000 11.20 -0.223
Going Down
G 0.000 -4.000 7.000 0.571
F -4.000 -6.000 9.948 0.201
E -6.000 -8.000 4.000 0.500
D -8.000 -9.500 6.283 0.239
C -9.500 -7.500 4.266 -0.469
B -7.500 -5.500 7.958 -0.251
A -5.500 0.000 17.45 -0.315
Required/Propulsion Force (Freq = FPropulsion/ ε):
Freq = Finertia + FW + Frol (17)
This equation assumes that the robot has overcome the static friction term, given by μf
mgcosθ, so that is not included in the Freq calculations. The friction term is still included
in the next table for reference purposes. The above equation can be substituted as: Freq
= mainertia + mgsinθ + μrmgcosθ. The required force from the motors to propel the robot
is dependent on the motor efficiency and is:
Freq = (mainertia + mgsinθ + μr mgcosθ)/ ε (18)
The required force from the motors needed to drive the robot through each section for
up and down cases is shown in the following table.
Table 8: Propulsion Force for each Section: (m = 1.856 lbm, ε = 0.90 [9], μr = 0.01 and μf= 0.50)
Section mainerta (lbf) μrmg osθ
(lbf)
mgs nθ ( bf) μfmg osθ
(lbf)
Freq (lbf)
Going Up
A 0.258 0.495 6.181 24.723 7.704
B 0.000 0.498 0.000 24.915 0.553
C 0.581 0.498 0.000 24.915 1.199
D 0.000 0.498 0.000 24.915 0.553
E 0.000 0.483 12.086 24.171 13.966
F -0.545 0.498 0.000 24.915 -0.052
G -0.303 0.498 0.000 24.915 0.217
Going Down
G 0.303 0.171 0.000 8.530 0.527
F 0.107 0.171 0.000 8.530 0.309
E 0.265 0.166 4.138 8.275 5.077
D 0.127 0.171 0.000 8.530 0.331
C -0.249 0.171 0.000 8.530 -.087
B -0.133 0.171 0.000 8.530 0.042
A -0.167 0.169 2.116 8.464 2.353
40. Group #1 6/14/2013
30
Observing the table values, the robot does not require a lot of propulsion force for the
non-inclined sections. For the inclined sections, it would require more because the
weight force, FW, has non-zero components along the inclined ramp. In addition, for
section F going up the ramp, and section C going down the ramp, the Freq is negative.
This indicates that in order to get the decreased velocities at the target values for those
sections, the motors must effectively ‘brake’ or apply a torque in the opposite direction
to help decrease it enough in the target time frame.
Total Propulsion Torque (Treq )
Treq = Freq x RDriveWheel (19)
Table 9: Required propulsion torque for each section (RDriveWheel = 1.00 in)
Section Freq (lbf) Treq (lb*in)
Going Up
A 7.704 7.704
B 0.553 0.553
C 1.199 1.199
D 0.553 0.553
E 13.966 13.966
F -0.052 -0.052
G 0.217 0.217
Going Down
G 0.527 0.527
F 0.309 0.309
E 5.077 5.077
D 0.331 0.331
C -.087 -.087
B 0.042 0.042
A 2.353 2.353
I. Torque calculations
From our required torque and wheel radius we found a motor that matches our needed
specifications. To begin our iteration we needed a motor selected to determine the
exact center of gravity, weight, and several other parameters that would contribute to a
motor selection. To circumvent this we considered that the majority of force needed to
propel our robot will be due to weight. Because the weight of the motor is negligible
compared to the rest of our robot we continued our first iteration neglecting the weight
of the component. Our torque requirement is the torque to propel our robot with its
maximum load up the steepest slope which is coincidently where the maximum torque
is needed. This is observed in path E of the track as designated in this report. Hence we
need a motor that is strong enough to output 11.859 lb-in of torque, on a wheel of 1
41. Group #1 6/14/2013
31
inch radius, plus more to account for other factors including friction and the torque of
the drive system. Eventually our motor selection is enough to overcome the actual
propulsion torque of 13.966lb-in.
Table 10: Force and Torque Needed per Path Due to Weight (Forward)
Path A B C D E F G
Force w/
load
6.065 0.000 0.000 0.000 11.859 0.000 0.000
Torque
w/ load
6.065 0.000 0.000 0.000 11.859 0.000 0.000
Our maximum velocity is 6in/s and dividing this by our wheel circumference we find our
required motor revolutions per minute are 57.3RPM.
Our maximum velocity is 6in/s and dividing this by our wheel circumference we find our
required motor revolutions per minute are 57.3RPM. Hence we decided to use the Gear
Head Motor (GHM-13) from Lynxmotion [10]. Below are the specifications provided by
the manufacturer:
Table 11: Motor Specifications
Type: PK32KD3B2100-051
Model: PK32KD3B2100-051
Voltage Operation Range: 6-12VDC
Rated Voltage: 12VDC
Rated Load 12VDC: 15 Kg-cm = 13.02
lb-in
Stall Torque: 88 kg-cm = 76.375 lb-in
No Load Speed 12VDC: 188RPM +/- 19
Speed at Rated Load: 163RPM +/- 16
No Load Current 12VDC: < 850mA
Current at Rated Load: <5.0A
Outside Diameter = 36mm =1.42in
42. Group #1 6/14/2013
32
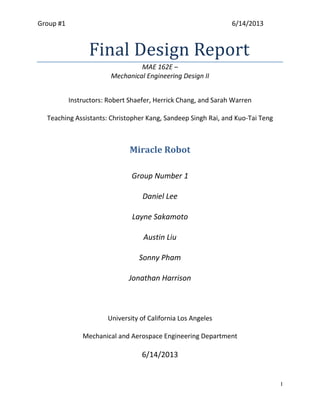
Figure 28: Motor Performance Curves
From selecting this motor we modeled this into our 3D drawing and used the overall
model to calculate our propulsion force and propulsion torque that was described
previously. We found this motor to satisfy the necessary torque conditions.
We will be using our motors in a direct drive system and hence our drive torque is the
direct torque from our motors. Our drive torque at 94RPM will be 76.375 lb-in per
motor. Hence our total drive torque is this value multiplied by 2:
Drive Torque =
The output torque is compared to the required propulsion torque for each section in the
table below:
Table 12: Drive torque and required torque comparison table
Section TDrive (lb*in) Treq (lb*in) TDrive > Treq
(Y/N)
Going Up
A 152.75 7.704 Y
B 152.75 0.553 Y
C 152.75 1.199 Y
D 152.75 0.553 Y
E 152.75 13.966 Y
F 152.75 -0.052 Y
G 152.75 0.217 Y
-10
0
10
20
30
40
50
60
70
80
90
0
50
100
150
200
250
300
350
400
0 50 100 150 200
Power(lb-in-RPM)
RPM
Motor Performance
Power (Lb-in-RPM)
Torque (lb-in)
Optimum Performance
at 94RPM
152.75 lb-in.
43. Group #1 6/14/2013
33
Going Down
G 152.75 0.527 Y
F 152.75 0.309 Y
E 152.75 5.077 Y
D 152.75 0.331 Y
C 152.75 -.087 Y
B 152.75 0.042 Y
A 152.75 2.353 Y
As seen from the table above, for every section, the output torque is greater than the
required propulsion torque. This indicates that the selected motor is capable of
supplying the necessary torque to drive the robot for this ramp.
Our system is a direct drive system so our required torque to overcome the motor
mechanisms and the friction torque is calculated with the equations below:
( ) (20)
( ) ( ) (21)
( ) ( ) (22)
(23)
Where Jt is the total torque required which is equivalent to the sum of the load torque
and the motor torque. αacc is dependent on the portion of the track the robot is trekking.
The weights and radii for the shaft and wheel are as listed:
Table 13: Wheel and Motor Dimensions
Below are the tables listing the forces and torques required on both the trip forward
and back.
Table 14: Torque Required per Track Path (Forward)
Path A B C D E F G
Force Friction (lbf) 0.4945 0.4983 0.4983 0.4983 0.4834 0.4983 0.4983
Torque Friction
(lb-in) 0.4945 0.4983 0.4983 0.4983 0.4834 0.4983 0.4983
alpha (rads/s^2) 0.167 0.000 0.375 0.000 0.000 -0.352 -0.223
Total Torque
Motor
(lb-in)
1.95E-
05 0
4.39E-
05 0 0 -4.1E-05 -2.6E-05
Wheel Radius (in) 1.000
Wheel Mass (lb) 0.090
Shaft Radius (in) 0.236
Mass Shaft (lb) 0.005
g (in/s^2) 386.000
44. Group #1 6/14/2013
34
Torque Required
(lb-in) 0.5494 0.5537 0.5537 0.5536 0.5371 0.5536 0.5536
Table 15: Torque Required per Track Path (Back)
Path G F E D C B A
Force Friction (lbf) 0.1706 0.1706 0.1655 0.1706 0.1706 0.1706 0.1693
Torque Friction
(lb-in) 0.1706 0.1706 0.1655 0.1706 0.1706 0.1706 0.1693
alpha (rads/s^2) -0.5714 -0.201 -0.5 -0.2387 0.4688 0.2513 0.3151
Total Torque
Motor
(lb-in) -6.7E-05 -2.3E-05 -5.8E-05 -2.8E-05 5.5E-05
2.95E-
05 3.7E-05
Torque Required
motor (lb-in) 0.1894 0.1895 0.1838 0.1895 0.1896 0.1895 0.1881
From Table 7 we can see where the highest accelerations are, but because the friction
torque is 3 times the magnitude of our total drive torque we can estimate the location
of our maximum required torques. From the values given in table 14 we find a Treq_motor
= 0.5537lb-in at part C of our track for the forward direction. For our backwards
direction we use the motor to decelerate and for this the greatest required torque on
the trip back is Treq_motor = 0.171lb-in which is negligibly higher than on out forward trip.
This puts the maximum accelerating torque that our robot needs at Treq_motor + Tprop =
14.520lb-in.
II. Unloading mechanisms
For the unloading mechanism, we are going to use motorized force gate. We are going
to have one servo motors to unlock and relock the gate. The servo motor will be located
at the bottom of the carrier. It will be connected to the force gate, which is used to hold
the disk from falling. For our particular unloading mechanism, we first have to know the
required force and torque to make this mechanism valid.
The servo motor that is located at the center bottom is connected to the carrier bottom
surface through four bar linkage system. This allows more efficiency on generating the
movement of the force gate through the motor. Once the robot reaches the unloading
zone, the two push button sensors on the back of the robot will inform the motor to pull
down the force gate which barely requires any force due to preexisting force caused by
the weight of the disk. After unloading the disk, certain amount of force is required to
pull up the force gate to its original position. The following figure shows the free body
diagram after unloading disks.
45. Group #1 6/14/2013
35
Figure 29: Free body diagram for forced gate after unloading disks
In order to reach the equilibrium the force acting in the vertical direction should add up
to be zero.
Fvertical = Freqcosθ +mg = 0 (24)
When the gate is at the equilibrium position, that means it will move with constant
velocity but since the gate is starting from the static position, we have to apply a
stronger force in order to initiate the movement. The equation is given by:
Freqcosθ mg (25)
We were able to obtain values for the weight and angle θ using SolidWorks. Since the
weight of the gate is 0.11 lb and angle θ is 8.13 degree, the minimum force required is
0.112 lb. This result is as predicted since the θ value is relatively small.
The following equation is the equation for the torque calculation.
(26)
The r value is also obtained through the measurement tool in SolidWorks. Since the r
value is 1.56 inch and force required is 0.112 lb, the torque required for the forced gate
is 0.173 lb-in.
After knowing the force and torque requirement to activate the gate system, we also
have to confirm that we have enough energy for the disk to move a certain amount of
distance to reach to loading zone. In the case where the given energy is not sufficient
enough to satisfy the distance requirement, we have to come up with some sub-system
to achieve our goal.
θ
Initial
position
h
46. Group #1 6/14/2013
36
Figure 30: Disk rolling down the slope
The first procedure is to calculate the amount of energy we have at the beginning of
unloading procedure. If we neglect minor energy that is induced, such as thermal,
chemical…etc, we are left with two major energy types which are potential and kinetic.
The following equation demonstrates the relationship between kinetic energy and
potential energy.
(27)
In the beginning of the unloading procedure, there are no movements generated
through disks. This implies that the kinetic energy in the beginning is zero so the total
energy in the beginning is the potential energy. The major factor that determines the
potential energy for our particular case is gravity and we can calculate the total energy
using the following equation.
(28)
As disks goes down the slope, total energy which is only potential energy gets
transferred in to kinetic energy. When it reaches the bottom surface, all of the potential
energy is transferred to kinetic energy. In other words, kinetic energy equals the
potential energy of the beginning height when it gets to the bottom surface.
(29)
From the equation above, we can calculate the velocity of the disk when it gets to the
bottom. If we set two equations equal to each other, we can derive an equation for the
velocity of disks.
√ (30)
For our case, height is 0.065 ft and g is 32.2ft/s2
so we can calculate our velocity to be
2.05ft/s2
. The y component of the velocity can be calculated to be -0.29 ft/s2
with θ =
8.13o
.
(31)
The distance down to the edge of the box is 0.718 ft. By using the next equation, we can
figure out the time it takes for the disk to get to its final position, which is about 2.02 s.
(32)
If we go through the similar procedure using:
(33)
(34)
We can calculate the horizontal displacement which turns out to be approximately
0.41ft. This displacement is sufficiently large enough to fulfill the unloading procedure
so we can conclude that we don’t need any extra subsystem. For our particular
unloading mechanism, we only need one servo motor to control the force gate and the
required force and torque values are 0.112 lbf and 0.173lb-in. Since the initial potential
energy is sufficient enough to fulfill require horizontal displacement, we don’t need any
additional subsystems.
With this requirement we chose the following servo motor:
47. Group #1 6/14/2013
37
Table 16: HD High-torque Servo Specifications
HD High-Torque Servo 1501MG
Size 1.6 x 0.81 x 9.43 in
Weight 0.13 lb
Speed @ 6V: 0.14 sec/60°
Stall torque @ 6V: 14.76 lb-in
Speed @ 4.8V: 0.16 sec/60°
Stall torque @ 4.8V: 13.45 lb-in
Our servo motor’s stall torque at both voltages greatly exceeds that which we require.
48. Group #1 6/14/2013
38
V. CONTROL SYSTEM DESIGN
I. Motor Selection from Torque Calculations
From our calculations we needed at least 640 oz-in to carry a maximum load of 6 discs
and preferably a high enough RPM to have a 180 second trip. Our chosen motor, the Planetary
Metal Geared Motor PD264M which provides 3471 oz-in of torque at a stall current of 35.0A.
This motor goes well with our new driver because the maximum current on our driver per
channel is 50.0A. In this respect, we know that our motor will not cause a current surge that
would destroy our motor driver.
Figure 31: Motor Circuit Diagram
II. Unloading Mechanisms
Our unloading mechanism uses a four-bar toggle mechanism to make use of a smaller
and cheaper servo. We are using one parallax standard servo to control our mechanism.
Essentially, we have our four-bar mechanism attached to a small gate on a sloped ramp. The
four-bar pushes the linkages into a linear position when the gate is up and when this occurs, all
of the force from the weight of the discs act long that collinear path. This takes the entire load
49. Group #1 6/14/2013
39
off of the servo and allows us to have a smaller servo. At the beginning of the track, the
mechanism will erect the gate up for someone to place the load on top. Then at the end of the
track, the servo will retract the linkages and allow the gate to fall down. This allows the discs to
roll off the ramp into the box. As a small modification, we added an extension to the ramp to
ensure that our load overcomes the 3 inch gap between the ramp and the box.
III. Sensors and Theory of Operations
Our robot has 6 sensors: 3 ultrasonic sensors and 3 home-made push buttons. We use
HC-SR04 ultrasonic sensors to navigate our robot through the track and adjust it during turns.
The sensors are well apt for use in our range between 2cm to 20cm. Our push-buttons are
homemade from a broken keyboard. We took advantage of our spare parts and the fact that
there is an aluminum connection in the keys. After modifying the keys, a connection is
completed whenever the button is pushed down and this applies 5V across our SB-RIO pin. We
use this as a true and false Boolean. These push buttons are used for unloading and loading
purposes.
For our navigation we used the ultrasonic sensors. At first when the robot is in the
starting box, it will read that the sum of the left and right sensors reading the side walls will be
greater than 20cm which tells the robot to follow this portion of the track at 12cm away from
the left wall. Once the robot reaches the actual track which is narrower, the sum of the distance
to the two walls will be under 20 and the robot will follow the left wall at 6cm away from the
wall. This wall following applies all the way up the track. Whenever the left sensor reading is
below 11 it will cause the motors to adjust so the robot will turn slightly to the right. When this
reading is above 13 the robot will turn slightly to the left.
As a precaution, we added a feature in which when the left sensor is reading below 4cm,
the right wheel will completely stop and the left wheel will continue to turn allowing the robot
to make a very sharp turn. This is useful if the robot cannot adjust fast enough to turn away
from the wall. This also avoids collisions with the wall.
Once the front sensor reads the wall by the unloading area at 2cm, the robot will back
up and complete a 180 degree turn. During this 180 turn the left sensor is used to adjust by
backing up whenever the sensor reads 2cm or below. Doing this allows for a tighter 180 turn
and prevents collision with the wall if the robot is too close to the left all before it starts turning.
Once a counter runs out, we will know that the robot has turned 180 degrees and the robot will
begin backing up into the wall.
Both wheels will go in reverse at the same speed. The 2 push buttons on the back of the
vehicle are essentially stop buttons for each motor. Once the robot hits the wall and the
buttons are pushed, the Boolean that both buttons are pushed tells the unloading mechanism
to drop and allow our discs to roll off the ramp into the unloading area. After a short time, the
gate will lift itself up and the robot follows down the track using the left sensor again.
At the end of the track, in the starting area, the right sensor is used with the left sensor
to tell that the sum of the distances measured to the two walls is greater than 20cm. This
correlates again with being in the starting area which tells the robot to follow at a distance of
12cm rather than 6cm with the left sensor. Once the front sensor is within 2cm of the starting
edge wall, another 180 degree turn is completed.
50. Group #1 6/14/2013
40
The robot is now ready for a second run and it is initiated once our last push button
sensor, on the loading ramp, is pushed down by the weight of our lead discs. Once this Boolean
is true, the robot sets off on another run through the entire cycle.
We have noticed issues with both sensors. Although the ultrasonic sensors give us the
flexibility of setting Booleans correlating to varying distances, the sensors are more complicated
and fragile. We have run into problems with the sensor readings and the physical integrity of
the ultrasonic sensors which is a disadvantage. If our reading spikes then we can have logical
issues in our programming if it is not accounted for. If our robot runs into a wall for some
reason, this could damage the sensor physically. A push button has the advantage that it is very
simple and is meant for physical contact so it holds those advantages. The disadvantage is that
there is a lack of flexibility because it must make contact with something in order to trigger the
Boolean. We have also had some connection issues because our buttons are homemade.
Figure 32: Sensor and Servo Circuit Diagram
IV. State Diagrams
The interface between the LabVIEW programming and the actions performed by the
electronic systems is the Sb-RIO. The Sb-RIO is wired to the ultrasonic proximity sensors, the
positional servo, the motor controller, and the contact sensors. The Sb-RIO takes in analog
voltage inputs from the ultrasonic proximity sensors and the readings are converted to distance
51. Group #1 6/14/2013
41
in cm to use for convenience. The positional servo takes a PWM high and low in order to
position itself. The PWM high and low values used are: 25000 for PWM high, 585 for PWM low
for lifted gate, and 1010 for PWM low for dropped gate. The motor controller accepts analog
outputs from 0 to 5 V from the Sb-RIO to control the motors. 0 V corresponds to full reverse for
a wheel, 2.5 V corresponds to stop for a wheel, and 5 V corresponds to full forward for a wheel,
and the Sb-RIO outputs two values since the motor controller can set two motors. The three
contact sensors are digital inputs that are sent to the SB-RIO and send 0 V for false case and 3.3
V for true case.
The robot programming was entirely performed in LabVIEW. We used the skeletal code
provided as the interface between the FPGA and the SB-Rio on the robot. In the appendix, the
front panel and block diagram of the main code are screen-shotted. In the figure below, the
screenshot of the LabVIEW statechart diagram is included. The two main states are:
demonstration code and testing code.
Figure 33: LabVIEW Statechart Diagram for Whole Demonstration Code & Testing Code
52. Group #1 6/14/2013
42
The figure below shows the state diagram for transitioning between the demonstration and
testing code. Demonstration code includes all of the states and sub-states that are used to give
output commands to the FPGA during the actual demonstration run of the robot. To transition
to the testing code, BR 2 on the SB-Rio is pressed to enter the testing code state. In testing code
state, the robot is in standby and the force gate can be lifted or closed by pressing BR 3 or BR 4.
To transition to the start of the demonstration code, BR 1 is pressed.
Figure 34: State Diagram between Demonstration Code and Testing Code
The figure below shows the simplified state diagram with the state transitions for the
demonstration code state. When the code is run, the statechart begins at the start of the
demonstration code. The demonstration code runs as follows: a PWM signal is sent to the servo
in order to lift the force gate. Once the gate is in the lifted position, the robot is able to carry
discs. The robot remains in standby until the force sensor is pressed by the weight of the discs.
Then the robot will wall follow up the ramp in the starting area using the left sensor. The sum of
the left and right sensors is used to determine whether or not the robot is in the starting area
or the 16’’ wide ramp area. If the sum is greater than 34 cm, then the robot assumes that it is
still wall following in the starting area at a greater distance from the left wall. If the sum is less
than 34, then the robot will wall follow at a lesser distance that is appropriate for the thinner
walls. The robot will wall follow up the ramp including for the turns and its wall-following state
diagram is shown later on. Once the robot wall follows to the top of the ramp, it will turn
around left for 1800
when the front sensor reading is 8 cm or less. The 1800
turn is in a
countered loop that remains in the state and performs the turn until the counter reaches a
certain value. We assume that the loop executes at the same time as the main loop, which is
once per 60 ms. If we want to perform the turn for 2.4 seconds and increment the loop counter
once per cycle, then the turn is finished once the loop counter reaches 40. Once the robot has
finished turning 1800
, it moves in reverse to the edge of the ramp to prepare for unloading the
disks. The robot continues moving in reverse until both the left and right rear contact sensors
are pressed, which stops the corresponding motor. Once both motors are stopped due to both
contact sensors being pressed, a PWM signal to the servo drops the force gate and allows the
disks to roll out and into the unloading bin. After a countered standby loop that lasts for 1.5
seconds, the robot uses the left sensor to wall follow down the ramp using the same method as
going up the ramp. Using the sum of the left and right sensors, the robot will wall follow at the
53. Group #1 6/14/2013
43
starting area distance if the sum is greater than 34 cm or wall follow at the ramp wall distance if
the sum is less than 34 cm. Once the front sensor reads 8 cm or less when wall following, the
robot will turn in a countered loop for 2.0 seconds to re-orient itself to go up the ramp and start
the demonstration code loop from the beginning in the starting area.
Figure 35: Demonstration Code Statechart Diagram
54. Group #1 6/14/2013
44
The figure below shows the state diagram for the testing code state. In testing code state, the
robot starts in standby, where all counters are stopped and the motors are turned off. The
unloading mechanism can be tested by pressing BR 3 to lift the gate and BR 4 to drop it.
Figure 36: Testing Code Statechart Diagram
The figure below shows the ‘wall following going up the ramp in the starting area’ sub-
statechart diagram. The robot starts in the move forward state and it maintains 18 cm from the
left wall based on the left sensor reading. If the left sensor reading is 19 cm or greater, the
robot turns to the left wall by applying a differential to the wheels with the left motor velocity
less than the right motor velocity. The robot exits the turning state once the left sensor reading
is 18 cm. If the left sensor reading is 17 cm or less, the robot turns away from the left wall by
applying a differential with the left motor velocity greater than the right motor velocity. The
state ‘wall following down the ramp in the starting area’ uses the same wall following state
chart diagram.
Figure 37: Wall Follow Going Up Starting Area Sub-Statechart Diagram
55. Group #1 6/14/2013
45
Figure 38: Wall Follow Going Up Ramp Sub-Statechart Diagram
The figure above shows the ‘wall following going up the ramp in the ramp section’ sub-
statechart diagram. The robot starts in the move forward state and it maintains 12 cm from the
left wall based on the left sensor reading. If the left sensor reading is 13 cm or greater, the
robot turns to the left wall by applying a differential to the wheels with the left motor velocity
less than the right motor velocity. The robot exits the turning state once the left sensor reading
is 12 cm. For stronger turns, if the left sensor reads 16 cm or greater, an even greater
differential is applied. If the left sensor reading is 11 cm or less, the robot turns away from the
left wall by applying a differential with the left motor velocity greater than the right motor
velocity. For stronger turns, if the left sensor reads 6 cm or less, a greater differential is applied
to avoid the robot running into the walls. The state ‘wall following down the ramp in the ramp
section’ uses the same wall following state chart diagram.
The figure below shows the ‘Turn 1800
deg. In Counter Loop’ sub statechart diagram.
The demonstration code statechart enters this state when the front sensor outputs 8 cm or less
while it is wall following up the ramp. The robot will turn 1800
by applying a differential where
the left wheel is moving backwards at full speed and the right wheel is moving forwards at full
speed in a counter loop. The counter is initialized at zero when entering the state and it
increments by one every 60 ms. The code exits the ‘Turn 180o
deg In Counter Loop’ state once
the counter reaches 40. Also, the robot can move forwards and backwards to pivot itself in
order to avoid bumping into the walls during the turning. Since the robot turns to the left, if the
left sensor reads 5 cm or less, then it will back up until the reading is 8 cm. If the right sensor
56. Group #1 6/14/2013
46
reads 5 cm or less, then it will move forwards until the reading is 8 cm. This helps position the
robot so that it does not bump the walls during the turning. Also, when the robot is pivoting,
the counter does not increment. The ‘Turn 180o
in starting area’ state is identical to this state.
Figure 39: Turn 180o
deg. In Counter Loop Sub-Statechart Diagram
The figure below shows the ‘Move in Reverse to Edge of Ramp’ sub-statechart diagram. The
state begins in ‘Move Backwards’ and it can wall follow in reverse at 12 cm from the left wall in
order to help orient itself.When the robot reaches the edge of the ramp, when a contact sensor
is pressed, it will turn off that motor and pivot on that wheel until the other contact sensor is
pressed and both motors are turned off. Once both buttons are pressed, the robot exits the
state.
Figure 40: Move in Reverse to Edge of Ramp Sub-Statechart Diagram
57. Group #1 6/14/2013
47
VI. PRODUCT FABRICATION
I. Machining of Selected Parts
Provided in this section are details regarding our manufacturing of a select few parts and
the assembly of our robot. Also included are some complications that we encountered in
our design.
Section Wall:
Figure 41: Section wall CAD drawing (top), Section wall finished piece (bottom)
The section wall was fabricated using the mill and band saw. Also, since our design
contained two section walls, both were made simultaneously. First, we cut two pieces
aluminum to around the outer dimensions indicated on the engineering drawing. Then, we
clamped the two pieces together and used the mill to square the aluminum to the right
dimensions. Then using the edge finder, the holes were drilled in the positions indicated.
Once this had been completed, we cut the bottom opening using a band saw to around the
specified dimensions and used the mill to achieve the exact dimensions. Then, the edge
finder was used to make the slot. Then using a ½ inch bit, the slot was cut out.
58. Group #1 6/14/2013
48
Motor Mount:
Figure 42: Motor mount CAD drawing (top), Motor mount finished piece (bottom)
The motor mount was actually modified from its original design. This was mainly due to
making the machining easier. Since the purpose of the motor mount was to prevent the
shaft of the motor from having a bending torque, our new design was sufficient. The motor
mount was fabricated using the band saw, mill, and a hand tap. Since our design required
two motor mounts, both were made simultaneously. First, the two aluminum pieces were
cut to the approximate size according to the outer dimensions on the engineering drawing.
Then the pieces were clamped and put onto the mill. The mill was used to square the
aluminum pieces to exact dimensions. Then, the pieces were separated and the “U-shape”
was cut out using the band saw. Once again, the pieces were clamped back together and
the cut surface was milled to the exact dimensions. Once the outline of the motor mount
has been milled, we drilled the two holes to the exact locations using the edge finder. Then,
the hand tap was used to tap the two holes. We also eventually chose to round off the
corners with the belt sander to avoid getting cut.
Ramp Extender:
59. Group #1 6/14/2013
49
Figure 43: Ramp Extender
This part was not originally in our design. This part was made because the lead disks did not
clear the receiving bin using our original design. This was made using a jigsaw and a hand
drill. First, an aluminum piece was cut to size using a jigsaw. Then a hand drill was used to
make four #10-24 holes; two on each side. Finally, a jigsaw was used to connect the holes
on each side to make a slot. This allowed for easy sliding of the ramp extender, so that we
could still follow the high level design requirements and clear the receiving bin.
II. Assembly
Our assembly consisted of multiple parts. Much of our holes were not tapped and, as a
result, we used bolts, lock washers, and nuts for many of the connections. The problem with
this was that we had a very hard time assembling it. This was due to the fact that it required
us to put our hands into hard to reach places to lock the screws in place. Connecting the SB-
RIO mount to the structural frame was the most difficult. Therefore, we made a
modification and decided to tap a hole, so that we could just attach it by simply screwing it
in.
In addition to difficulties involving nuts and bolts, the assembly had to be performed in a
specific manner. First, the U-channels and L-brackets had to be connected to make the
structural frame. This was followed by attaching the two casters to the bottom of the
structural frame. Then the motor mounting strip and servo/servo mount was assembled
onto the frame. Next, the motor was connected by screwing the motor mount onto the
motor mounting strip. Also, the rear shaft support piece was connected to the frame and
the motor to provide additional support, such that the motor was secure. The following
figure shows how the motors are attached.
60. Group #1 6/14/2013
50
Figure 44: Drive train subsystem showing the attachment of the motors
After the mounting the motor, the rear wheel and shaft coupler was assembled. The shaft
was actually press-fitted into the wheel using the press. The diameter of the shaft was
slightly larger than the wheel’s inner diameter, so that there would be a snug fit between
the two. This was feasible since the bore of the wheel was plastic. This allowed the plastic
to expand, such that the shaft could fit into the hole. The following figure shows the press-
fit.
Figure 45: Two views of the shaft coupler press-fitted into the rear wheel
From here, the disc carrier sub-assembly had to be made separately. This involved first
connecting each section base to the corresponding section wall and then putting two shafts
along with their corresponding links and pieces (i.e. force gate attachment). Once this was
done, the ramp was put on and screwed into the top of the section base. The ramp served
as the piece that connected the two section walls and section bases.
61. Group #1 6/14/2013
51
After the disc carrier assembly was assembled, the toggle mechanism could be connected.
This involved assembling the necessary shafts and links together to complete the unloading
mechanism. Also, washers were used to keep the links from sliding away from one another.
Furthermore, a piece was screwed into the links to keep the pins from falling out. Once the
unloading mechanism was assembled the disc carrier assembly was connected to the
structural frame using a connector piece. After the disc carrier assembly was attached, the
battery L-bracket mount could be put on. The reason this had to be put on after was
because it interferes with the hole that allows the connector piece to attach to the frame.
The following figure shows the attached unloading mechanism.
Figure 46: Side view of toggle mechanism used for unloading
Then the batteries were put into the robot. After this, the SB-RIO was connected to the
mount. Finally, the SB-RIO mount was screwed into the frame.
63. Group #1 6/14/2013
53
VII. PRODUCT TESTING AND EVALUATION
To test the product performance of the robot, we ran the demonstration code on the
demonstration ramp with five discs that are bolted through the middle (~ 31 lbs). For the
first three runs, the robot runs continuously without restarting the code. For the last three
runs, the code is re-run, but the motor battery and SB-RIO battery are not charged during
the intercession. The following table indicates the run times divided by section for each of
the six trials. Another run with three discs (load = ~ 19 lbs) is performed with three runs.
The run times for the second run are shown in the table 19 below. The error analysis for the
product run time sis performed using the following equations:
u = ∑ /n (35)
where u is the mean average, x is the sample time value and n is the total number of runs.
σ = √( ) ( ) ( ) )/n (36)
Where σ is the standard deviation of the sample, x1,x2…xn are the times for each run.
The relative error is calculated using the following equation:
Rel. error = Δ X/ X * 100 % (37)
Where = Δ X is the absolute difference in the time for each run from the mean time and X is
the time for a particular run. A sample error calculations table for six discs is shown in the
appendix section B under table 28. Based on the relative errors being less than 5 %, the
performance using five discs was reliable and did not significantly deviate with successive
runs.
Table 17: Miracle Robot Run-Times with Five Discs
Trial Up Time (s) Unloading Time (s) Down Time (s) Total Time (s)
1 37.6 5.5 35.0 78.1
2 38.0 5.6 35.0 78.6
3 38.0 6.0 35.5 79.5
4 37.5 5.5 33.0 76.0
5 38.5 6.0 35.0 79.5
6 38.0 6.0 36.0 80.0
The up, unloading, down, and total times for the run with five discs are shown in the
following figures. For the up times, the times did not differ significantly, however based on
the low correlation coefficient, R2
, there is no predictability for the time for successive runs.
The same is true for the unloading times, down times, and total run times.
64. Group #1 6/14/2013
54
Figure 48: Up times using five discs
Figure 49: Unloading Times using five discs
y = 0.0857x + 37.633
R²= 0.203
37.4
37.6
37.8
38
38.2
38.4
38.6
1 2 3 4 5 6
time(S)
RUN #
Up times for each run
y = 0.0914x + 5.4467
R²= 0.4389
5.4
5.5
5.6
5.7
5.8
5.9
6
6.1
1 2 3 4 5 6
time(s)
Run #
Unloading times for each run
65. Group #1 6/14/2013
55
Figure 50: Down times using five discs
Figure 51: Total times using five discs
Table 18: Miracle Robot Run-Times with Three Discs
Trial Up Time (s) Unloading Time (s) Down Time (s) Total Time (s)
1 37.0 5.5 35.5 78.0
2 38.0 5.5 35.0 78.5
3 38.0 6.0 35.5 79.5
The up, unloading, down, and total times for the run with three discs are shown in the
following figures. For the up times, the times did not differ significantly, however based on
the low correlation coefficient, R2
, there is no predictability for the time for successive runs.
y = 0.0714x + 34.667
R²= 0.0171
32.5
33
33.5
34
34.5
35
35.5
36
36.5
1 2 3 4 5 6
time(s)
Run #
Down times for each run
y = 0.2486x + 77.747
R²= 0.1021
75.5
76
76.5
77
77.5
78
78.5
79
79.5
80
80.5
1 2 3 4 5 6
time(s)
Run #
Total Run Times for each run
66. Group #1 6/14/2013
56
The same is true for the unloading times, down times, and total run times. Compared to
running with five disks, the run times are about the same because the mean complete run
time for three disks is: 78.7 seconds, which is very close to the mean complete ruin time for
five disks, 78.6 seconds, which is shown in table 28.
Figure 52: Up times using three discs
Figure 53: Unloading times using three discs
y = 0.5x + 36.667
R²= 0.75
36.8
37
37.2
37.4
37.6
37.8
38
38.2
38.4
1 1.5 2 2.5 3
time(s)
Run #
Up times for each run
y = 0.25x + 5.1667
R²= 0.75
5.3
5.4
5.5
5.6
5.7
5.8
5.9
6
6.1
1 1.5 2 2.5 3
time(s)
Run #
Unloading times for each run
67. Group #1 6/14/2013
57
Figure 54: Down times using three discs
Figure 55: Total times using three discs
y = 35.333
R²= 0
34.9
35
35.1
35.2
35.3
35.4
35.5
35.6
1 1.5 2 2.5 3
time(s)
Run #
Down times for each run
y = 0.75x + 77.167
R²= 0.9643
77.8
78
78.2
78.4
78.6
78.8
79
79.2
79.4
79.6
1 1.5 2 2.5 3
time(s)
Run #
Total times for each run