Daily Forex Technical Analysis Report - October 07, 2020
Paper Presentation 2.0
1.
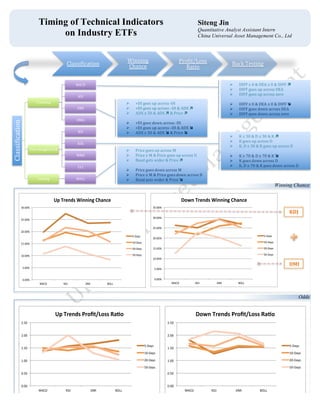
Timing of Technical Indicators
on Industry ETFs
Siteng Jin
Quantitative Analyst Assistant Intern
China Universal Asset Management Co., Ltd
Classi'ication
Winning
Chance
Pro'it/Loss
Ratio
Back
Testing
Classi'ication
Trending
MACD
ASI
DMI
DMA
Over
bought/sold
RSI
KDJ
W&R
CCI
routing
BOLL
Ø DIFF
≥
0
&
DEA
≥
0
&
DIFF
ì
Ø DIFF
goes
up
across
DEA
Ø DIFF
goes
up
across
zero
Ø DIFF
≤
0
&
DEA
≤
0
&
DIFF
î
Ø DIFF
goes
down
across
DEA
Ø DIFF
goes
down
across
zero
Ø +DI
goes
up
acorss
-‐DI
Ø +DI
goes
up
across
–DI
&
ADX
ì
Ø ADX
≥
50
&
ADX
ì
&
Price
ì
Ø +DI
goes
down
across
-‐DI
Ø +DI
goes
up
acorss
–DI
&
ADX
î
Ø ADX
≥
50
&
ADX
î
&
Price
î
Ø K
≤
30
&
D
≤
30
&
K
ì
Ø K
goes
up
across
D
Ø K,
D
≤
30
&
K
goes
up
across
D
Ø K
≥
70
&
D
≥
70
&
K
î
Ø K
goes
down
across
D
Ø K,
D
≥
70
&
K
goes
down
across
D
Ø Price
goes
up
across
M
Ø Price
≥
M
&
Price
goes
up
across
U
Ø Band
gets
wider
&
Price
ì
Ø Price
goes
down
across
M
Ø Price
≤
M
&
Price
goes
down
across
D
Ø Band
gets
wider
&
Price
î
0.00%$
5.00%$
10.00%$
15.00%$
20.00%$
25.00%$
30.00%$
MACD$ KDJ$ DMI$ BOLL$
Up#Trends#Winning#Chance#
53Days$
103Days$
203Days$
503Days$
0.00%$
5.00%$
10.00%$
15.00%$
20.00%$
25.00%$
30.00%$
35.00%$
MACD$ KDJ$ DMI$ BOLL$
Down%Trends%Winning%Chance%
53Days$
103Days$
203Days$
503Days$
KDJ
DMI
Winning Chance
Odds
0.00#
0.50#
1.00#
1.50#
2.00#
2.50#
MACD# KDJ# DMI# BOLL#
Up#Trends#Profit/Loss#Ra2o#
51Days#
101Days#
201Days#
501Days#
0.00#
0.50#
1.00#
1.50#
2.00#
2.50#
MACD# KDJ# DMI# BOLL#
Down%Trends%Profit/Loss%Ra2o%
51Days#
101Days#
201Days#
501Days#
2.
80%$
100%$
120%$
140%$
160%$
180%$
200%$
220%$
9/22/2011$ 1/22/2012$ 5/22/2012$ 9/22/2012$ 1/22/2013$ 5/22/2013$ 9/22/2013$ 1/22/2014$
Asset%
Pairs%Trading%Asset%Time%Series%
Energy$vs.Medicine$
Energy$vs.$Finance$
Energy$vs.$ConsumpAon$
0%#
1%#
2%#
3%#
4%#
5%#
6%#
*0.02# *0.01# 0# 0.03#
Return'
Return'Distribu,on'
Designed
a
Pairs
Trading
Strategy
on
Negative
Correlated
ETF
indexes
by
applying
technical
indicators
on
spread
ratio.
Define
Spread
Ratio
Index:
,where
μ
is
mean
of
s
and
σ
is
standard
deviation
of
s.
Start%
If%DMI%sends%Down0
Trend%Signal%on%s%
If%KDJ%sends%Up0
Trend%Signal%on%s%
If%exceeds%profit/
loss%control%
Clear%posi>on%
Long%0.5%Stock%1%
Short%0.5%Stock%2%
Short%0.5%Stock%1%
Long%0.5%Stock%2%
Update%Total%
Net%Asset%
Strategy Flow Chart
Trading
Rules
a. If
there
already
exists
a
same
position
as
the
signal
indicates,
do
nothing.
b. If
there
already
exists
an
opposite
position
as
the
signal
indicates,
clear
the
previous
position
and
enter
a
new
one.
c. Hold
equally
weighted
stock
pair
at
anytime
of
trading.
d. Transaction
Fee
=
0.05%
0"
0.05"
0.1"
0.15"
0.2"
0.25"
0.3"
0.35"
0.4"
0.45"
0.5"
)1" )0.5" 0" 0.5" 1"
Correlaruib*Debsurt*
Correla.ons*
Correla.on*Distribu.on*
Strong
Negative
Correlations
Loss
Control
Index Number+of+Trades Winning+Chance P/L+Ratio Max+Withdraw Final+Return+(Annulized) Return+Skewness Max+Return Max+Lost
Energy+vs.Medicine 412 21.61 49.27% 1.6445 R10.26% 26.16% 0.9039 3.71% R1.91%
Energy+vs.Finance 429 21.49 53.15% 1.5916 R9.90% 38.82% 0.7053 3.67% R1.66%
Energy+vs.Consumption 389 23.56 50.39% 1.5548 R8.43% 22.62% 0.7541 3.35% R1.78%
Average 410 22.22 50.94% 1.5970 R9.53% 29.20% 0.7878 3.58% R1.78%
Pairs+Trading+Statistics
Profit
Control