TORONTO REAL ESTATE BOARD's "RENTAL REPORT - Q2 2018"

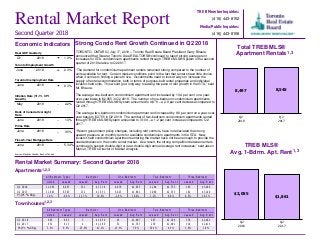
Toronto Real Estate Board President Garry Bhaura announced that Greater Toronto Area REALTORS® continued to report strong average rent increases for GTA condominium apartments rented through TREB’s MLS® System in the second quarter of 2018 relative to Q2 2017. “The demand for condominium apartment rentals remained strong compared to the number of units available for rent. Current market conditions point to the fact that renters have little choice when it comes to finding a place to live. Governments need to look at ways to increase the supply of rental accommodation, both in terms of purpose-built rental properties and individual investor-held units. This would go a long way to easing the pace of rent growth in the GTA,” said Mr. Bhaura. The average one-bedroom condominium apartment rent increased by 10.4 per cent on a year-over-year basis to $2,055 in Q2 2018. The number of one-bedroom condominium apartments rented through TREB’s MLS® System amounted to 4,879 – a 2.9 per cent decrease compared to Q2 2017. The average two-bedroom condominium apartment rent increased by 8.8 per cent on a year-over-year basis to $2,755 in Q2 2018. The number of two-bedroom condominium apartments rented through TREB’s MLS® System amounted to 3,104 – a 1.2 per cent increase compared to Q2 2017. “Recent government policy changes, including rent controls, have not alleviated the strong upward pressure on monthly rents for available condominium apartments in the GTA. New, investor-held condominium apartments entering the market have not been enough to provide the needed balance in the condo rental market. As a result, the strong competition between renters continues to sustain double-digit or near-double-digit annual average rent increases,” said Jason Mercer, TREB’s Director of Market Analysis.

Recommended
Recommended
More Related Content
More from Shawn Venasse
More from Shawn Venasse (20)
Recently uploaded
Recently uploaded (20)
TORONTO REAL ESTATE BOARD's "RENTAL REPORT - Q2 2018"
- 1. Quarter All Bedroom Types Listed Leased Q2 2018 Q2 2017 985 665 952 613 Quarter All Bedroom Types Listed Leased Q2 2018 Q2 2017 11,963 8,497 11,843 8,545 20182 1.0% -0.6% 21.23% 21.69% 0.39% -2.87% 0.26% 1.17% 1.95% 0.55% Rental Market Report TREB Member Inquiries: (416) 443-8158 Media/Public Inquiries: (416) 443-8152 Total TREB MLS® Apartment Rentals TREB MLS® Avg. 1-Bdrm. Apt. Rent Second Quarter 2018 Economic Indicators Rental Market Summary: Second Quarter 2018 8,497 8,545 Q2 2018 Q2 2017 Apartments Townhouses $2,055 $1,861 Q2 2018 Q2 2017 Toronto Employment Growth % Change Prev Month % Change June 2018 2.3% Toronto Unemployment Rate June 2018 6.3% Inflation Rate (Yr./Yr. CPI Growth) May 2018 -- 2.2% Bank of Canada Overnight Rate June 2018 -- 1.3% Prime Rate June 2018 -- 3.5% Fixed 5-Year Mortgage Rate June 2018 -- 5.34% Sources: Statistics Canada; Bank of Canada Real GDP Quarterly Q1 2018 1.3% TORONTO, ONTARIO, July 17, 2018 – Toronto Real Estate Board President Garry Bhaura announced that Greater Toronto Area REALTORS® continued to report strong average rent increases for GTA condominium apartments rented through TREB’s MLS® System in the second quarter of 2018 relative to Q2 2017. “The demand for condominium apartment rentals remained strong compared to the number of units available for rent. Current market conditions point to the fact that renters have little choice when it comes to finding a place to live. Governments need to look at ways to increase the supply of rental accommodation, both in terms of purpose-built rental properties and individual investor-held units. This would go a long way to easing the pace of rent growth in the GTA,” said Mr. Bhaura. The average one-bedroom condominium apartment rent increased by 10.4 per cent on a year- over-year basis to $2,055 in Q2 2018. The number of one-bedroom condominium apartments rented through TREB’s MLS® System amounted to 4,879 – a 2.9 per cent decrease compared to Q2 2017. The average two-bedroom condominium apartment rent increased by 8.8 per cent on a year-over- year basis to $2,755 in Q2 2018. The number of two-bedroom condominium apartments rented through TREB’s MLS® System amounted to 3,104 – a 1.2 per cent increase compared to Q2 2017. “Recent government policy changes, including rent controls, have not alleviated the strong upward pressure on monthly rents for available condominium apartments in the GTA. New, investor-held condominium apartments entering the market have not been enough to provide the needed balance in the condo rental market. As a result, the strong competition between renters continues to sustain double-digit or near-double-digit annual average rent increases,” said Jason Mercer, TREB’s Director of Market Analysis. Strong Condo Rent Growth Continued in Q2 2018 Bachelor One-Bedroom Two-Bedroom Three-Bedroom Leased Avg. Rent Leased Avg. Rent Leased Avg. Rent Leased Avg. Rent 331 $1,716 4,879 $2,055 3,104 $2,755 183 $3,469 272 $1,551 5,023 $1,861 3,068 $2,533 182 $3,148 Bachelor One-Bedroom Two-Bedroom Three-Bedroom Leased Avg. Rent Leased Avg. Rent Leased Avg. Rent Leased Avg. Rent 3 $1,650 45 $1,907 287 $2,186 330 $2,462 4 $1,169 52 $1,767 239 $2,092 318 $2,415 20182 3.5% 8.5% -40.00% (0) -14.94% (0) 11.67% 0 1.20% 0 1,3 1,3 1,2,3 1,2,3 21.7% 10.6% -2.9% 10.4% 1.2% 8.8% 0.5% 10.2% -25.0% 41.2% -13.5% 7.9% 20.1% 4.5% 3.8% 1.9%Yr./Yr. % Chg. Yr./Yr. % Chg.
- 2. SUMMARY OF RENTAL TRANSACTIONS APARTMENTS, SECOND QUARTER 2018 ALL TREB AREAS All Apartments Total Listed Total Leased TREB Total Halton Region Burlington Halton Hills Milton Oakville Peel Region Brampton Caledon Mississauga City of Toronto Toronto West Toronto Central Toronto East York Region Aurora E. Gwillimbury Georgina King Markham Newmarket Richmond Hill Vaughan Whitchurch-Stouffville Durham Region Ajax Brock Clarington Oshawa Pickering Scugog Uxbridge Whitby Dufferin County Orangeville Simcoe County Adjala-Tosorontio Bradford West Gwillimbury Essa Innisfil New Tecumseth 11,963 8,497 261 183 52 36 1 1 25 19 183 127 890 686 53 39 0 0 837 647 9,487 6,721 1,157 770 7,811 5,571 519 380 1,262 875 18 11 0 0 0 0 1 1 600 436 6 6 278 157 355 262 4 2 51 31 5 5 0 0 9 6 11 4 18 10 0 0 1 1 7 5 1 0 1 0 11 1 0 0 0 0 0 0 10 1 1 0 Bachelor One-Bedroom Two-Bedroom Three-Bedroom Leased Avg. Lease Rate Leased Avg. Lease Rate Leased Avg. Lease Rate Leased Avg. Lease Rate 331 $1,716 4,879 $2,055 3,104 $2,755 183 $3,469 2 $1,400 90 $1,737 85 $2,158 6 $2,725 0 - 14 $1,725 22 $2,126 0 - 0 - 0 - 1 $1,950 0 - 0 - 9 $1,554 10 $1,830 0 - 2 $1,400 67 $1,765 52 $2,239 6 $2,725 7 $1,486 319 $1,880 334 $2,271 26 $2,614 2 $1,450 13 $1,637 20 $1,961 4 $1,919 0 - 0 - 0 - 0 - 5 $1,500 306 $1,890 314 $2,290 22 $2,741 319 $1,726 3,922 $2,119 2,347 $2,930 133 $3,795 8 $1,469 455 $1,905 288 $2,593 19 $2,737 304 $1,743 3,289 $2,165 1,884 $3,050 94 $4,267 7 $1,278 178 $1,829 175 $2,183 20 $2,582 3 $1,400 533 $1,747 322 $2,189 17 $2,591 0 - 6 $1,814 5 $2,160 0 - 0 - 0 - 0 - 0 - 0 - 0 - 0 - 0 - 0 - 0 - 1 $2,000 0 - 3 $1,400 288 $1,719 138 $2,151 7 $2,696 0 - 4 $1,675 2 $1,738 0 - 0 - 85 $1,747 65 $2,212 7 $2,482 0 - 149 $1,802 110 $2,239 3 $2,600 0 - 1 $1,400 1 $1,800 0 - 0 - 15 $1,663 15 $1,828 1 $1,800 0 - 2 $1,575 3 $1,850 0 - 0 - 0 - 0 - 0 - 0 - 3 $1,333 3 $1,525 0 - 0 - 1 $1,400 3 $1,767 0 - 0 - 5 $1,860 4 $1,988 1 $1,800 0 - 0 - 0 - 0 - 0 - 0 - 1 $1,850 0 - 0 - 4 $1,775 1 $2,200 0 - 0 - 0 - 0 - 0 - 0 - 0 - 0 - 0 - 0 - 0 - 1 $2,000 0 - 0 - 0 - 0 - 0 - 0 - 0 - 0 - 0 - 0 - 0 - 0 - 0 - 0 - 0 - 1 $2,000 0 - 0 - 0 - 0 - 0 - 2Rental Market Report, Second Quarter 2018 Toronto Real Estate Board 1 2 2 2 2 23 3 3 3
- 3. SUMMARY OF RENTAL TRANSACTIONS APARTMENTS, SECOND QUARTER 2018 CITY OF TORONTO MUNICIPAL BREAKDOWN All Apartments Total Listed Total Leased TREB Total City of Toronto Total Toronto West Toronto W01 Toronto W02 Toronto W03 Toronto W04 Toronto W05 Toronto W06 Toronto W07 Toronto W08 Toronto W09 Toronto W10 Toronto Central Toronto C01 Toronto C02 Toronto C03 Toronto C04 Toronto C06 Toronto C07 Toronto C08 Toronto C09 Toronto C10 Toronto C11 Toronto C12 Toronto C13 Toronto C14 Toronto C15 Toronto East Toronto E01 Toronto E02 Toronto E03 Toronto E04 Toronto E05 Toronto E06 Toronto E07 Toronto E08 Toronto E09 Toronto E10 Toronto E11 11,963 8,497 9,487 6,721 1,157 770 76 51 52 39 5 2 69 36 72 56 499 318 4 3 324 229 12 7 44 29 7,811 5,571 3,486 2,534 330 181 84 61 42 29 51 37 402 290 1,466 1,058 67 46 378 272 86 56 37 23 120 92 695 492 567 400 519 380 40 34 43 22 22 14 26 17 75 50 7 3 83 63 3 2 202 160 3 2 15 13 Bachelor One-Bedroom Two-Bedroom Three-Bedroom Leased Avg. Lease Rate Leased Avg. Lease Rate Leased Avg. Lease Rate Leased Avg. Lease Rate 331 $1,716 4,879 $2,055 3,104 $2,755 183 $3,469 319 $1,726 3,922 $2,119 2,347 $2,930 133 $3,795 8 $1,469 455 $1,905 288 $2,593 19 $2,737 2 $1,350 30 $2,030 17 $2,938 2 $4,250 1 $1,650 24 $1,983 11 $2,655 3 $3,367 0 - 2 $2,000 0 - 0 - 0 - 22 $1,786 13 $2,185 1 $1,750 1 $1,325 38 $1,802 13 $2,321 4 $2,150 4 $1,520 172 $1,964 141 $2,769 1 $3,850 0 - 2 $1,748 1 $2,500 0 - 0 - 149 $1,862 75 $2,434 5 $2,500 0 - 1 $1,750 3 $2,100 3 $2,233 0 - 15 $1,722 14 $1,955 0 - 304 $1,743 3,289 $2,165 1,884 $3,050 94 $4,267 168 $1,780 1,534 $2,248 782 $3,239 50 $4,298 12 $1,781 105 $2,390 59 $4,345 5 $11,530 9 $1,441 23 $2,020 29 $2,793 0 - 1 $1,500 12 $2,414 12 $3,070 4 $3,550 0 - 22 $1,842 15 $2,199 0 - 1 $1,550 132 $2,021 144 $2,594 13 $2,853 84 $1,751 636 $2,232 332 $3,203 6 $5,283 0 - 17 $2,330 27 $3,319 2 $3,575 8 $1,681 177 $2,089 87 $3,206 0 - 0 - 31 $1,760 22 $2,345 3 $2,000 0 - 10 $2,177 13 $3,669 0 - 3 $1,733 46 $1,843 40 $2,280 3 $2,915 4 $1,575 267 $1,974 216 $2,570 5 $3,326 14 $1,525 277 $1,880 106 $2,409 3 $2,333 7 $1,278 178 $1,829 175 $2,183 20 $2,582 1 $1,650 25 $2,275 8 $3,463 0 - 1 $175 9 $2,019 11 $2,654 1 $5,700 1 $1,150 6 $1,783 7 $2,020 0 - 0 - 8 $1,659 8 $1,969 1 $2,400 0 - 19 $1,730 30 $2,079 1 $2,225 0 - 2 $1,750 1 $2,250 0 - 0 - 29 $1,694 31 $2,001 3 $1,967 0 - 0 - 2 $1,990 0 - 4 $1,493 74 $1,777 68 $2,179 14 $2,529 0 - 1 $1,700 1 $1,600 0 - 0 - 5 $1,588 8 $1,853 0 - 3Rental Market Report, Second Quarter 2018 Toronto Real Estate Board 1 2 2 3 2 3 2 3 2 3
- 4. SUMMARY OF RENTAL TRANSACTIONS TOWNHOUSES, SECOND QUARTER 2018 ALL TREB AREAS All Apartments Total Listed Total Leased TREB Total Halton Region Burlington Halton Hills Milton Oakville Peel Region Brampton Caledon Mississauga City of Toronto Toronto West Toronto Central Toronto East York Region Aurora E. Gwillimbury Georgina King Markham Newmarket Richmond Hill Vaughan Whitchurch-Stouffville Durham Region Ajax Brock Clarington Oshawa Pickering Scugog Uxbridge Whitby Dufferin County Orangeville Simcoe County Adjala-Tosorontio Bradford West Gwillimbury Essa Innisfil New Tecumseth 985 665 94 76 15 14 0 0 6 4 73 58 238 172 43 30 1 1 194 141 458 285 122 69 263 165 73 51 169 116 9 4 0 0 0 0 0 0 112 83 5 3 17 9 25 17 1 0 26 16 4 3 0 0 2 1 5 4 10 6 0 0 0 0 5 2 0 0 0 0 0 0 0 0 0 0 0 0 0 0 0 0 Bachelor One-Bedroom Two-Bedroom Three-Bedroom Leased Avg. Lease Rate Leased Avg. Lease Rate Leased Avg. Lease Rate Leased Avg. Lease Rate 3 1,650 45 1,907 287 2,186 330 2,462 0 - 4 1,736 46 1,884 26 2,267 0 - 3 1,698 7 1,914 4 1,963 0 - 0 - 0 - 0 - 0 - 1 1,850 1 1,850 2 1,800 0 - 0 - 38 1,879 20 2,374 1 1,450 9 1,597 44 1,998 118 2,287 0 - 0 - 8 1,794 22 1,965 0 - 0 - 1 1,800 0 - 1 1,450 9 1,597 35 2,050 96 2,361 2 1,750 31 2,021 133 2,512 119 2,904 0 - 12 1,790 40 2,189 17 2,936 2 1,750 18 2,162 78 2,765 67 3,229 0 - 1 2,250 15 2,054 35 2,266 0 - 1 1,850 61 1,863 54 2,133 0 - 0 - 1 1,975 3 1,900 0 - 0 - 0 - 0 - 0 - 0 - 0 - 0 - 0 - 0 - 0 - 0 - 0 - 0 - 47 1,813 36 2,117 0 - 0 - 0 - 3 1,727 0 - 0 - 4 1,935 5 2,242 0 - 1 1,850 9 2,081 7 2,414 0 - 0 - 0 - 0 - 0 - 0 - 3 1,733 13 1,753 0 - 0 - 0 - 3 1,695 0 - 0 - 0 - 0 - 0 - 0 - 0 - 1 1,950 0 - 0 - 0 - 4 1,650 0 - 0 - 2 1,700 4 1,858 0 - 0 - 0 - 0 - 0 - 0 - 0 - 0 - 0 - 0 - 1 1,800 1 1,725 0 - 0 - 0 - 0 - 0 - 0 - 0 - 0 - 0 - 0 - 0 - 0 - 0 - 0 - 0 - 0 - 0 - 0 - 0 - 0 - 0 - 0 - 0 - 0 - 0 - 0 - 0 - 0 - 0 - 0 - 0 - 0 - 4Rental Market Report, Second Quarter 2018 Toronto Real Estate Board 1 2 2 3 2 3 2 3 2 3
- 5. Bachelor One-Bedroom Two-Bedroom Three-Bedroom Leased Avg. Lease Rate Leased Avg. Lease Rate Leased Avg. Lease Rate Leased Avg. Lease Rate 3 $1,650 45 $1,907 287 $2,186 330 $2,462 2 $1,750 31 $2,021 133 $2,512 119 $2,904 0 - 12 $1,790 40 $2,189 17 $2,936 0 - 2 $1,812 4 $2,538 2 $3,400 0 - 2 $1,875 3 $2,450 3 $3,572 0 - 0 - 1 $2,650 0 - 0 - 0 - 1 $1,800 1 $2,195 0 - 6 $1,733 15 $1,934 1 $1,750 0 - 1 $1,800 10 $2,462 4 $3,450 0 - 0 - 0 - 0 - 0 - 1 $1,900 5 $1,980 3 $2,400 0 - 0 - 1 $2,100 2 $2,650 0 - 0 - 0 - 1 $2,150 2 $1,750 18 $2,162 78 $2,765 67 $3,229 0 - 10 $2,285 24 $3,149 5 $4,880 0 - 0 - 3 $4,167 1 $4,800 0 - 0 - 0 - 1 $5,000 0 - 1 $1,890 1 $2,100 0 - 0 - 0 - 0 - 0 - 0 - 2 $1,750 12 $2,253 7 $3,064 2 $1,750 1 $3,000 13 $2,765 6 $4,124 0 - 0 - 1 $3,275 0 - 0 - 0 - 5 $2,734 0 - 0 - 0 - 1 $1,949 1 $2,900 0 - 0 - 1 $3,200 10 $3,533 0 - 0 - 2 $1,863 0 - 0 - 2 $1,950 7 $2,400 11 $3,432 0 - 2 $1,888 8 $2,485 25 $2,398 0 - 1 $2,250 15 $2,054 35 $2,266 0 - 1 $2,250 4 $2,350 3 $3,266 0 - 0 - 3 $2,475 1 $2,700 0 - 0 - 0 - 0 - 0 - 0 - 0 - 5 $2,040 0 - 0 - 0 - 11 $2,205 0 - 0 - 0 - 0 - 0 - 0 - 0 - 4 $2,388 0 - 0 - 0 - 0 - 0 - 0 - 2 $2,000 2 $2,225 0 - 0 - 1 $1,850 6 $2,033 0 - 0 - 5 $1,626 3 $2,050 SUMMARY OF RENTAL TRANSACTIONS TOWNHOUSES, SECOND QUARTER 2018 CITY OF TORONTO MUNICIPAL BREAKDOWN All Apartments Total Listed Total Leased TREB Total City of Toronto Total Toronto West Toronto W01 Toronto W02 Toronto W03 Toronto W04 Toronto W05 Toronto W06 Toronto W07 Toronto W08 Toronto W09 Toronto W10 Toronto Central Toronto C01 Toronto C02 Toronto C03 Toronto C04 Toronto C06 Toronto C07 Toronto C08 Toronto C09 Toronto C10 Toronto C11 Toronto C12 Toronto C13 Toronto C14 Toronto C15 Toronto East Toronto E01 Toronto E02 Toronto E03 Toronto E04 Toronto E05 Toronto E06 Toronto E07 Toronto E08 Toronto E09 Toronto E10 Toronto E11 985 665 458 285 122 69 12 8 16 8 1 1 4 2 36 22 25 15 0 0 20 9 7 3 1 1 263 165 66 39 6 4 5 1 2 2 0 0 28 21 32 22 1 1 8 5 2 2 20 11 2 2 35 20 56 35 73 51 13 8 4 4 0 0 6 5 18 11 0 0 6 4 0 0 9 4 8 7 9 8 5Rental Market Report, Second Quarter 2018 Toronto Real Estate Board 1 2 2 3 2 3 2 3 2 3
- 6. Toronto Real Estate Board Share of GTA Apartments In Rental NOTES 1 - Refers to the total number of rental units that were available during the reporting period. 2 - Refers to firm lease transactions entered in the TorontoMLS system between the first and last day of the reporting period. 3 - Refers to the average lease rate for firm lease transactions entered in the TREB MLS® system between the first and last day of the reporting period. 4 - Statistics Canada, Quarter-over-quarter annualized growth rate. 5 - Statistics Canada, Year-over-year growth rate. 6 - Bank of Canada, rates for most recently completed month. GTA Condo Apartment Vacancy Rate 6 Source: CMHC, Rental Market Report Source: CMHC, Rental Market Report Rental Market Report, Second Quarter 2018 19.9% 27.5% 35.4% 26.9% 21.6% Halton Peel Toronto York Durham 1.5% 0.5% 0.7% 0.9% 0.3% Halton Peel Toronto York Durham Copyright® 2018 Toronto Real Estate Board