1. Abstract: Reports have shown that some sources of dietary supplements contain ingredients that are not listed as ingredients. We tested supplements from three local sources using a method
called DNA Barcoding. This process required us to isolate the DNA then make copies of the DNA in our lab at LCC. These samples were sent to a DNA sequencing lab and the results of the
sequencing were then compared to a database of known genome sequences to determine whether our dietary supplements matched what was on the label.
Acknowledgments: We would like to acknowledge Lansing Community College for funding the project, GENEWIZ, Inc. for
providing DNA sequence data, and the iPlant Collaborative and NCBI for providing bioinformatics tools. We would also like to
acknowledge Cold Spring Harbor DNA Learning Lab for experimental protocols.
References
1. Cold Spring Harbor Laboratory. (2013). DNA Subway. Retrieved from http://dnasubway.iplantcollaborative.org/about/
2. Cold Spring Harbor Laboratory. (n.d.). Using DNA Barcodes to Identify and Classify Living Things. Retrieved April 05, 2016,
from http://www.dnabarcoding101.org/
3. CBOL (2010). Barcode of Life - Identifying Species with DNA Barcoding. Retrieved from
http://www.barcodeoflife.org/content/about/what-dna-barcoding
4. Park, M. (2011, April 13). Half of Americans use supplements. Retrieved April 15, 2016, from
http://www.cnn.com/2011/HEALTH/04/13/supplements.dietary/
5. O'Connor, A. (2015, February 3). New York Attorney General Targets Supplements at Major Retailers. Retrieved April 15,
2016, from http://well.blogs.nytimes.com/2015/02/03/new-york-attorney-general-targets-supplements-at-major-retailers/?_r=0
Investigation of Supplement Contents Using DNAInvestigation of Supplement Contents Using DNA
AnalysisAnalysis
Shannon Best, Elise DesJardins, Ender Dettlaff, Sarah Hancock, Lurah Peterson, Eric Robins and Melinda Wilson.
Molecular Biotechnology Program, Lansing Community College, Lansing, MITGTTGGATTTAAAGCTGGTGTTAAGGATTATAAATTGACTTATTACACCCCGGAGTATGAAACCAAGGATACTGATATCTTGGCAGCATTCCGAGTAACTCCTCAGCCCGGGGTTCCGCCCGAAGAAGCAGGGGCTGCAGTAGCTGCCGAATCTTCTACTGGTACATGGACAACTGTTTGGACTGATGGACTTACCAGTCTTGATCGTTACAAAGGGCGATGCTATCACATCGAGCCCGTTGTTGGG
AGGAAAATCAATTTATCGCTTATGTAGCTTATCCATTAGACCTATTTGAAGAGGGTTCTGTTACTAACATGTTTACTTCCATTGTGGGTAACGTATTTGGTTTCAAAGCCCTACGCGCTCTACGTCTGGAGGATCTGCGAATTCCCCCTACTTATTCAAAAACTTTCCAAGGTCCGCCTCATGGTATCCAAGTTGAAAGGGATAAGTTGAACAAGTACGGCCGTCCTTTTTTGGGATGTACTATTAAACCA
AATTGGGAT
Introduction
In 2003, Paul Hebert, a researcher at the
University of Guelph in Ontario, Canada, proposed
“DNA barcoding” as a way to identify species.
Barcoding uses a very short DNA sequence from a
standard part of the genome the way a supermarket
uses the black stripes of the Universal Product Code
(UPC) to distinguish products. Two items may look
similar to the untrained eye, but in both cases the
barcodes are distinct. (3)
More than half of the adults in America take
supplements in an effort to become healthier (4).
Supplements are not regulated as drugs by the U.S.
Food and Drug Administration suggesting that
manufacturers do not have to provide data to
support their claims. Past studies have shown that
some supplements do not contain the herbs on their
labels (5). For this experiment we selected six
supplements with a single herb listed on the label as
the active ingredient. We then used DNA barcoding
procedures to analyze the ingredients.
Materials/Methods
Various supplements were collected from
stores in the Lansing area. We isolated and
purified DNA from each supplement using the
Wizard® Genomic DNA Purification Kit from
Promega to perform Polymerase Chain Reaction
(PCR) amplification using primers specific for
plant, mammal, and fish genes. PCR exponentially
increases the number of DNA molecules in a
sample. The DNA was sequenced by GENEWIZ,
Inc. and bioinformatics analysis of the data was
accomplished using DNA Subway and GENBank
computational tools of the iPlant Collaborative.
Results
DNA was analyzed from 18 PCR amplified
supplement samples. Four samples amplified with plant
primers showed plant DNA and two showed
inconclusive results. However, none of the plant sample
barcode results matched the herbs that were listed on
the package label.
Using the mammalian primer, PCR amplified DNA
sequence showed matches to plant species; Cascara
Sagrada matched wheat, St. John’s wort matched
clover, and Echinacea brand 2 matched pea.
Using the fish primer, PCR amplified DNA sequence
showed matches to plant species; Echinacea brand 2
matched mustard and Shark Cartilage matched
hyacinth.
Sample Name Sample# Species E. Score Mismatch
Query
Length
% Identity Purity
1.Shark
Cartilage
S1P
Triticum aestivum,
wheat 7.00E-46 47 527 91
1.9S1M NR NR NR NR NR
S1F
Hyancithus Orientalis
(NCBI)- Hyacinth 8.00E-19 9 80 89.00%
2. Cascara
Sagrada
S2P Pisum sativum, pea 1.00E-170 30 397 93.00%
1.39
S2M
Triticum aestivum,
wheat 0 13 486 97.00%
S2F NR NR NR NR NR
3. St. John's
Wort
S3P NR NR NR NR NR
1.1S3M Melilotus albus, clover 0 25 500 95.00%
S3F NR NR NR NR NR
4. Fenugreek
S4P
Melilotus albus,Sweet
Clover (Yellow/White) 0 7 572 99.00%
0.78
S4M Guiara (Rodent) 9.00E-09 3 126 93.00%
S4F NR NR NR NR NR
5. Echinacea
Brand 1
S5P
Triticum aestivum,
Wheat 1.00E-159 23 369 94.00%
0.56
S5M NR NR NR NR NR
S5F NR NR NR NR NR
6. Echinacea
Brand 2
S6P NR NR NR NR NR
1.43S6M Pisum sativum, Pea 0 13 571 97.00%
S6F Brassica, Mustard 1.00E-175 60 804 96.00%
Conclusion
The purpose of this project was to determine if the
ingredients of herbal supplements were consistent with
the labeling. To do this we looked at DNA barcodes, gel
electrophoresis, and chromatogram data. The
electrophoresis gel with plant primer showed bands for
two of the supplements, however, we obtained
sequencing results for four of the samples.
The gel with the mammalian primer showed a band
for the fenugreek sample. When looking at the DNA
sequence, it matched to rodent DNA. However the E-
score and bit-score statistics, and the DNA query length
indicate that this was unreliable data. Interestingly, the
gel showed a band consistent with the query length. We
cannot, however, conclude there is rodent DNA in the
supplement.
All of our results were inconsistent with the labeling
on packages. However, statistical analysis of the data
indicated that some of the results were questionable.
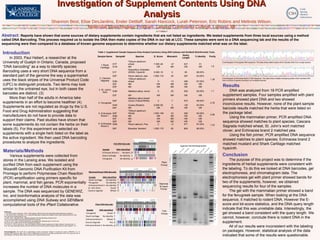
Agarose Gel Electrophoresis
Plant
Primer
Fish
Primer
Mammal
& Insect
Primer
Chromatogram of Fenugreek DNA sequence. This data shows distinct peaks which indicates DNA from a single species.
Chromatogram of Echinacea Brand 2 DNA sequence. This data shows multiple overlapping peaks which indicates DNA
from a mixture of species resulting in an unreliable barcode.
4
1
5
2
6
Plant DNA Barcode
Sample DNA Identified
Fenugreek Clover
Shark Cartilage No Identity
Echinacea Brand 1 Wheat
Cascara Sagrada Pea
Echinacea Brand 2 No Identity
1
4
5
3
2
Mammal/Insect DNA Barcode
Sample DNA Identified
Shark Cartilage No Identity
Fenugreek No Identity
Echinacea Brand 1 No Identity
St. John Wort Clover
Cascara Sagrada Wheat
6
1
4
Fish DNA Barcode
Sample DNA Identified
Echinacea Brand 2 Mustard
Shark Cartilage No Identity
Fenugreek No Identity
Table 1: Supplement Sample Sequence Data Analysis Summary Using DNA Subway and GenBank Bioinformatic Tools.
Editor's Notes
--The Latin names are needed for the species in the table I inserted.
I have inserted the Supplement barcodes from Eric’s slides (THEY NEED THEIR ROW LABELS on the left)
I have inserted the gels with labelling. They might need labelling as to their primer order (top=plant, middle=mammal, bottom=fish)