1. THE EFFECT OF COMPRESSION ON SPEECH PERCEPTION AS REFLECTED BY
ATTENTION AND INTELLIGIBILITY MEASURES
By
Sangsook Choi
A DISSERTATION
Presented to the Faculty of
The Graduate College at the University of Nebraska
In Partial Fulfillment of Requirements
For the Degree of Doctor of Philosophy
Major: Human Sciences
Under the Supervision of Professor Thomas D. Carrell
Lincoln, Nebraska
December, 2004
2. Acknowledgements
I would like to thank the members of my committee, Thomas Carrell, T. Newell
Decker, Stephen Boney, Charles Healey, and Sharon Evans for their encouragement and
guidance throughout my graduate studies. I would like to extend my special thanks to my
adviser Dr. Thomas Carrell, whose intelligence and integrity have made a huge influence
on the development of my passion for research. The completion of this work would not
have been possible without him.
I would also like to thank my family and friends for their love and unfailing
support. I love you all very much.
3. THE EFFECT OF COMPRESSION ON SPEECH PERCEPTION AS REFLECTED BY
ATTENTION AND INTELLIGIBILITY MEASURES
Sangsook Choi, Ph. D.
University of Nebraska, 2004
Adviser: Thomas D. Carrell
The purpose of this study was to investigate the effect of amplitude compression
on speech perception as reflected by attention and intelligibility. Previous investigations
of the effects of compression on intelligibility have shown inconsistent results. Additional
measures were investigated in the present work because percent-correct measures of
intelligibility are not a complete indicator of compression effectiveness. Listening effort
was considered as an additional parameter. Two dual-task paradigms were constructed to
measure listening effort associated with amplitude compression. In the first experiment,
an auditory word recognition task was employed as the primary task and a visual motor
tracking task as the secondary task. Monosyllabic words were mixed with speech-shaped
noise at a fixed signal-to-noise ratio and compressed using fast-acting wide dynamic
range compression. Participants with normal hearing performed a word recognition and a
pursuit rotor task in single and dual-task conditions. Results showed that compressed
speech decreased visual motor tracking performance but not word recognition as
compared to linearly processed speech. In the second experiment, an auditory word
recognition task again served as the primary task, and a visual lexical decision task was
employed as the secondary task. In the secondary task subjects were asked to decide
whether an item on a computer screen was a word or not. The visual lexical decision task
was expected to interfere more with the auditory word recognition task as compared to
the visual motor tracking task of the first experiment because the lexical decision task
shares more similarities in processing modes with the auditory task. However, the results
showed that the lexical task did not interfere with the auditory task and did not reduce the
dual-task performance. Several explanations for this finding are proposed. The use of
dual-tasks to measure listening effort can be affected by many factors. Additional
research will reveal the particular dual-task methods that are best for evaluating
compression.
4. i
LIST OF TABLES
TABLE PAGE
1 Means and standard deviations for percent word correct (Exp. 1). ......35
2 Means and standard deviations for percent time on target (Exp. 1). ....37
3 Multivariate analysis of variance for Experiment 1..............................39
4 Means and standard deviations for percent word correct (Exp. 2). ......54
5 Means and standard deviations for P (c) max (Exp. 2).........................56
6 Multivariate analysis of variance for Experiment 2..............................58
5. ii
FIGURE CAPTIONS
Figure 1 Acoustic waveforms of speech
Figure 2 Construction of auditory stimuli
Figure 3 Input-output function of compression
Figure 4. Sample waveforms of auditory stimuli
Figure 5 Illustration of pursuit rotor
Figure 6 Picture of a subject in Experiment 1
Figure 7 Diagram of the research design for Experiment 1
Figure 8 Graphical display of the means for word recognition
Figure 9 Graphical display of the means for pursuit rotor
Figure 10 Graphical display of the combined results for Experiment 1
Figure 11 Sample pictures of visual stimuli
Figure 12 Experimental set-up for Experiment 2
Figure 13 State diagram of Experiment 2
Figure 14 Picture of a subject in Experiment 2
Figure 15 Diagram of the research design for Experiment 2
Figure 16 Graphical display of the means for word recognition
Figure 17 Graphical display of the means for P (c) max
6. iii
APPENDICES
APPENDIX
A Word list 1 & 2
B Questionnaire for Experiment 1
C Written instructions for Experiment 1
D Post-test questionnaire for Experiment 1
E Lexical list A & B
F Occurrence of each letter used for lexical list A & B
G Schematic diagram of dual computer adaptor
H Questionnaire for Experiment 2
I Written instructions for Experiment 2
J Post-test questionnaire for Experiment 2
K Informed consent form for Experiment 1
L Informed consent form for Experiment 2
M Scenario file used to run Presentation
N Template file used to run Presentation
7. iv
TABLE OF CONTENTS
Abstract
List of Tables
Figure Captions
Appendices
CHAPTER:
I. INTRODUCTION.............................................................................1
II. REVIEW OF THE LITERATURE..................................................6
Section I. Compression..............................................................6
Compression Classifications..........................................6
Rationale for Syllabic Compression ..............................6
Advantages and Disadvantages of Compression...........7
Conflicting Results on Compression ............................9
Section II. Intelligibility...........................................................11
Tradition of Intelligibility Measures............................11
Limitation of Intelligibility Measures .........................12
Section III. Alternative Approaches: Attention & Effort.........14
Cognitive Effects in Hearing .......................................14
Dual-task Performance and Listening Effort ...............17
Dual-task Techniques...................................................18
Dual-task paradigm using a motor-function ....18
Dual-task paradigm using short-term memory 19
Dual-task paradigm using cognitive tasks .......20
Factors Affecting Dual-task Performance ...................20
III. PROJECT OVERVIEW ...............................................................22
Rationale & Statement of the Problem ....................................22
Overall Purpose........................................................................23
Hypotheses...............................................................................23
Research Questions..................................................................23
IV. EXPERIMENT 1...........................................................................25
Method.....................................................................................25
Participants...................................................................25
Experimental Tasks......................................................26
Auditory task....................................................26
Materials ..............................................26
Construction of auditory stimuli..........26
Auditory task set-up.............................30
Visual motor task.............................................30
8. v
Pursuit rotor .........................................30
Pursuit rotor set-up...............................31
Procedure .....................................................................31
Research Design...........................................................32
Data Scoring and Analyses..........................................33
Results......................................................................................34
Descriptive Analysis....................................................34
Percent word correct ........................................34
Percent time on target ......................................37
Inferential Statistical Analysis.....................................38
Discussion................................................................................41
Comparison of Findings ..............................................41
Dual-task paradigms ........................................41
Compression ....................................................42
Implications..................................................................43
Limitations...................................................................45
Summary of Findings...................................................45
V. EXPERIMENT 2 ............................................................................46
Method.....................................................................................46
Participants...................................................................46
Experimental Tasks......................................................46
Auditory task....................................................46
Visual lexical decision task..............................46
Materials ..............................................46
Construction of visual stimuli..............47
Experiment set-up for lexical...............47
Procedure for lexical decision task ......49
Procedure for an Experiment Session..........................51
Research Design...........................................................52
Data Scoring and Analyses..........................................52
Results......................................................................................53
Descriptive Analysis....................................................53
Percent word correct ........................................53
P (c) max..........................................................55
Inferential Statistical Analysis.....................................57
Discussion................................................................................59
VI. GENERAL DISCUSSION & CONCLUSIONS...........................62
Dual-task Paradigms & Listening Effort .................................62
Compression & Intelligibility ..................................................63
References
9. 1
CHAPTER 1
Introduction
This work was motivated by inconsistent findings on the most common type of
signal processing used in current hearing instruments, amplitude compression. The
purpose of the study was to develop a more complete understanding of compression on
speech perception by employing novel measures along with traditional approaches.
About 28 million Americans (about 10% of the population) experience hearing
loss varying from mild to complete loss (Better Hearing Institute, 2001). Over 1 million
of the hearing impaired are children, and 54% of population over an age 65 has a hearing
loss (ASHA, 2004). Nevertheless, 80% of hearing loss is irreversible and cannot be
corrected medically or surgically (ASHA, 2004). Among untreatable hearing losses,
sensorineural hearing loss is most common, and affects 17 million Americans (ASHA,
2004).
Sensorineural hearing loss is caused by damage to hair cells or the nerve
pathways from the inner ear to the brain. Causes of hair cell or nerve damage include
birth defects, ototoxic drugs, genetic syndromes, viral infection, head trauma, noise
exposure but most often occur as a result of aging. Regardless of cause, sensorineural
hearing loss involves not only reductions in hearing thresholds resulting in a reduced
dynamic range, but also reductions in frequency and temporal selectivity, which are
essential auditory functions used to discriminate speech sounds (Moore, 2003). Resulting
difficulties in understanding speech are caused by combinations of these auditory deficits
(Dillon, 2001). Additionally, research shows that hearing loss can affect relationships,
school performance, job productivity, as well as emotional, physical, and social well-
being (National Academy on an Aging Society, 1999). Therefore, hearing impairments
are not just a common health problem but also have a huge impact on the quality of life
of individuals with hearing deficits.
The most common solution for overcoming sensorineural hearing loss is the use
of amplification. For many decades, analog hearing aids with linear amplifiers were fitted
to individuals with sensorineural hearing loss. However, there are disadvantages with
linear hearing aids, which are associated with the reduced dynamic range of sensorineural
hearing loss that often causes loudness discomfort and inability to hear quiet sounds.
Since linear hearing aids cannot overcome problems of loudness discomfort and
audibility, the use of compression has been suggested. Villchur (1973) first designed
commercially successful wide dynamic range compression. However, compression
circuits were not prevalent until the mid 1990s (Kuk, 2000).
The rationale for compression was to compensate for reduced dynamic range.
Hearing aids today use compression as a primary signal-processing algorithm. Typically
it operates independently on multiple frequency channels. Implementation of a wider
variety of compression methods has become more practical with digital technology. The
goal of this processing is to allow sound to fit within the individual’s residual dynamic
range to insure the audibility of speech sounds. Hearing aids partially overcome hearing
deficits of sensorineural hearing loss by restoring the loss of sensitivity. However, even
10. 2
with the most advanced digital technology, hearing aids are not a perfect solution to
communication problems. They do not address other auditory deficits such as reduced
frequency selectivity and temporal resolution. The fact that amplification only solves one
of the problems associated with hearing loss partially explains why only 25% of
individuals with hearing loss use hearing aids. In addition, hearing aids have become
much more expensive in recent years. Digital hearing aids cost more than two or three
times as much as analog hearing aids. Moreover, despite the technical advances, hearing
instruments are still imperfect and issues of the cost-efficiency of new technologies have
been questioned by hearing professionals, consumers, and third parties. Therefore, the
need to understand and document the potential improvement in speech perception with
amplification is of practical importance.
The major goal of hearing aid signal processing is to maximize benefit in
everyday communication. Unfortunately, measuring this ability has been difficult to
accomplish. Nevertheless, intelligibility measures have been the most popular estimate of
the usefulness of signal processing algorithms in speech understanding. A common
approach used to predict communication function has been to assess speech recognition
performance (typically, using monosyllabic words). Intelligibility has been measured by
behavioral testing based upon recognition of speech units as simple as nonsense syllables
or has been estimated mathematically by measuring transmission of speech energy at
separate frequency bands. All these intelligibility measures have, to a large degree, been
based on the articulation index (AI) theory1
(French and Steinberg, 1947; Fletcher and
Galt, 1950), which mainly emphasizes frequency information and audibility.
The early work on telephonic intelligibility measures largely influenced both
clinical and research approaches in evaluation of quality of signal processed through
hearing aids. However, both AI and behavioral measures have not performed well at
predicting real life performance. Although a variety of speech recognition tests have been
developed and are available for clinical use, criticisms of their limitations have been
growing over the years. This is due to the lack of reliability and the lack of the sensitivity
of the tests for evaluating the efficacy of hearing aid processing schemes. Long ago,
Shore, Bilger, and Hirsh (1960) criticized the reliability of procedures for hearing aid
evaluation procedures, and concluded that the use of monosyllabic words whether
presented in quiet or noise were not a reliable means of differentiating among hearing
aids.
One of the reasons for this might be related to simplicity of test procedures as
opposed to the complexity of the listener’s typical environment. Speech understanding
involves a complex process in many interdependent stages. Both the AI test and speech
1
AI was developed to predict intelligibility from the acoustic representation of the speech signal. The AI
is computed from a weighted sum of speech-to-noise ratios in several frequency bands, which have
weighting based on the importance of each band in speech intelligibility. It was developed at Bell Labs
under the lead of Harvey Fletcher. The ideas of this theory underlie all AI-based models (Fletcher and
Galt 1950; French and Steinberg, 1947; Kryter, 1962; Beranek, 1947, Steeneken and Houtgast, 1980) and
standards that are based on them [ANSI AI (ANSI S3.5, 1969) and the SII (ANSI S3.5, 1997). Several of
these models were developed as tools for engineers and were thus limited to a complexity that was easily
manageable with manual computation and geometric construction (Müsch, 1999).
11. 3
recognition tests measure only limited aspects of how speech sounds are heard and
recognized. Understanding speech is more than recognizing a sequence of sounds, and it
requires an array of analyses and processes. To decode a message represented by the
acoustic signal at the cochleas, the acoustic information of speech is first transduced into
firing patterns of auditory neurons in response to outer and inner haircell deflections. This
neurally encoded information at the sensory register evokes a series of processes at
phonetic, semantic, and syntactic levels. Each process at a different level enhances or
supplements the entire message. Therefore, even if a phoneme is entirely missing or
replaced by non-speech sound, listeners will understand the utterance without noticing
the absence or change of that phoneme (Warren, 1970). Although there is a change in the
quality of signal such as degradation, masking, and missing information due to signal
processing, noise, and reverberation, the change in signal quality may not be well
reflected by performance in intelligibility testing due to other higher cognitive processes
such as phonological, semantic knowledge or strategies to pull out other available speech
cues.
Traditional techniques used to measure intelligibility seem to be insufficient to
characterize its performance. Researchers have recognized limitations in speech
intelligibility studies and have explored additional measures such as reaction time and
dual-task, subjective evaluation (quality rating), evoked potentials, and brain imaging.
Subjective measures of quality rating have also been used. The Likert scale, typically
used in clinical approaches asks whether or not a listener can tolerate what he or she is
receiving. However, an individual’s subjective judgment on sound quality may be too
difficult to interpret and to reliably compare with another individual’s judgments. Evoked
potentials have been also used as objective physiological methods to study speech
perception. However, this approach also has been challenged due to large individual
variability across subjects as well as due to difficulty using a real speech sound (mostly
very short and simplified speech sounds have been used). Brain imaging is also a
promising approach. However, this advanced technology is not as readily available for
researchers as other techniques and also is a very expensive approach.
On the other hand, researchers have made extensive use of reaction time (RT) and
dual task techniques to understand mental processes and human performance. RT has
been used as behavior measures of processing speed and capacity demands (Donders,
1969; Posner, 1978). RT has also been used as an index of mental processes imposed in a
given speech material (Pisoni, 1974, 1975; Pratt, 1981; Gatehouse, 1990). RT measures
the time it takes the listener to respond and provides a means of assessing differences in
the time course of perception. It is assumed that a listener will take longer to respond
when additional perceptual processing of the stimulus is required. Two stimuli that yield
equivalent performance in percent correct response may either have engaged different
perceptual processes or have produced differences in the amount of processing at some
point in perception (Sawusch, 1996). Typically, extended RT is associated with increased
processing demands. Therefore, differences in RT can be used as an indication of the
difficulty of listening speech.
12. 4
However, RT also has problems. The most serious problem is the speed accuracy
trade-off. A speed-accuracy trade-off occurs when a listener is faster and less accurate in
one condition than in another condition. The two conditions cannot be compared on the
basis of speed or accuracy because both vary, and the faster speed of the one listener
could have been bought at a cost of more errors (Sawusch, 1996). If speed-accuracy
trade-off exists, differences in performance between groups of listeners in different
conditions cannot be interpreted (Pike et al., 1974; Posner, 1978). If listeners make no
errors, they may not be performing the task as rapidly as possible, If they are not
performing as rapidly as possible, the RTs are not an accurate indicator of perceptual
processing, since extra time could be taken anywhere in processing. Therefore, RT
requires a careful design in experimentation technique to avoid this problem.
Another approach used for measuring mental effort in relation to task load is dual-
task paradigms. Dual-task paradigms have long been used to study mental capability and
limitations in performing multiple tasks. Also, the dual-task method has been extensively
used by NASA (National Aeronautics and Space Administration) and the FAA (Federal
Aviation Administration) to test pilots’ performance under different levels of task
demands. Specifically in speech perception studies, dual-tasks have been used to measure
listening effort. Typically, listening is the primary task and an additional task is used as
the secondary task to increase the overall task demand. When the listener’s task demands
are increased by the secondary task, reduced performance in the secondary task has been
interpreted as an indication of increased processing demands in the primary task due to
limitation of processing capacity (Kahneman, 1973). A decrease in secondary task
performance was interpreted as an indication of increased listening effort. A few
researchers have found the usefulness of dual-task paradigms for measuring listening
effort or processing demands that is often observed with hearing impaired listeners
(Downs & Crum, 1978; Downs, 1882, Luce et al., 1983; Hicks & Tharpe, 2002). Overall,
it was consistently found that although there was a change in signal quality, intelligibility
measures did not reflect the change of signal quality, rather increased processing
demands and listening effort was reflected in the additional task performance.
It is important to consider additional measures such as listening effort (processing
demands) when change in signal quality does not affect overall comprehension of speech
but results in taxing of mental effort. Intelligibility performance is a result of our complex
mental processes that not only reflect the quality of signal but also reflect other mental
effort to achieve a given performance level. Therefore, there is a method that can reflect
this effort as a tool to evaluate the effectiveness of signal processing algorithms used in
current hearing aids.
Returning to compression, the goal of the present research is to determine an
optimal way to implement compression while causing minimal reduction in speech
understanding. It will be proposed here that to understand the effect of compression on
speech perception, signal-processing strategies should be researched with both
intelligibility and non-intelligibility measures. The first step is to determine the additional
measures of speech quality that will provide a more complete view of the perceptual
13. 5
processes. Listening effort will be used to investigate performance. From this work a
more complete picture of the effect of compression on speech perception will emerge.
14. 6
CHAPTER II
Literature Review
Section I: Compression
Due to the loudness recruitment1
found with sensorineural hearing loss, the
majority of hearing aids today use amplitude compression to bring the wide dynamic
range of acoustic signals within the residual range of the impaired cochlea. Although the
idea of compression is straightforward, in practice there are various ways of
implementing it depending upon the rationale for its use (Stone & Moore, 2003).
However, regardless of any particular implementation, compression’s major goal is to
reduce the dynamic range of the signal in order to prevent loudness discomfort and
provide more gain for quiet sounds (Dillon, 2001).
Compression Classifications
There are a number of different compression algorithms applied to commercial
hearing aids. These compression systems are often classified by their physical
characteristics2
such as compression ratio and kneepoint. They are also classified by the
primary goal of a compression design. For example, fast-acting compression versus slow-
acting compression is described based upon the attack and release time characteristics of
compression. This same description may be classified differently by the function of the
compression that is syllabic compression versus AGC (Automatic gain control). These
two types of compression have different characteristics and share similarities and
differences in their rationale. Fast-acting compression with a low kneepoint (a.k.a.,
syllabic compression) was primarily designed to change amplitudes between the short
segments of speech to increase the audibility of the quiet speech sounds (often
consonants), and thus, it is intended to operate at a syllable level. One the other hand,
slow-acting compression was aimed to alter the overall level of a speech signal while the
relative intensity variations between syllables are unchanged. This requires less frequent
volume adjustment, and therefore is intended to operate at a word or phrase level.
Rationale for Syllabic Compression
Syllabic compression was designed to improve consonant perception. It was
based upon the notion that speech perception consists of the serial processing of strings of
fundamental speech units (e.g., phonemes). Therefore, it was assumed that improving the
perception of individual phonemes improves overall speech perception. To achieve
improvement in phoneme perception, it was assumed that audibility of individual
phonemes should be ensured. However, different phonemes have inherently different
intensities based upon how they are produced. In general, consonants are less intense than
the vowels. However, the intensity of each phoneme varies dramatically depending on
stress and intonation pattern. Natural speech fluctuates in intensity level over time. The
1
Loudness recruitment is the most common symptom resulting from sensorineural hearing loss. The
hearing impaired listener’s loudness perception of low level sounds is abnormal but the perception of high
level sounds is intact.
2
Technical details and manifestation regarding compression parameters will not be discussed here.
Additionally, the discussion regarding the types of compression will be mainly focused on the compression
types that are directly related to the topic of the dissertation.
15. 7
difference between the quietest consonant and the loudest vowel is 50 to 60 dB.
Therefore, when applying the same gain to all speech sounds (e.g., with linear
amplifiers), the more intense vowels will become even louder while the less intense
consonants may still be inaudible. Furthermore, weaker sounds may be masked by the
higher intensity sounds by a forward or backward masking, which may result in
decreased speech intelligibility (Kuk, 1996). To prevent weak sounds from being masked
by intense sounds, or to ensure the audibility of weak sounds, the intensity difference
between weak and intense sounds should be decreased. This goal can be achieved by
syllabic compression (typically with a low kneepoint3
). Syllabic compression with low
kneepoint (a.k.a., wide dynamic range compression, WDRC4
) is designed to provide
more gain to less intense speech sounds and less gain to more intense speech
components. As a result, it decreases the intensity difference between the less intense
consonants and the intense vowels, and thus it increases consonant-to-vowel intensity
ratio5
(CVR; Montgomery & Edge, 1988). Increasing the CVR is suggested by many
researchers as a way of enhancing consonant perception for hearing impaired listeners
who frequently have trouble in identification and discrimination of voiceless consonants.
However, in order to increase the consonant-to-vowel ratio or in order to achieve the gain
change at a syllable level, the release time6
must be short (e.g., 50 ms) enough to recover
from compression of the more intense vowels so that the weaker consonants can be
amplified with more gain (Kuk, 1996). Therefore, syllabic compression is often
characterized by the fast attack and release time. This is why syllabic compression is also
often referred to as fast-acting compression.
Advantages and Disadvantages of Syllabic Compression
The theoretical advantage of syllabic compression compared to linear processing
is to improve the audibility of weak consonants within the comfortable levels at the
listener’s ear by providing more gain to low input speech and increasing the CVR for
improvement of consonant perception. Acoustical analyses found an increase in CVR for
certain group of phonemes using fast acting compression (Hickson & Byrne, 1997;
1999). Typically, voiceless fricatives such as /φ/ and /Π/ showed the largest CVR
increase and increased perception of /φ/ but did not increase perception of /Π/. However,
the results on perception of stop consonants in relation to increased CVR have shown
mixed findings. Some studies have found decreased perception of stops in hearing
impaired listeners despite the increased CVR via compression (Hickson & Byrne, 1997;
Dreschler, 1988). However, some studies investigating CVR effects have shown
increased perception of stop sounds in the initial position of a syllable with elderly
subjects with mild to moderate sensorineural hearing loss (Gordon-Salant, 1986; 1987).
Therefore, the relation between increased CVR and improvements in phoneme perception
3
The knee point is also referred to as the compression threshold. It is the input SPL above which the
hearing aid begins compressing.
4
WDRC, syllabic compression, and fast-acing compression will be interchangeably used in this
dissertation to describe a type of compression that has a relatively fast attack and release time and a knee
point lower than 45 dB SPL.
5
Consonant-to-vowel intensity ratio is often used to describe the difference in intensity between a
consonant and a vowel. By amplifying the amplitude of a consonant, CVR can be increased.
6
The time taken for the compression hearing aids to return from the compressed state to the linear state.
16. 8
does not seem straightforward. This implies that increased audibility may not always
result in increased speech intelligibility.
Despite of the advantage of increased audibility of weak consonants, the relation
between audibility and intelligibility is not clear-cut. Side effects from syllabic
compression could be significant. The primary result of compression is the decrease of
overall amplitude modulation, which inherently exists in natural speech (Plomp, 1988;
Drullman, 1995). The reduction of slow rate amplitude modulation was found with
compression systems using fast time constants (Moore et al, 2001). However, amplitude
modulation has been shown to be important in speech perception by differentiating the
signal from a masking noise (Hall & Haggard, 1983; Hall et al., 1984). It has also been
shown to be an important grouping mechanism for speech (Carrell & Opie, 1992; Barker
& Cooke, 1999). Therefore, a reduction in amplitude modulation may be expected to
adversely affect speech perception in noise. And in fact, the negative effects of
compression in noise have been repeatedly reported particularly when the signal-to-noise
ratio was unfavorable.
Compression results in the modification of the average speech spectrum and
reduces spectral contrasts as a result of reduction in modulation depth (i.e., a reduction in
peak-to-peak valley ratio) (Plomp 1988; Stone & Moore, 2003). Reduced spectral
contrasts can have a detrimental effect on speech perception for individuals with
sensorineural hearing loss because of their reduced spectral selectivity. Reduced spectral
selectivity can result in poor discrimination of phonemes especially in the presence of
competing noise. Reduced spectral selectivity is a result of a broadened filter that allows
more noise to pass and that decreases the signal-to-noise ratio and degrades the frequency
resolution. Therefore, compression can aggravate spectral resolution in addition to
existing problems.
Compression also changes the overall shape of gross temporal intensity envelopes
(often called “envelopes”). It has been found that envelopes carry linguistic information
regarding both segmental and supra-segmental aspects of speech (Rosen 1992).
Therefore, any distortion in amplitude envelopes can affect perception of any phonemic
or prosodic attributes carried by the characteristics of envelopes. In addition, envelope
cues provide a significant role in speechreading (Erber, 1972; Bratakos et al, 2001),
which individuals with severe to profound loss heavily rely on for phoneme recognition.
Therefore, compression can also affect the audio-visual aspect of speech perception.
Unfortunately, there has been no study conducted to investigate the effect of compression
on lip reading.
Compression can also distort the rise and fall time characteristics of the signal.
Especially with fast acting compression, overshoots and undershoots are introduced when
the compression mode is activated and deactivated. This results in a distortion in attack
and decay features of the signal, which is often related to the attributes of timber
perception (Rosen, 1992). Although the potential disadvantages result from the distortion
of envelopes, there has been no systematic study to investigate the effect of distortion in
envelopes on perception of timber
17. 9
Conflicting Results on Compression and Improved Intelligibility
Clearly compression creates both advantages and disadvantages for listeners, and
the effectiveness of compression for improving speech intelligibility for individuals with
cochlear hearing impairments is still being debated. This may be due to the complex
effect of compression on speech signals because it simultaneously improves and degrades
different aspects of the signal. Compression improves the audibility of weak sounds and
prevents loudness discomfort resulting from overamplifying intense sounds. On the other
hand, it also distorts the amplitude envelope characteristics. Although audibility can be
improved by compression, the relation between improved audibility of speech (often
expressed as an audibility or articulation index7
) and improved intelligibility in speech
recognition tests has not been clearly demonstrated (Moore et al., 2001; Kuk, 1996).
Some studies found improvements in speech intelligibility using compression (Souza &
Bishop, 2000; Jestead et al., 1999; Moore et al., 1992; Moore et al., 1999), and concluded
that compression improved in speech intelligibility due to improved audibility. However,
improvements in intelligibility were limited when it was tested in quiet or at favorable
signal-to-noise ratios and when the stimulus presentation level was below conversation
level (Lippmann et al., 1981; Nabelek, 1983; Hornsby & Ricketts, 2001).
Other studies found a decrease or no improvement in intelligibility with
compression compared to intelligibility with linear processing (Lippmann et al., 1981;
Nabelek, 1983; Hornsby and Ricektts, 2001; Hickson & Byrne, 1999; Stone & Moore,
2003). Typically, systematic reduction in speech recognition was found as a result of
increases in the amount of compression. Conclusions for the possible causes of reduced
speech intelligibility were related to alteration in temporal properties such as distortion in
amplitude envelopes and reduction in amplitude envelope modulation.
A theoretical understanding of the reduced intelligibility due to temporal
amplitude distortion via compression has been influenced by the work of a small number
of investigators on the contribution of temporal envelope information to speech
perception. For example, many aspects of pitch perception cannot be entirely explained
by the place-frequency mechanism of the cochlea. Additionally, good speech perception
performance by single-channel cochlear8
implantees cannot be accounted for a place-
based frequency analysis. An appreciation of temporal aspects of speech was emphasized
by the notion of a modulation transfer function (Houtgast & Steeneken, 1973, 1985,
Houtgast, Steeneken, & Plomp, 1980). According to the modulation transfer model,
speech is a continuous flow of sound with varying frequencies over time, and the
intensity contrasts in this spectro-temporal pattern are an essential part of the speech
information. Therefore, for a reliable transfer of speech through any electrical or
acoustical transmission instrument, these intensity contrasts should be preserved
adequately (Plomp, 1988). Also Rosen (1992) recognized the linguistic importance of
7
There are many different ways to calculate the audibility of speech. For clinical purposes such as
predicting speech intelligibility or selecting amplification systems, sensation level of audiometric
thresholds as relative to frequency-gain responses of amplification devices are commonly used for
calculating audibility index. The audibility index is expressed as ratios ranging from 0.0 (the entire speech
spectrum is inaudible) to1.0 (all of speech spectrum is audible).
8
The cochlear implant device developed had no frequency information.
18. 10
temporal information in speech from observations of speech phenomena, which cannot be
entirely explained by traditional spectral approaches. Because of compression, the
amplitude envelope attributes of the acoustic signal can be distorted and affect the
perception of linguistic features. Amplitude envelopes, which represent time-intensity
information in natural speech, carry segmental information such as manner of
articulation, voicing, and vowel quality as well as prosodic cues such as syllabification,
rhythm and tempo. In recent years, the importance of amplitude envelopes have become
more appreciated, and evidence continues to accumulate that amplitude fluctuation is an
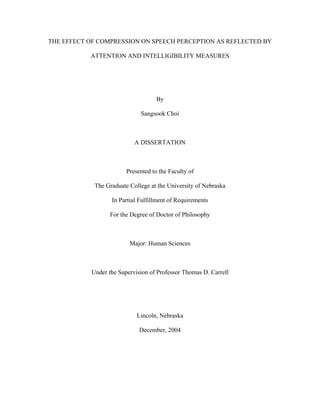
important cue to speech (Rosen, 1992; See Figure 1). Although it is undeniable that
amplitude information contributes to speech perception processes, there are no data or
indexes showing the systematic relation between amplitude information and speech
intelligibility as does the articulation index. The extent to which acoustic changes in
amplitudes will lead to perceptual change is still unclear. Changes in amplitude may
affect quality of speech but not affect intelligibility, or may affect both.
Figure 1. This figure and figure caption are adapted from the Rosen’s paper (1992), ‘Temporal
information in speech: Acoustic, auditory, and linguistic aspects.’ The speech pressure waveforms of six
phrases are displayed on the left. The two arrows (in ‘chop’ and ‘pool’) indicate the release bursts of
plosive consonants. The waveforms on the right are obtained from those on the left by full wave
rectification and low-pass filtering at 20 Hz. This preserves envelope (refer to fluctuations in overall
amplitude at rates between about 2 & 50 Hz) information, but eliminates high fluctuations rates, for
example, the loss of the release bursts of /τΣ/ in ‘chop’ and /π/ in ‘pool’ evident in the pressure waveforms
on the left.
In summary, both theoretically and empirically it is clear that compression has
advantageous and detrimental effects on speech perception. Nevertheless, the use of
compression in amplification is unavoidable for individuals with cochlear damage in
order to compensate for reduced dynamic range. The question to be addressed is how to
implement compression systems that maximize the beneficial effects and minimize the
distortion effects.
19. 11
Section II: Intelligibility
To evaluate the effective of compression processing algorithms, most
compression studies have measured speech intelligibility that was based upon recognition
of phonemes, or short length words presented at threshold or supra-threshold levels.
However, intelligibility measures have been criticized for many reasons in evaluating
hearing-impaired listeners. These limitations of intelligibility measures partially stem
from how they were originally developed and how they have been used and applied to
audiology. Therefore, a review of the history of intelligibility measures will be presented,
followed by a discussion of problems associated with intelligibility measures.
Tradition of Intelligibility Measures
The tradition of speech intelligibility measures was strongly influenced by the
earliest work done by engineers to evaluate communication systems especially after the
invention of telephone. This is well described in a paragraph written by Hawley (1977),
who wrote the introduction for the book “Speech intelligibility and speaker recognition”:
Although the problems of measuring and improving the intelligibility of
speech are as old as speech communication itself, no scientific
investigations were undertaken until the telephone was developed.
Alexander Graham Bell wrote in a description of his first telephone
(1876), “Indeed as a general rule, the articulation was unintelligible except
when familiar sentences were employed….The elementary sounds of the
English language were uttered successively into one of the telephones and
its effects noted at the other. Consonantal sound, with the exception of L
and M, were unrecognizable, vowel sounds in most cases were distinct.”
He thus established a precedent for testing the intelligibility of articulation
by means of isolated speech sounds.
The term, intelligibility was typically defined as the recognizability of a speech
stimulus (a basic speech sound, word, sentence). Listeners responded to the stimulus by
repeating it, writing it down, choosing it from alternatives offered, or stating that the
listener recognized it. Intelligibility tests are frequently called articulation tests,
discrimination tests, or recognition tests.
The earliest systematic attempts to measure speech intelligibility began in 1910
when Campbell established the first practical methods of evaluating telephone channels.
A sender read a list of nonsense syllables at one end of a telephone channel to a listener at
the other end. The receiver’s percent correct scores were used as a measure of the relative
intelligibility of the stimuli, which was used to determine the quality of the telephone
channel. The laboratories of the telephone organizations were dominant, and the most
conspicuous and important establishment was the Bell Telephone Laboratories (Bell
Labs).
Some of the earliest works at Bell Labs were concerned with the recognition of
the individual sounds of speech. Fletcher and Steinberg (1929) published the first major
paper on intelligibility testing although the authors use the term articulation testing in the
title. Fletcher and Steinberg used word and sentence stimuli for the same purpose. In
20. 12
addition, they recognized the potential value of these types of tests as measures of the
effect that a hearing impairment had on a listener’s speech perception abilities. Bell Labs
developed a framework for studying intelligibility to find the minimum bandwidth that
would allow phone conversation without greatly impacting intelligibility based on their
articulation theory, which continues to be very influential. This approach emphasized the
importance of frequency-specific information. This is where the emphasis on frequency
response and gain characteristics in evaluating communication system including hearing
aids began. Since then this tradition has dominated clinical and research approaches.
Limitations of Intelligibility Measures using Word Recognition
The use of an utterance (nonsense syllable, word, or sentence etc.) presented at
threshold and suprathreshold levels has been very common both in clinic and research
settings. However, there are some limitations in intelligibility measures using some of the
speech recognition tests. The limitations are related to the original purpose for which
intelligibility tests were developed and also related to psychometric nature of recognition
tests9
. The foundation of speech intelligibility measures were derived from work at Bell
Labs. It also contributed to audiology diagnosis in the use of short-length word lists to
assess speech recognition ability in the hearing impaired by developing the first recorded
auditory test which were presented via the Western Electric audiometer to determine an
individual’s hearing threshold for speech (Mendel & Danhauer, 1996).
Suprathreshold speech recognition testing has traditionally been done to estimate
the degree of hearing handicap or communicative functioning of the patient to determine
the anatomical site of lesion, to monitor progress in aural rehabilitation, and to assess
hearing aid performance (Silman & Silverman, 1997). The tradition of speech recognition
testing using monosyllabic words (typically with phonetically or phonemically balanced
word lists) in audiology originated from the Harvard Psychoacoustic Laboratory (PAL)
during World War II to evaluate military communication systems. Egan (1948)
constructed 20 PAL phonetically balanced lists, and each list consisted of 50
monosyllabic words. This battery was soon adapted for use in audiology and included
lists of nonsense syllables, phonetically balanced monosyllabic word lists, spondaic word
lists, and sentence stimuli.
Speech recognition tests have been used in many clinical and research contexts
and for a variety of purposes. Perhaps the most fundamental purpose of these tests is the
assessment of performance. Although the Bell Lab tradition of intelligibility measures
was efficient in evaluation of communication systems, there were limitations in
audiological applications, particularly in clinical practice. The use of a supra-threshold
speech recognition test at single intensity level and scored as percent correct has been
criticized from a variety of perspectives. The diversity of the criticism reflects both the
simplicity of the traditional approach and the complexity of speech recognition by the
hearing impaired (Walden, 1984). Although tests of speech recognition are used to test
9
The assessment of individual differences in any aspect of human behaviors involves two components:
observation and inference. When assessment involves formal measurement procedures, one is likely to be
concerned about the psychometric properties of the obtained scores such as norms and scales, validity,
reliability and measurement error etc (Demorest, 1984).
21. 13
sensory capacity of hearing impaired listeners, recognition testing is behavioral in nature
and therefore, involves subjective factors due to individual differences that can
significantly affect test results. This psychometric nature of speech tests should be
carefully considered and controlled in the development and administration of speech
materials for recognition testing.
Test validity, reliability, and sensitivity of some of speech recognition tests have
been often criticized. Validity is the verification that is the test procedure measures what
it is supposed to measure. The validity of speech tests is difficult to establish because of
the lack of understanding of how the entire speech perception processes work from the
sensory to central pathways. Furthermore, recognition based speech tests over-simplify
the listening processes. Recognition ability of single syllable words is far simpler to relate
to comprehending conversation and fluent speech in the real word. Understanding speech
involves more than recognizing a sequence of phonemes and words. To comprehend the
meaning of an utterance, the listener integrates the acoustic signal with other information
(phonological, semantic, and syntactic knowledge). A single speech recognition test may
be too simple to evaluate the impact of hearing loss on speech understanding and the
impact of signal processing on the communication ability of hearing impaired listeners.
Clinical speech recognition test results are not always highly correlated with real life
communication capability for individuals with hearing loss (Plomp, 1978).
Reliability is concerned with the accuracy of test measurement. Test-retest
reliability (which concerns the extent to which measurements are repeatable) within and
between subjects are typically used to measure a degree of test reliability. However, some
degree of error is involved in any type of measurement. Even in controlled
administrations, random error is present in speech recognition tests. Percent accuracy of
performance in word identification is commonly used to measure speech intelligibility.
Frequently, poor test-retest reliability is due to the binomial (correct or incorrect)
nature of recognition scores. These scores are based on percent correct scores in speech
tests as an index of performance accuracy. Therefore, test-retest reliability is directly
related to the total number of words used. In clinical practice, the presentation of half-
sized lists (i.e., 25 words) is often used to save time. As a result, there is a time and
reliability trade-off. As the number of words decreases, the variability increases
(Thornton and Raffin, 1978; 1980).
Although the test-retest reliability of speech tests have been improved by
following standard protocols, it is impossible to precisely replicate results because
random subject error cannot be completely removed. According to signal detection
theory, the obtained score on a given test reflects both the subject’s true ability and
internal noise. The noise originates from an individual’s internal state such as random
neural firing and cognitive factors (e.g., attention and arousal level). In addition, subject
biases and expectations influence the overall level of performance.
Intelligibility measures frequently lack sufficient sensitivity to be an accurate
measure of the quality of the signal to determine the effectiveness of signal processing
22. 14
schemes. For instance, high intelligibility scores in a recognition test are possible with
poorly specified speech (e.g., cochlear implant signals, sinusoidal replica of speech, pitch
shifted speech, or filtered signals). This is because of the difference between speech
intelligibility and comprehension. Although there is distortion in acoustic-phonetic
features of the target speech due to manipulation of an acoustic signal, comprehension of
that altered signal may not be affected because of top-down processes. Understanding
speech involves more than recognizing a sequence of correctly pronounced phonetic
words. The listener integrates the acoustic signal that specifies word recognition with
other prior knowledge (e.g., phonological, semantic, and syntactic information) to
comprehend the utterance’s meaning. Sounds perceived at the sensory register are not
simply transmitted to the cortex to decode. Listeners make sense out of what they heard
based upon their linguistic knowledge.
Additionally, the traditional approach based on the accuracy of performance does
not reflect the effort that is required for a given level of performance. One listener may
require more effort than another to achieve the same intelligibility score. For example, in
the case of two patients with the same recognition score, one may be able to use hearing
aids well but the other may not tolerate hearing aids and may decide not to use them
because of the extra effort required. Therefore, measures of attention and effort are as
important as measures of intelligibility. Increased processing demand due to distortion in
speech material may not be well reflected in measures relying solely on speech
intelligibility measures. For example, differences in speech quality may only show up in
test of increased listener effort.
Section III. Alternative Approaches: Attention & Effort
Cognitive Effects in Hearing (Top-down approaches)
During the first half of the 20th
century, hearing research primarily focused on
understanding sensory mechanisms and the psychophysics of hearing. Therefore, the
findings on auditory perception were mainly from masking and intelligibility studies.
This is because the prevalent research at that time created a framework in which
perception was understood as a sensory-based bottom-up experience. However, some
investigators were interested in the central effects of hearing. This work was influenced
by communication theories that emphasized the role of language. One example of
language effects in hearing was the finding that the probability of hearing words correctly
varies with the probability of that word occurring in the particular situation. Similarly, it
has been known that ordinary sentences are more often heard correctly than a
meaningless series of words (Fletcher, 1953).
Additionally, findings due to central processes in hearing were found in
experiments of binaural hearing and selective listening, which could not be explained as
purely sensory phenomena. When two messages arrived at once, listeners were limited in
their ability to process two messages. However, when listeners were instructed to focus
on one of the two messages based upon the voice of the speakers, the listeners could
selectively listen to the one message and successfully reported (Broadbent, 1952). Based
upon the selective listening experiments, it was generally agreed that to some extent two
23. 15
messages may be dealt with simultaneously if they convey little information, there is a
limit to the amount of information which a listener can process in a certain time
(Broadbent, 1958).
The theoretical explanation of capacity limitation and selective listening was first
attempted by Broadbent using the “filter theory” (a.k.a., “switch model”) of attention. In
one of the first attention theories that explained the relation between attention and
perception, Broadbent emphasized the importance of attention in information processing.
Some information must be discarded (or selected for further processing) when there is
more information present than a listener can handle at once. For the selection of
information, attention is a key component. The “switch model” was used to explain this
selective information processing (Broadbent, 1958). In this model, attention operates like
a switch and directs processing to one input message or channel. This message will be
fully analyzed for meaning and available to consciousness. However, unattended
messages are completely blocked or filtered. Broadbent suggested that the selection
process of further processing of information is based on the physical attributes of the
messages. For example, attention to various conversations at a cocktail party is controlled
by the voice qualities of the people conversing. Although the Switch Model is criticized
for complete rejection of unattended information and disregarding unconscious
processing, research on attention became popular in fields of perception and
performance.
The importance of cognitive processes on listening processes was also found in
synthetic speech research. It was found that the acoustic characteristics of synthetic
speech are very different from the acoustic characteristics of natural speech. The
naturalness of sound measured in subjective tests was also frequently reported along with
intelligibility. In some cases the synthetic speech was similar to natural speech in terms
of intelligibility; however, the same speech differed substantially in terms of naturalness.
It was assumed that human beings are information processors with limited
capabilities but they are extremely flexible in their ability to access higher levels of
information in sophisticated ways (Pisoni, 1982). Evidence from the synthetic speech
studies suggested that listeners do not process speech passively, but they use active top-
down processes. Listeners can understand speech under conditions with ambient noise or
information overloading, as may exist in a degraded signal such as synthetic speech.
Therefore, large acoustic changes may show only small comprehension changes due to
the effects of higher-level processes. So, a listener’s real performance cannot be precisely
predicted based only on the intelligibility measured from a given test. Considering the
cognitive effect on listening processes, Pisoni (1982) argued that a listener’s overall
performance in a given task or situation is constrained by three factors: 1) processing
limitations of the cognitive system; 2) fidelity of the speech input; and 3) specific task
demands of the human observer.
The first constraint occurs because in order to process constantly changing speech
information, acoustic energy must be integrated over time. However, humans have
processing limitations in the capacity (typically short-term memory, STM) to perceive,
24. 16
encode, and store in a sensory register until the retrieval of information from long-term
memory. The STM is severely limited by the listener’s attentional state, his past
experience, and the quality of the sensory input. However, constraints on STM can be
overcome by the use of redundancy in spoken language and the listener’s access to
several difference sources of knowledge.
The second constraint is based on the structure of speech signal. However, the
fidelity of speech input can be compensated by comprehension. Note that intelligibility is
different from comprehension. Intelligibility may be defined at many levels such as the
phone, phoneme, syllable, diphone, word, and sentence. Comprehension of speech
arranges these units into meaning by linguistic rules that listeners predict arrangement of
sounds based on phonological rules, or predict words to come next based upon semantics
and syntax.
The last constraint is based on task demands. Humans are capable of developing
perceptual and cognitive strategies to maximize performance under different task
conditions. Here are a few examples for humans’ flexibility in using different strategies
in the real world. In the case of telephone directory assistance, listeners focus heavily on
phonetic information for phone numbers and street names that they are unfamiliar with.
However, in the case of a conversation, listeners focus more on the topic of the
conversation than phonetic details. Humans are capable of adopting different strategies
depending upon the needs of the tasks presented to them. Therefore, study of these
strategies is crucial in evaluating the effectiveness of any hearing devices designed for
human listeners.
Based upon the argument about the constraining factors on intelligibility
performance, Pisoni and colleagues adopted additional methods such as lexical decision
task, naming latencies, memory preloading, and free recall tests in addition to
intelligibility measures at different levels of speech using sense and nonsense speech. The
relation between processing capacity and intelligibility performance was observed in a
series of experiments comparing synthetic speech and natural speech. It was found that
with gross intelligibility measures such as phoneme recognition tests and sentence
recognition tests, there was little or almost no difference between synthetic and natural
speech in recognition abilities. However, difference between synthetic and natural speech
was only apparent in a cognitively stressful condition. For example, a listener’s
performance on poor quality speech was reduced in short-term memory although words
were correctly understood. Therefore, even when there was a large change in
intelligibility, the resulting change in comprehension was small because of listeners’
higher level information processing. Poor quality speech also reduced comprehension
only when the listener’s processing capacity was overloaded by requiring the
memorization of unrelated material.
In the case of synthetic speech processing, due to cognitive effort in the
perception of degraded speech, certain measures of intelligibility were not greatly
impacted. This implied the limitation of relaying on one criterion (e.g., intelligibility) in
evaluation of speech signals processed through communication systems. However, the
25. 17
additional processing requirements in synthetic speech resulted in overloading processing
capacity. This was reflected by increased capacity demands in short-term memory tests
and processing time measures.
Pisoni and colleagues’ experiments demonstrated the cognitive effects in speech
perception, which made it difficult to evaluate the potential effectiveness of speech signal
processing due to the change in signal quality. Therefore, it was concluded that
intelligibility performance measured solely without processing capacity is only a gross
measure of speech quality and a cautious interpretation of intelligibility results was
required.
Such awareness of cognitive effort in speech perception has prompted the
development of the alternative methods to study the impact of noise or hearing loss on
processing capacity in relation to attention and memory. The use of reaction time
measures, short-term memory tests, and dual-task performance were adapted by some
researchers to measure processing difficulty due to hearing loss or due to change in signal
quality.
Dual-task Performance and Listening Effort
The use of dual-task paradigms to measure listening effort due to increased
processing demands is based upon theories of attention and capacity limitation. Humans
have a limited capacity for processing information and any task that requires capacity
will interfere with any other task that also requires some capacity.
The relationship between performance and effort was first discussed by Broadbent
(1955, 1958) based upon his observation that similar speech intelligibility scores could be
obtained under various conditions at the expense of unequal amounts of effort exerted by
the listeners. Broadbent suggested that a listener who can correctly report words
presented over a degraded circuit might be less competent if he is required to
simultaneously perform another unrelated tasks. This was demonstrated by using a
simultaneous tracking task to assess communication channels (Broadbent, 1955). It was
found that there was a decrement in the simultaneous tracking task10
when subjects were
listening to frequency-transposed speech but no decrement in the tracking task when
subjects were listening to filtered speech. The difference between filtered speech and
frequency-transposed speech was reflected in the secondary tracking task when there was
no difference in performance on the primary listening task. Based upon these findings,
Broadbent (1958) concluded that intelligibility tests did not differentiate listening effort
from overall intelligibility performance and therefore, a different technique should be
applied to separate the component of effort from the given intelligibility level to precisely
assess communication channels. Additionally, Broadbent emphasized the importance of
considering multiple criteria such as listening effort along with intelligibility measures.
10
This tracking task is known as the triple tester (See Eysenck, 1947). A wavy line of brass contacts passed
rapidly beneath pointer whose position was controlled by the position of a hand-wheel. The line was
screened from the subject’s eyes until just before it reached the pointer, So that keeping the pointer on the
line of contacts required continual attention. The scores is the number of contacts touched in any run
(Broadbent, 1958)
26. 18
The relation between performance and effort was refined by Kahnemen’s
“Channel capacity” theory (1973). According to this theory, channel capacity is
controlled by attention but is a limited resource and therefore, for multiple tasks, attention
must be allocated based upon processing demands of each task. For example, if a listener
is given two tasks (as primary and secondary) simultaneously, the attention requirements
may exceed the total available capacity. Therefore, the amount of effort invested in a
primary task can be assessed by viewing performance on a secondary task. Kahnemen
(1973) stated three ways in which task performance can break down. Firstly, as task
difficulty increases, greater effort is required for comparable performance, and if effort is
not adequately supplied to meet task demands, the result will be performance
deterioration. Secondly, performance can falter because effort is allocated to performance
of other activities. Finally, performance breakdown occurs when signal input
characteristics are insufficient to attract attention.
Dual-task Techniques
In an information-theory framework, in order to recognize degraded speech,
listeners have to use spare channel capacity, which they could otherwise distribute
between two tasks so as to maintain efficiency on both (Rabbit, 1968). Many experiments
have shown that two unrelated tasks might compete to preempt a single channel of
limited capacity. Several different paradigms have been developed and have been
successful in measuring listening effort and processing demands.
Dual-task paradigm using a motor-function based task. This technique uses a
light or tone presented by an experimenter at various intervals during performance of a
primary task. The subject was asked to turn the probe signal off as rapidly as possible. A
measurement can be made of elapsed time form probe onset until it is turned off by the
subject. Depending on the relative length of reaction time, a judgment is made of the
processing demands of the primary task. That is, longer reaction time indicates greater
processing demands of this task. Downs and Crum (1978) used a dual-task paradigm
using probe reaction time and demonstrated the effectiveness of the dual-task paradigm in
quantifying processing demands under degraded listening conditions. The primary task
was to repeat spondee words presented at 50, 35, and 20 dB SL. The secondary task was
to push a button in response to randomly presented visual stimuli. The word recognition
performance without competing noise and the word recognition performance with
competing noise were compared. There was no change in word recognition due to
introduction of noise, but resulted in a significant increase in reaction time responding to
a visual stimulus. Downs and Crum concluded that addition of noise resulted in increased
reaction time because more attention was expended to process a degraded signal
presented in competing noise. Downs and Crum proposed the potential value of
measuring attentional demands in evaluation of the listening conditions in educational
settings or in hearing aid selection.
The success of using a dual-task in measuring processing demands motivated a
subsequent study conducted by Downs (1982). Effects of hearing aid use on speech
discrimination and listening effort were investigated. Speech discrimination testing was
conducted with and without hearing aid use, and at the same time, a probe reaction time
27. 19
was measured to assess listening effort. The results indicated that the use of hearing aids
improved speech discrimination and reduced listening effort in hearing impaired
individuals.
The same dual task paradigm using the probe response technique was used in
school-age children with and without hearing loss to measure listening effort. The
primary task was an open-set verbal repetition of monosyllabic words (using Phonetically
Balanced-Kindergarten word lists) presented in a 20-talker speech babble noise (Hicks &
Tharpe, 2002). The words were presented at signal-to-noise ratios of +20, +15, and +10
dB. Average speech recognition scores were good for both normal and impaired children.
However, the children with hearing loss had longer reaction times than the children with
normal hearing in response to the probe light. This indicated that children with hearing
loss expend more effort in listening than children with normal hearing. Additionally, the
effectiveness of dual-task paradigms in measuring listening effort was once more
demonstrated in children with hearing loss.
Dual-task paradigm using short-term memory tasks. Another common dual-task
technique has been used in previous studies to measure processing demands with short-
term memory testing. Short-term memory is involved in both storing and processing
information. The connection between short-term memory and speech understanding was
explored using a memory recall test. Listening to degraded speech may deplete more of
the available capacity and leave fewer resources free for remembering or manipulating
the speech input. Or, difficulty understanding the stimuli may result in a poorer
representation of the items in memory. Therefore, how effortful understanding speech
may be for someone who must devote more attentional and processing resources to
perceiving the message could be measured through short-term memory tests. Rabbit
(1966) used a digit recall testing method to determine whether items that are difficult to
recognize are also less easy to remember. He found a decrease in recall of digits due to
noise and interpreted this result as demonstration of increase difficulty of recognition of
speech through noise may interfere with other activities.
Another study (Luce, Feustel, & Pisoni, 1983) used word recall as a primary task
and digit recall as a secondary task. The secondary task employed was based on a
memory preload technique originally developed by Baddeley and Hitch (1974). This
technique asks subjects to remember a short list of items throughout the primary word
task. Baddeley and Hitch found this technique to be useful in assessing short-term
memory demands for such primary tasks as reasoning, sentence comprehension, and free
recall. Luce et al. presented digits on a CRT screen and the subjects were asked
remember the digits in the exact order, and then a list of words were presented aurally.
Word recall and digit recall were measured to determine if the synthetic words would
place increased capacity demands on encoding and/or rehearsal processes in sort-term
memory when the subjects were simultaneously engaged in another task requiring
processing capacity in short-term memory. It was found that synthetic speech resulted in
a decreased performance in the secondary digit recall task because more capacity was
allocated to the primary word recall for encoding and rehearsal of synthetic speech. In
other words, due to the limited processing capacity of short-term memory in human
28. 20
information processing, less memory capacity was expended for the secondary digit
recall while the more memory capacity was allocated to the primary word recall task due
to increased processing demands required for synthetic speech.
Dual-task paradigm using cognitive secondary tasks. Another of the dual-task
paradigms used was the primary recognition task with secondary distractor using
cognitive tasks. Gordon et al. (1993) used the primary phoneme identification task along
with the secondary arithmetic task to measure the relative importance of speech cues and
discussed the role of attention in phonetic labeling. The primary task was to identify the
speech sounds as /βΑ/ or /πΑ/. The secondary task was to decide whether the difference
between the first and second numbers was the same as the difference between the second
the third numbers. In the distinction between /βΑ/ and /πΑ/, voice onset time (VOT) and
the onset frequency of the fundamental (F0) are crucial acoustic cues to the voicing
distinction between the consonants /β/ and /π/. VOTs are short (0 to10 ms) for voiced
consonants like /β/ while VOTs are long for voiceless sounds like /π/. In addition, voiced
consonants tend to have a lower onset frequency of F0 than do voiceless consonants. It
has been argued that VOT has a stronger effect than onset F0 in perceptual judgments of
voiced consonants (Lisker & Abramson, 1964). Thus, Gordon et al. used these two cues
to examine the relative importance of phonetic cues under different levels of attention by
using dual-task paradigms. It was found that when the subjects were distracted by the
secondary arithmetic task, the contribution of the weak acoustic cue (onset F0) on
identification of /βΑ/ and /πΑ/ was increased while the impact of VOT was reduced. It
was concluded that the importance of the weak cue increased when the attention was
expended to the secondary distracting task because less careful attention was required for
processing onset F0 compared to VOT in identifying /βΑ/ and /πΑ/.
Factors Affecting Dual-task Performance
Although many different dual-task paradigms have been used for measuring
processing demands and listening effort, it has been found that some dual-task paradigms
are more effective than others. There is body of research on attention and dual-task
methods to investigate the mental capacity and mental structure. It has been found that
humans can do some simultaneous tasks better than others without interfering another
concurrent task. Success and failure of dual-task performance have been discussed in
relation to the level of interference by a secondary task chosen. Several factors affect the
overall interference level by a secondary task: task similarity, task difficulty, and
automaticity due to practice (Eysenck & Keane, 1995).
First, similarity affects dual-task performance. According to modular theories and
multiple resource theories, attention is composed of a set of processors or modules, each
with their own pool of limited resources, one for visual, one for auditory, on for motor
coordination. Tasks will compete whenever they have to share the same attentional
resource (modality). The more similar two tasks are, the higher interference is.
Interference due to the similarity between two tasks can be evaluated by overlaps in
processing stages such as input mode, processing mode, and output (response) mode
(Wickens, 1992, Wickens, Sandry, & Vidulick, 1983; Wickens, 1984; Navon, 1985;
Duncan, Martens, & Ward, 1997; Johnston, & Heinz, 1978; Allport, 1989). For example,
29. 21
listening to a book on a tape while driving is possible but reading a book is almost
impossible because reading and driving both requires visual attention. Although two tasks
are very dissimilar from one another like driving and talking on the phone, when driving
gets hard, talking slows.
The ability to perform two tasks together also depends on their difficulty. The
harder it is to do tasks, the more likely they are to interfere. The influence of task
difficulty on dual-task performance was shown in shadowing experiments (Sullivan,
1976). When subjects have to shadow a message in one ear and detect target word in the
other ear, fewer targets are detected when the message to shadow is a complex one. This
finding favors central capacity theories that assume there is some central capacity, which
can be used flexibly across activities (Johnston & Heinz, 1978). The extent to which two
tasks can be performed together depends on the demands that each task makes on those
resources. If the combined demands of the two tasks do not exceed the total resources of
the central capacity, the two tasks will not interfere with each other. However, if the
resources are insufficient to meet the demands place on them by the two tasks, then
performance disruption is inevitable. Therefore, the crucial determinant of dual-task
performance is the difficulty of the two tasks.
Finally, automaticity can also affect dual-task performance. Automaticity can be
developed as a result of prolonged practice. Automaticity is created by overlearning a
task. It occurs after tens of thousands of trials (Shiffrin & Schneider, 1977). If one task
becomes automatic, it does not require attention, and leave resources for other tasks;
other tasks can be performed simultaneously with an automatic task. We can find the
example of practice effects from the real everyday example that student drivers find it
difficult to drive and hold a conversation, but expert drivers find it fairly easy because
driving has become automatic. Therefore, it is important to compare several different
types of dual-tasks, to study attention and task load in speech perception.
30. 22
CHAPTER III
Project Overview
Rationale & Statement of the Problem
Intelligibility measures based on speech recognition testing were originally
developed to determine the effectiveness of communication systems. Soon after they
were adapted to audiology to evaluate the integrity of the auditory system and estimate
the communication ability resulting from a given degree of hearing sensitivity loss
(Mendel & Danhauer, 1996). In addition, intelligibility measures are commonly used to
determine the appropriate characteristics for hearing aid fitting strategies or validate the
appropriateness of signal processing techniques applied in hearing instruments.
Intelligibility measures are often compared with and without hearing aids to measure
their benefit. Although the traditional intelligibility approach has been well accepted by
many clinicians and researchers, it has also been criticized for low sensitivity in detecting
signal quality. Intelligibility measures have also been shown to have low validity in
predicting communication ability in real life even after the reliability of a test is well
controlled (Walden, 1984).
Despite their drawbacks, traditional intelligibility measures have been the primary
technique used to evaluate hearing aid benefit. In fact, most compression studies have
used a performance-based intelligibility measure as testing criteria. However, the percent
accuracy of performance from a test measuring intelligibility is not a simple indicator of
the intelligibility that is produced by the physical attributes of the target stimuli. Rather,
the resulting performance in a given intelligibility test is a combined result of stimulation
at the sensory organ caused by the acoustic signal with a certain physical characteristics
and judgment based on sensory input that is modified or reconstructed to find a best
match and compare with the pattern stored in the long-term memory (Pisoni, 1982). The
resulting performance in a speech intelligibility test is a combination of sensory and
central processes of the incoming information. For instance, when the input at the cochlea
is clear and has no ambiguity underlying in the signal, our comprehension of the stimuli
may be similar across listeners. However, when the input is unclear due to noise or
hearing impairment and has a higher level of ambiguity, the output response can be more
diverse than and not as universal as in the case of a clear and unambiguous signal. When
there is higher level of ambiguity involved at the input stage, internal resources can play a
significant role and influence the output at the higher stage. Listeners use more cognitive
processing to make best sense of what they received at their sensory organs to understand
a message (Pisoni, 1982). Information processing models of speech perception posit that
listeners use prior linguistic knowledge to fill in the missing information in the original
signal reached at their ears. These additional processes require resources to temporally
hold the information until all the processes are finished for the complete comprehension
of the message. However, there are limitations in storage of incoming messages for
further processes. The storage space runs out when too much simultaneous information
must be processed. Since we cannot directly measure the many processes employed by a
listener to understand an ambiguous message, we must indirectly estimate the processing
demands by measuring how much attention is exerted to achieve a given level of
performance. With traditional intelligibility performance measures, these differences in
31. 23
processing demands may not be measured. This is because increased processing demands
may result in increased processing effort and still may not affect performance but may
cause mental fatigue after a while listening to the distorted speech. Increased processing
demands caused by a hearing-aid processed signal may be as important as to how much
hearing impaired individuals can understand the message especially for older people with
decreased processing capacity, or students in the classroom with novel information to
process.
Intelligibility alone is insufficient to understand how a signal processing
technology such as compression, is used by listeners. Other criteria need to be considered
and developed to study the perception of speech signals. For this reason, adding listening
effort as another dimension may help us to determine the proper processing schemes for
hearing aids.
In this study, a non-speech intelligibility-based measure focusing on increased
processing demands as indication of increased listening effort was explored to evaluate
the efficacy of compression.
Overall Purpose
Due to the limitations of intelligibility measures, an alternative method was
sought to add to the traditional speech intelligibility measures. To evaluate the acoustic
change in speech due to compression, listening effort was considered as an additional
measure of speech quality.
The two experiments were conducted to measure listening demands. The first
experiment used a dual task paradigm with an intelligibility task and a visual motor task.
The second experiment used a dual-task paradigm with an intelligibility task and a
linguistic task. The two different secondary tasks were used to investigate what type of
simultaneous task would better evaluate the processing of compressed speech.
Hypotheses
1. Increased processing demands due to compression-based temporal envelope
distortion in speech are not well reflected in performance in speech recognition
tests due to cognitive intervention (i.e., top-down processes) & redundant cues.
2. An increase in processing demands due to compression will be reflected as
decreased performance in a dual-task as an indication of increased listening effort.
3. A linguistic secondary task will interfere more strongly with listening than a non-
linguistic secondary task.
Research Questions
The following questions were asked to test the effect of compression on
processing demands and speech intelligibility in the series of two experiments
Experiment I
1. Is there a decrement in word recognition during a dual-task procedure for
compressed versus linearly processed words?
32. 24
2. Is there a decrement in a non-linguistic (low-interference) secondary task
during a dual-task procedure for compressed versus linearly processed words?
Experiment II
1. Is there a decrement in word recognition during a dual-task procedure for
compressed versus linearly processed words?
2. Is there a decrement in a linguistic (high-interference) secondary task during a
dual-task procedure for compressed versus linearly processed words?
Overall
1. Is there a decrement in the dual task performances due to compression?
2. Is there a difference in a decrement for the secondary task performances
between the linguistic task and non-linguistic secondary task?
33. 25
CHAPTER 4
Experiment 1
Dual-task paradigms have been used to investigate the effects of a signal degraded
due to noise, signal processing (e.g., filtering, frequency transposition, synthetic speech,
peak clipping), and hearing loss (Broadbent, 1955; Downs and Crum, 1978, Downs 1982;
Pisoni, 1982, 1983; Mackerise et al. 2000; Hicks & Tharpe, 2002) on speech perception,
especially when the performance in speech recognition tests is not greatly affected
because of compensatory listening strategies (i.e., listening effort). Typically, decreased
secondary task performance has been interpreted as an indication of increased listening
effort due to increased processing demands often required for a degraded speech signal.
Due to conflicting intelligibility results in compression studies, a dual-task
performance experiment was employed in the present experiment along with traditional
speech intelligibility measures. The pattern of results should indicate whether or not
distortion in temporal envelopes resulted in increased listening effort.
In Experiment 1, a dual-task procedure was constructed using an auditory word
recognition task as the primary task and visual motor tracking as the secondary task. The
(primary) word recognition task required verbal repetition of monosyllabic words
presented at a comfortable loudness level though headphones. The (secondary) visual
motor task was a computerized version of Pursuit Rotor that required constant hand and
visual coordination to track a moving target. The secondary task was chosen because it
was somewhat similar to simultaneous tasks in the real world such as driving a car or
dialing a telephone.
Dual-task performance was compared with single-task performance to study the
effect of amplitude distortion on speech perception. A second goal was to measure the
effect of compression as well as to evaluate the effectiveness of the dual-task paradigm
using a visual-motor tracking task (in this case Pursuit Rotor). Additionally, a
compressed signal was compared with a linear signal to measure the effect of temporal
envelope distortion resulting from compression on listening effort.
Method
Participants
Two groups of thirty-two adults participated in Experiment 1. All participants
were listeners with normal hearing, and spoke English as their primary language. There
were 60 females and 4 males, and participants’ age ranged from 19 to 55 years with a
mean age of 27. Participants were primarily recruited from students attending classes in
Communication Disorders and Special Education Program at the University of Nebraska-
Lincoln. Due to the use of a computer for one of the experimental tasks, prior computer
experience was assessed by a questionnaire. All participants reported some degree of
computer knowledge and regular computer use either at home or work.
34. 26
Experimental Tasks
Two tasks were employed for the dual-task procedure: an auditory word
recognition task and a visual motor tracking task. The auditory word repetition task was
the primary task and was used to measure the intelligibility of linear and compressed
speech. The visual motor tracking was the secondary task and was used to increase the
working load in the dual-task condition. In order to measure performance in both the
primary and the secondary tasks, the experimental session included three phases: the
auditory task alone, the visual motor tracking task alone, and the auditory and visual
motor tracking task together. Therefore, performances in the auditory task were
compared when performed alone versus when performed simultaneously with the visual
motor task. Correspondingly, the same comparison was made for the performances in
visual motor task between single-task performance and dual-task performance.
Auditory task
For the measure of word intelligibility, an auditory word recognition task was
used. It required each participant to repeat a word that was presented auditorily. The
auditory task contained a total of 100 trials. The auditory task was administered in two
experimental conditions. In the single condition, the auditory task was completed alone.
In the dual condition, the auditory task was completed simultaneously with the visual
motor task.
Materials. Monosyllabic words produced in isolation were used for the auditory
word recognition task. Two hundred words were adopted from the Modified Rhyme Test
(MRT; House et al., 1965) to construct two lists comprising of 100 words each (See
Appendix A). The phonemes occurring in the two word lists were approximately
matched. The lists were used for both the auditory word repetition task alone (single-task
condition) and the auditory task along with visual motor tracking task (dual-task
condition). The MRT words had previously been recorded in the Speech Perception
Laboratory at UNL and were readily available in a digital format. The voice used in the
MRT recording was that of a 49 year-old male taker with a General American English
dialect. All words were digitally recorded at a sampling rate of 44.1 kHz using a Sony A7
Digital Audio Tape (DAT) recorder. Recorded monosyllabic words were digitally
transferred to a computer using the SP/DIF format. The digitally transferred recordings
were segmented into individual words and saved to a Windows .wav file format using
Sound Forge 4.0e (Sonic Foundry, 1998).
Construction of auditory stimuli. Two types of stimuli were created for auditory
word repetition: compressed words and linearly processed (uncompressed) words. The
uncompressed words were created first. Individually segmented sound files containing
monosyllabic words were equilibrated to 72 dB RMS (re: 96 dB digital peak) using the
program Level (Tice and Carrell, 1998). In order to prevent a ceiling effect in the
auditory recognition task, words were individually mixed with a speech shaped noise at a
+6 dB signal-to-noise ratio using Cool Edit 2000 (Syntrillium Software, 2000). An
additional 10 milliseconds of noise was inserted before the beginning and after the end of
the word to prevent potential artifacts (unrelated burst cues). The waveform of a
35. 27
monosyllabic word and the waveform of speech shaped noise are shown in upper panel of
Figure 2 and the waveform of the word combined with the noise shown in lower panel of
Figure 2.
37. 29
The set of words mixed with noise were used to create the set of compressed
words. A single-channel wide dynamic range compression scheme was used for
compression. The compression parameters were a compression ratio of 4:1, kneepoint of
40 dB, and the attack time of 5 ms and the release time of 15 ms. The input-output
function of compression is shown in Figure 3.
The waveform sample of a compressed word is displayed with its corresponding
linear waveform in Figure 4.
A. Linear
B. Compressed
Figure 4. Panel A shows the waveform sample of a linear word, ‘Seep’, and Panel B
shows the waveform sample of a compressed word, ‘Seep’.
38. 30
Due to a general reduction in amplitude after compression, the RMS levels of
compressed words and uncompressed words were re-equilibrated at a 72 dB using the
Program Level 16 (Tice & Carrell, 1998).
The sampling rate of all the stimuli was converted from 44.1 kHz to 22,050 kHz,
and low-pass filtered at 8.5 kHz with an anti-aliasing filter to approximate the frequency
range that current high-end digital hearing aids can provide.
Calibration of the stimuli was accomplished through the use of a Bruel & Kjaer
Type 1624 Sound Level Meter. The stimuli were routed to Sennheiser-HD 520II
circumaural headphones with the left phone coupled to a 6 cc coupler by a 500-gram
weight using a flat plate coupler. When a 80 dB 400 Hz pure tone was played, 104.7
millivolts was measured. This was equivalent to 72 dB SPL of a stimulus word at the
participant’s headphones.
Auditory task set-up. For presentation of spoken words, a Tucker-Davis
Technologies (TDT) modular audio hardware experiment control rack and a Window-
based computer were used. The IDRT (Identification Reaction Time) experiment control
program (Tice & Carrell, 1998) was used to control the experiment. The stimuli were
delivered binaurally through open-air circumaural headphones. The words were presented
to the listeners at approximately 72 dB SPL. A push button, which was connected to a
PI2 smart port, was used by the experimenter to initiate each trial after a subject’s verbal
response. A cassette tape recorder was used to record a subject’s verbal responses.
Visual motor task
A visual motor task was employed to increase processing load in the dual-task
condition. The visual motor task was conducted alone in the single-task condition, and it
was conducted simultaneously with auditory word recognition task in the dual-task
condition. The type of a visual motor task used in this experiment was a computerized
version of a traditional motor control task named “Pursuit Rotor” that required constant
vision and hand coordination. Although the pursuit rotor task is still available in a
traditional format with a metal stylus in contact with a metal disk, the computer version
was employed in the present work.
Pursuit rotor. The computer version of Pursuit Rotor (Dlhopolsky, 2000) was
used in this experiment as the secondary task. The pursuit rotor task has been used
primarily for the study of motor learning in psychology (Wing & Ammons, 1949; Bourne
& Archer, 1956; Ammons, Ammons, & Morgan, 1958; Ammons & Ammons, 1969;
Frith, 1968; 1971; Freischlag, 1974; Friedman et al., 1985; Kern et al., 1997; Raz et al.,
2000). Pursuit Rotor is a visual motor tracking task that requires the subject to follow a
target (a moving dot on the track displayed on a computer screen) using a mouse.
Performance is typically expressed as percentage of total time on target (TOT). The
program keeps track of errors and time-on and time-off target. Graphic and text set-up
screens permit the selection of track shape, track width, target size, color, and direction of
target, revolutions per trail, number of trials and inter-trial pacing, and feedback.
39. 31
Pursuit rotor set-up. The Pursuit Rotor program was installed on a Dell
Dimension XPS T 500 with Intel Pentium III processor and Windows 98. The measured
diagonal size of monitor used was 18 inches. The screen resolution was set to1024 by 768
pixels with 32-bit true color. The track shape (Dimensions in pixels are X min: 30, X
max: 630, Y min: 20, Y max: 420) used is shown Figure 5. The track width was 11, and
the track color was pink (8000FF). The size of target (dot) was 31 (Target size: 11-30),
the target color was blue (FF0000). The speed of the target was set to 6 RPM and the
direction of target revolution was clockwise. There were total of 13 trials per condition.
Each trial consisted of 3 revolutions. The inter-trial pacing was set as 0 second. The
percent time on target was recorded by the program and the data were automatically
saved in a text file format.
Figure 5
Procedure
Each subject’s hearing was screened at 20 dB HL at .5, 1, 2, 3, and 4 kHz prior to
inclusion in the experiment groups. Once hearing status was met, a questionnaire
(Appendix B) was given to collect demographic information and computer experience.
Written instructions (Appendix C) were given to subjects. Before initiation of the
experiment, all subjects were familiarized with Pursuit Rotor tracking using a mouse.
Each participant performed a total of 3 experimental conditions: recognition alone,
Pursuit Rotor alone, and word recognition and Pursuit Rotor together. The orders of
conditions were previously determined for counterbalancing purposes. For word
recognition, participants were presented with either compressed or uncompressed words
40. 32
based upon their group assignments. After all 3 experimental conditions were finished, a
post-test questionnaire (Appendix D) was administered. Figure 6 shows a subject
performing auditory recognition and Pursuit Rotor simultaneously and the experimenter
transcribing the subject’s verbal responses.
Figure 6
Research Design
A 2×2×2 full factorial (compression by task order by word list) design was used.
The between group factors were compression, word list, and dual-task order. The
between group factors had two levels each. The compression-factor consisted of one
group presented with compressed words and a second group (or no-compression group)
presented with uncompressed words. The word list-factor was one group presented with
List 1 for the simultaneous task and presented with List 2 for the non-simultaneous task
and the other group presented with List 2 for the dual-task and List 1 for the single-task.
The dual-task order factor was one group who performed the dual-task first and
performed the single-task second, and the other group who performed the tasks in reverse
order. Figure 7 shows a diagram of the experimental design.
41. 33
Between
Group
Factor
Compression
factor
Task order
factor
Word list factor n
List 1 8
Single first
List 2 8
List 1 8
Group 1 Compression
Dual first
List 2 8
List 1 8
Single first
List 2 8
List 1 8
Group 2
Linear
(No-Compression)
Dual first
List 2 8
N 64 64 64 64
Figure 7
Data Scoring and Analyses
Calculation of intelligibility was based upon percent words correct. Subjects’
verbal responses were transcribed online by the experimenter, and at the same time they
were tape-recorded for offline transcription. Recordings of subjects’ responses were
transcribed offline by graduate assistants. Online and offline transcriptions of each
subject’s responses were compared with target stimuli, and correct responses were
counted. If there were disagreements between online and offline transcriptions,
disagreements were discussed for one final best answer. In order to determine if there
was a change in word recognition performance between the dual-task condition and the
single-task condition, a difference score was calculated by subtracting the percent correct
words for simultaneous word recognition from the percent correct words for non-
simultaneous recognition.
Percent time on target was used to measure the accuracy of performance in
Pursuit Rotor. Percent time on target was automatically calculated and saved by the
Pursuit Rotor program. Pursuit Rotor data were saved in a text file. The data in a text file
were transferred into a Microsoft Excel spread sheet, and saved as an Excel file. The
average percent time on target for all trials was calculated. In order to compare the
difference between the simultaneous Pursuit Rotor condition with the non-simultaneous
Pursuit Rotor condition, a difference score was calculated as well.