Mathematical Statistics with Applications in R 2nd Edition Ramachandran Solut...
Statistics-assignment_ldp_609_2014_22 (1)
1. UNIVERSITY OF NAIROBI
MASTER OF ARTS IN PROJECT PLANNING AND MANAGEMENT
LDP 609: STATISTICAL METHODS
ASSIGNMENT FOR DLM STUDENTS
______________________________________________________________________________
Instructions:
1. Answer ALL questions.
2. Ensure that the assignment is submitted before sitting the final examination. No
assignment will be accepted after this.
QUESTION ONE
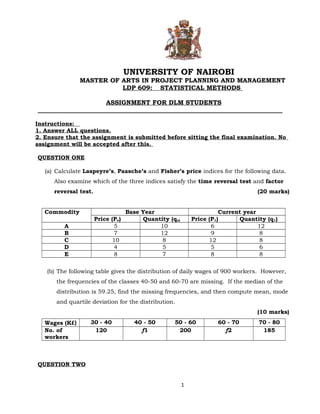
(a) Calculate Laspeyre’s, Paasche’s and Fisher’s price indices for the following data.
Also examine which of the three indices satisfy the time reversal test and factor
reversal test. (20 marks)
Commodity Base Year Current year
Price (Po) Quantity (qo) Price (P1) Quantity (q1)
A 5 10 6 12
B 7 12 9 8
C 10 8 12 8
D 4 5 5 6
E 8 7 8 8
(b) The following table gives the distribution of daily wages of 900 workers. However,
the frequencies of the classes 40-50 and 60-70 are missing. If the median of the
distribution is 59.25, find the missing frequencies, and then compute mean, mode
and quartile deviation for the distribution.
(10 marks)
Wages (K£) 30 - 40 40 - 50 50 - 60 60 - 70 70 - 80
No. of
120 f1 200 f2 185
workers
QUESTION TWO
1
2. (a) The following table gives the distribution of wages in K£ in three branches of
Mawingu factory.
Daily wages (K£) No. of workers
Branch A Branch B Branch C
10 – 15 14 15 12
15 - 20 18 22 20
20 – 25 20 26 32
25 – 30 23 10 11
30 - 35 10 12 10
(i) Based on the mean wage, which branch pays the higher average wage?(5
marks)
(ii) Which of the three branches has the greater variability in wages? (10
marks)
(iii) Determine the values of the combined mean and combined standard deviation
for
Mawingu factory. (6 marks)
(b) The mean annual salaries paid to all employees of a company was K£500. The
mean annual salaries paid to male and female employees were K£520 and
K£420 respectively. Determine the percentage of males and females employed by
the company. (3 marks)
(c) The following table gives the distribution of marks obtained by 50 students.
Marks 0 - 10 10 - 20 20 - 30 30 - 40 40 -50
No. of students 6 8 20 9 7
(i) If the cut-off point was 34, find the percentage of students scoring more than
34 marks. (3 marks)
(ii) Calculate D4 and comment. (3 marks)
QUESTION THREE
(a) The following incomplete table gives the number of students in different age
groups of a town. If the median of the distribution is 11 years, find the missing
frequencies, then compute Q3, P15, D6, for the distribution. (10 marks)
Age group 0 - 5 5 - 10 10 - 15 15 - 20 20 - 25 25 - 30 Total
No. of students 15 125 F1 66 F2 4 300
(b) The following table shows saving bank deposits and strikes and lock-outs over a
period of seven years.
Saving Bank Deposit
(Ksh. Millions)
51 54 56 59 65 60 70
Strikes and lock-outs
38 44 33 36 33 23 13
Compute the Karl Pearson Correlation Co-efficient and comment. (6 marks)
2
3. (c) From the following table, compute the spearman Rank correlation co-efficient and
comment. (6 marks)
Output of
cars(‘000’)
3.5 4.2 5.6 6.5 7.0 8.2 8.8 9.0 9.7 10
Cost per car
(K £ ‘000’)
9.8 9.4 8.8 8.4 8.3 8.2 8.8 8.0 8.0 8.1
(d) There are 50 students in a class of which 40 are boys. The average weight of the
class is 44kgs. And average weight of the girls is 40kgs. Find the average weight
of the boys. (3 marks)
(e) Find the value of P for the following distribution whose mean is 16.6, and then
compute its standard deviation. (5 marks)
X 8 12 15 P 20 25 30
f 12 16 20 24 16 8 4
QUESTION FOUR
(a) The length distribution of widgets manufactured by Mombasa industries ltd. If
normally distributed with mean 100cm and variance of 64cm. if the firm produces
10,000 widgets per month, how many widgets would be a length of:
(i) Less than 92cm
(ii) More than 120cm
(iii) Between 86cm and 96cm
(iv) Between 84cm and 112cm (6 marks)
(b) The scores of students in a test are as follows:
35 50 30 40 42 49 60 65 60 55
50 40 45 35 38 30 50 45 50 50
60 48 38 92 59 30 55 45 50 43
56 45 40 61 72 43 24 10 94 82
70 69 08 37 64 35 36 58 90 50
Classify this information into six equal classes using the exclusive method of
classification with a class interval of 15 and the last class is under 95. (4 marks)
3
4. (c) A student obtained the mean and standard deviation of 100 observations as 40 and
5 respectively. It was later discovered that he had wrongly copied down an
observation 50 instead of 40. Calculate the correct mean and standard deviation.
(4 marks)
(d) Draw the network diagram for the following list of activities. (8 marks)
Activity Immediate
Predecessor
Activity Immediate
Predecessor
A - L K
B A M K
C B N K
D C O D
E D P O
F E Q B
G E R N
H C S L,M
I C,F T S
J G,H,I U P,Q
K J V U
(e) A manufacturing company making castings uses electric furnaces to melt iron
which must have the following specifications:
Minimum Maximum
Carbon 3.10% 3.30%
Silicon 2.15% 2.25%
Specifications and costs of various raw materials used for this purpose are given
below:
Material Carbon % Silicon % Cost (Ksh)
Steel Scrap 0.42 0.12 850/tonne
Cast Iron Scrap 3.80 2.40 900/tonne
Remelt from foundry 3.40 2.30 500/tonne
Carbon briquettes 100 0 7kg
Silicon briquettes 0 100 10kg
If the total charge of Iron metal required is 4 tones, find the weight in Kg. of each raw
material that must be used in the optimal mix at minimum cost. (8 marks)
4