Summary of Completed Work Fall 2014 and Spring 2015
1. Summary of Completed Work Fall and Spring 2014
Goals
The overall goal of this project would be to find a pathway to make drug delivery via pulmonary
administrationmore potent(withoutraisingtoxicity)evenwhenthe drugpassesthroughamucouslayer.
Withinthe pastfewyears,pulmonaryadministrationhasbecome more popularthanoral administration.
A few advantages for pulmonary administration is that it avoids the first-pass metabolism because it is
directlytransferredintothe lungsthusenabling aquickresponse fromthe drug. Thisprocessalsoallows
the drug to bypass the gastrointestinal tractwhichpreventsthe drug from beingdigested. Thismethod
endsupbeinga simplerwaytoadministerthe songwhile allowingformaximalabsorptionsince itallows
a compromise between pH solubility and pH permeability (Meng-Lund, 2014).
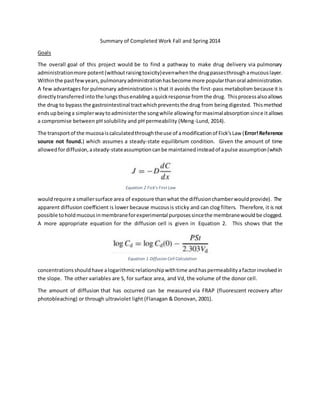
The transportof the mucosaiscalculatedthroughtheuse of amodificationof Fick’sLaw (Error!Reference
source not found.) which assumes a steady-state equilibrium condition. Given the amount of time
allowedfordiffusion,asteady-stateassumptioncanbe maintainedinsteadof apulse assumption(which
wouldrequire a smallersurface area of exposure thanwhat the diffusionchamberwouldprovide). The
apparent diffusion coefficient is lower because mucousis sticky and can clog filters. Therefore, it is not
possible toholdmucousinmembraneforexperimental purposessincethe membranewouldbe clogged.
A more appropriate equation for the diffusion cell is given in Equation 2. This shows that the
concentrationsshouldhave alogarithmicrelationshipwithtime andhaspermeabilityafactorinvolvedin
the slope. The other variables are S, for surface area, and Vd, the volume of the donor cell.
The amount of diffusion that has occurred can be measured via FRAP (fluorescent recovery after
photobleaching) or through ultraviolet light (Flanagan & Donovan, 2001).
Equation 2 Fick's First Law
Equation 1 Diffusion Cell Calculation
2. When measuring the diffusion of a drug or particle, through a mucous slab or a known volume of the
mucous,the mucousmust be able to be accuratelysudividedintosectionsatthe endfo the experiment
(Flanagan& Donovan, 2001). Thiscould
possibly require a higher concentration
of PGM (pig gastric mucin) which would
deviate from the normal range for
humanmucosa.The usual concentration
for the mucous is 2% PGM. Typical
rheologic data for the PGM mimetic is
shown in Figure 1. Rheology is
determined through values for G’, the
bulk shear storage modulus (elastic),
and G”, the bulk shear loss modulus
(viscous). This displays whether the
mimetic reacts appropriately to fluid
flow.
Another issue that could occur during
these experimentsisthe possibilityforparticlestocrosslinktothe mucous. Thiscouldskew the apparent
diffusioncoefficient for some particles which would result in poor data. To make the error from this as
minimal aspossible,acoatingof lowmolecularweightpolyethylene glycolwill be appliedtothe particles
to reduce association of particles with mucous and prevents protein adsorption (Lai, Wang, & Hanes,
2000).
Making drug delivery more effective through the mucouslayer is also beneficial for patients whosuffer
from cystic fibrosis. Patients with cystic fibrosis have a mucous composition different from a healthier
individual. The best place to start for finding a better
way to get drug delivery through a mucous layer of
different composition would be to find the optimum
size for a nanoparticle ina normal mucous layer. This
would give a good starting point to find the optimal
size for nanoparticles within a patient with cystic
fibrosis. This is also beneficial for pulmonary drug
delivery as whole. Finding the ideal range for
nanoparticle penetration for heatlhy people and
people withcystic fibrosiswouldincrease the efficacy
of the drug and, therefore, allow pulmonary drugs to
be approvedat a fasterrate since a higherpercentage
of people would be reached with the drug. Certain
trends known about mucous infected with cystic
fibrosis is the elastic modulus (G’) being dramatically
greaterthanthe viscousmodulus(G”). Thisgivesthe mucousalessviscousnature andisthe reasonwhy
mucal blockage have a higher chance of occuring in pulmonary and trachealbronchial tissue. Sample
Figure 1 Rheologic data of PGM mimetic (Hamad & Fiegel, 2013).
Figure 2 Rheologic data for CF mucosa (Pavan G. Bhat,
1996)
3. rheologicdataof typical cysticfibrosismucosaisin Figure2. A possible strategytodeal withthe different
viscoelastic properties is adding a mucolytic agent to improve penetration of the drug, such as Dornase
alfa or N-acetyl L-cysteine (Lai, Wang, & Hanes, 2000).
Methods
Membrane DiffusionStudy Protocol
1. Setpreviouslymade buffertomix for30 minutesthenobtain50mL sample forexperiment.
2. Settingupthe stock solution
a. Particles:Obtainstockparticle solutionandsonicate for10 minutesfollowedby
vortexingthe solution3timesfor30 seconds(repeatthisstep3 times)
b. Otherdyes:Weighandmix requiredamountof dye intothe buffertoachieve desired
concentration
3. Dilute stocksolutiontodesiredconcentration
4. Vortex 3 timesfor30 secondsfollowedbysonicatingfor10 minutes(onlyforparticles)
5. Setup diffusionchamber
a. Wash all part of diffusioncell
b. Place 50 mL buffersample in37 ° C waterbath
c. Cut outmembrane at an appropriate size fordoughnutsectionof chambertohold(have
shinyside pointingup
d. Plugall receiversbutleave one space openforcollectingsample
e. Add2 mL of buffertoeachchamberwitha stirbar in eachchamberfollowedby200 μL
of particle solution. Starttimeronce particle solutionisadded.
6. Collect200 μL sample of eachchamber infollowingmanner:
Time (minutes) ChamberA ChamberB ChamberC
T1
T2
T3
T4
T5
*Remembertoreplenish200 μL withsputumbufferaftertakingsample
7. Prepare StandardPlot(refertoStandardPlotprotocol) of knownconcentrationsbysettingup
Plate 1 accordingly:
1 2 3 4 5 6 7 8 9 10 11 12
A
B 1 1:2 1:4 1:8 1:16 1:32 1:64 1:128 1:256
C 2 1:2 1:4 1:8 1:16 1:32 1:64 1:128 1:256
D 3 1:2 1:4 1:8 1:16 1:32 1:64 1:128 1:256
E
F
G
H
4. 8. Setup Plate 2 accordingly:
1 2 3 4 5 6 7 8 9 10 11 12
A (T1 minutes) (T2 minutes) (T3 minutes)
B (A) X X X (A) X X X (A) X X X
C (B) X X X (B) X X X (B) X X X
D (C) X X X (C) X X X (C) X X X
E (T4 minutes) (T5 minutes)
F (A) X X X (A) X X X
G (B) X X X (B) X X X
H (C) X X X (C) X X X
*Use 50 μL of sample ineach well
How to make a PTT cross-linkedmucusmimetic:
Day 1:
1. Prepare 100 ml of sputumbuffer(fresh)
2. Using the 35 mL amberglassvials,create 29 mL of a 2% PGMIII solutioninsputumbuffer.
3. Place the tube(s) on the tube rotator(inside the walk-inrefrigerator) andallow themtomix for24
hours.
Day 2:
4. After24 hours of mixingonthe tube rotator,take the ambervialsof your mucinsolutionbacktothe
lab
5. Prepare a 15% solution(inwater) of potassium tetrathionate.Mix thisvigorouslytoensure ithasall
dissolved.
6. Add 1 ml of thisPTT solutiontothe 29 mL of mucinsolution.Mix byhandfor 5 minutes.
7. Place the vialsina 37C waterbath.Make sure to lightlymix themeverydaytokeepthe mucinfrom
settling.Alsomake sure thatthe waterinthe bath doesn’tevaporate (Fill inmore if youneedto)
Day 8:
8. Your mucin solutionhasnowcross-linkedfor6days(requiredforbestresults).Now runrheology.Ask
me or Edwinabouthowto do that whenthe time comes.
Results
A B C
10 L1 M1 N1
20 L2+0.1L1 M2+0.1M1 N2+0.1N1
5. 30 L3+0.1*(L2+0.1L1) M3+0.1*(M2+0.1M1) N3+0.1*(N2+0.1N1)
Usingtime pointsat 30 seconds,3 minutes,6minutes,9minutes,and12 minutes,the resultsshowed
that while the dye’sconcentrationreachedequilibriumonbothsideswithinthreeminutes,the receiving
cell showedanincrease inthe dye from30 secondsto3 minutes.
Nuclearfastredhad a fairlyconsistentabsorbance spectrumwhichmade itapparentthatthe time
interval formeasurementswere toolarge. Afterthese trials,itwasnecessarytouse smallertime
intervals.
0
200
400
600
800
1000
1200
1400
0 2 4 6 8 10 12 14
Absorbance
Time (min)
Nuclear FastRed 1-12-2015
A
B
C
y = 0.0223ln(x) + 0.0254
R² = 0.9442
y = 0.028ln(x) + 0.0419
R² = 0.9505
y = 0.0298ln(x) + 0.0716
R² = 0.9175
0
0.02
0.04
0.06
0.08
0.1
0.12
0.14
0.16
0 2 4 6 8 10
mginReceiver
Time (minutes)
Trypan Blue Trial in PBS 2-10-15
A B C Log. (A) Log. (B) Log. (C)
6. Comparisonof the three trialsfordiffusionstudy2-10-15for trypanblue. Eventhoughthe amountof
mass transferthatoccurs is differentforeachtrial,the trendisoverall the same. Possible reasoningfor
whythe mass transferisdifferentcouldbe attributedtosome differencesbetweeneachmembrane or
the donor sample notbeingwell mixedwhenaddedtothe membrane.
TestDiffusion Cell withNuclearFastRedwithknownmassof dye addedto prove massof dye is
increasinginreceiver:
y = 0.0223ln(x) + 0.0254
R² = 0.9442
0
0.01
0.02
0.03
0.04
0.05
0.06
0.07
0.08
0 2 4 6 8 10
mginReceiver
Time (minutes)
A
y = 0.028ln(x) + 0.0419
R² = 0.9505
0
0.02
0.04
0.06
0.08
0.1
0.12
0 2 4 6 8 10
mginReceiver
Time (minutes)
B
7. The resultsforthese experimentsshowanexpectedtrendforthe trypanblue diffusionthroughthe
cells. The receiverincreasesonalogarithimicscale whichagreeswithcalculationsforthe masstransfer.
Unfortunately,the standarddeviationswere highforthese trials. Thiswaslatercorrectedbyswitching
the readingstoabsorbance.
Standard plots for trypan blue only yielded decent results when absorbance was measured. For
fluorescence,the datawasveryunreliableandall overthe place. Aftertryingthe standardplate andthe
quartz plate, it was determined that the fluorescence reading for trypan blue was unreliable and that
absorbance was the better measure as shown by the trials.
y = 0.0298ln(x) + 0.0716
R² = 0.9175
0
0.02
0.04
0.06
0.08
0.1
0.12
0.14
0.16
0 2 4 6 8 10
mginReceiver
Time (minutes)
C
y = 2.9871x
R² = 0.9969
-0.05
0
0.05
0.1
0.15
0.2
0.25
0.3
0.35
0 0.02 0.04 0.06 0.08 0.1 0.12
Absorbance(OD)
Concentration (mg/mL)
Trypan Blue Absorbanceat607 nm
A B C AVERAGE Linear (AVERAGE)
8. Overall,Ithinkthe technique wasalrightforthe standardplots,itwasthe fact I useda fluorescence
measurementinsteadof absorbance measurementthatwasthe issue.
Standardplotfor DextranwithRhodamine andpreliminarytestingof the diffusioncell withthe dye
showedthatideal time markerswouldbe 5min,10 min,20 min,30 min,60 min.
Aftertime slotswere determined,adiffusionstudywasdone withthree cellstoobserve the diffusion
barrierduringthe time periodsmentionedabove.
y = 2.9852x
R² = 0.9969
0
0.05
0.1
0.15
0.2
0.25
0.3
0.35
0 0.02 0.04 0.06 0.08 0.1 0.12
Absorbance(OD)
Concentration (mg/mL)
Trypan Blue Absorbanceat607 nm
A B C AVERAGE Linear (AVERAGE)
y = 554.26x
R² = 0.9987
0
200
400
600
800
1000
1200
1400
0 0.5 1 1.5 2 2.5
Fluorescence
Concentration (mg/mL)
Standard Plot FluorescenceEx. 540 nm Em. 625 nm
1 2 3 Average Linear (Average)
9. Againthe logarithmicbehaviorisseenforthisdata. To fullycapture the behavior,itcouldbe possibleto
take smallertime pointsbetween5and 10 minutestoobserve more of the logarithmicbehavior.
y = 0.0159ln(x) + 0.1985
R² = 0.6377
0
0.05
0.1
0.15
0.2
0.25
0.3
0 10 20 30 40 50 60 70
Amountinreceiver(mg)
Time (minutes)
Diffusion Study Rhodaminewith Dextran
y = 549.74x
R² = 0.9964
0
100
200
300
400
500
600
700
0 0.2 0.4 0.6 0.8 1 1.2
Absorbance
Concentration (mg/mL)
Standard Plot for Rhodamine Dextran 5-5-15
1 2 3 Average Linear (Average)
10. Usinga smallertime scale,the logarithmictrendwasobservedforfluorescencewithverylittle erroras
indicatedbythe small errorbars. Thisshowsthat the logarithmictrendisthe desiredbehaviorobserved
for diffusionandshouldbe expectedforparticles.
Rheological Propertiesof MucinMimeticwhichwill be usedinfuture transportstudies:
Sample 1 showsmodestdifferencesbetweenDay2 and Day 14 aftercrosslinkingshouldbe completed.
The range for the viscoelasticmodulus decreasesasthe amountof time aftercrosslinkingincreases.
y = 0.0196ln(x) + 0.0786
R² = 0.9878
0
0.02
0.04
0.06
0.08
0.1
0.12
0.14
0.16
0 2 4 6 8 10 12 14
ReceiverAmount(mg)
Time (minutes)
Diffusion Study Rhodaminewith Dextran 5-5-15
0.01
0.1
1
10
100
1000
10000
0.1 1 10 100
ViscoelasticModulus(Pa)
Frequency (rad/s)
SK-1-8-1 D14 Rheology - Frequency
Sweeps (n=3)
G'Average
G"Average
0.0001
0.001
0.01
0.1
1
10
100
1000
10000
0.1 1 10 100
ViscoelasticModulus(Pa)
Frequency (rad/s)
SK-1-8-1 D2 Rheology - Frequency
Sweeps (n=3)
G'Average
G"Average
11. Sample 2 showsmore dramaticdifferencesfromDay2 to Day 14 withthe viscoelasticmodulusshowing
a large decrease comparativelyasthe frequencyincreases. Eventhoughthe mimeticinaprevioustrial
seemedgoodtouse after10 days,14 days showsevidenceof degradationof the crosslinkings. Sofor
experimental purposes,itwouldbe recommendedtouse the mimeticfordiffusionstudieswithin7
days.
0.0001
0.001
0.01
0.1
1
10
100
1000
10000
0.1 1 10 100
ViscoelasticModulus(Pa)
Frequency (rad/s)
SK-1-8-1 D2 Rheology - Frequency
Sweeps (n=3)
G' Average
G" Average
0.0001
0.01
1
100
10000
0.1 1 10 100
ViscoelasticModulus(Pa)
Frequency (rad/s)
SK-1-8-2 Rheology D2 - Frequency
Sweeps (n=3)
G'Average
G"Average
0.00001
0.001
0.1
10
1000
0.1 1 10 100
ViscoelasticModulus(Pa)
Frequency (rad/s)
SK-1-8-2 Rheology D14 - Frequency
Sweeps (n=3)
G'
Average
12. Measuringthe rheologythrough the C60/4 rather thanthe C35/4 gave more reasonable results. This
explainsthe oddresultsfromthe firsttests. Furthertestsinclude waitingafew more daystosee if
crosslinkingstabilizesorif mimeticcontinuestocrosslink. Thiswill giveinformationonthe immediacy
for runningdiffusionstudieswiththe mimetic.
Sample 2:
0.0001
0.001
0.01
0.1
1
10
100
1000
10000
100000
0.1 1 10 100
ViscoelasticModulus(Pa)
Frequency (rad/s)
SK-1-8-2 Rheology D2 - Frequency
Sweeps (n=3)
G' Average
G" Average
0.01
0.1
1
10
100
1000
0.1 1 10 100
ViscoelasticModulus(Pa)
Frequency (rad/s)
SK-1-8-1 Rheology D10 -
Frequency Sweeps (n=3)
G' Average
G" Average
13. Some crosslinkinghasoccurredwithinthe pasttendays,butnotenoughfor the mimetictobe inthe
acceptable range forhumanmucous. Dan suggestedarepeatof the experimentwhichwill occurinthe
nextcouple of weeks. These resultswere possiblydue tousingoldPTT,andwas laterfoundto be due
to usingthe wrongmucinbatch. More experimentswill be runonce reagentsforthe sputumbufferare
verifiedbecause itunsure whetheranhydousormonohydrate formsof acompountisneeded.
Discussion/Conclusions/FutureWork
The logarithmictrendforthe diffusionof the variousdyeswereobservedwithreliable R2
valueswhich
meansthat thistype of trendshouldbe viewedinothertransportstudiesaswell.Conclusionsfromthe
mimeticformationswerethatthe mimeticwouldholdforatleastaweek. Thisensuresaweek’sworth
of reliabletestingfortransportstudiesusingthe mimetic. Future workforthisproject include making
the mucinmimeticfromthe correct batch andwiththe right reagents(once the anhydrousand
monohydrate confusioniscleared),anddoingtransportstudieswiththe dyesgoingthroughthe
mimetics. Thiswill giveabaseline estimateforwhatisexpectedwhenthe particleswill diffuse through
the mucinmimeticaswell. Afterfindingthe ideal particle size forthe mimetic,the nextplanwouldbe
to synthesize amucinmimeticwhichhaspropertiessimilartoCF mucosa. Thentransport studieswillbe
done to findanideal particle size forthattype of mimetic.
References
Flanagan,D.,& Donovan,M. (2001). Drug TransferThrough Mucus. Advanced Drug Delivery Reviews,
174-195.
Hamad, R.,& Fiegel,J.(2013).SyntheticTracheal MucuswithNative Rheological andSurface Tension
Properties. Wiley OnlineLibrary, 1788-1798.
Lai, S.,Wang, Y. Y., & Hanes,J. (2000). Mucus-PenetratingNanoparticlesforDrugandGene Deliveryto
Mucosal Tissues. Advanced Drug Delivery Review,158-171.
0.0001
0.001
0.01
0.1
1
10
100
1000
0.1 1 10 100
ViscoelasticModulus(Pa)
Frequency (rad/s)
SK-1-8-2 Rheology D10 -
Frequency Sweeps (n=3)
G' Average
G" Average
14. Meng-Lund,E.M. (2014). Ex VivoCorrelationof the Permeabilityof MetoprololAcrossHumanand
Porcine Buccal Mucosa. J. Pharm.Sci.,103: 2053–2061.
PavanG. Bhat,D. R. (1996). Drug DiffusionthroughCysticFibroticMucus:Steady-State Permeation.
Journalof PharmaceuticalSciences,624-630.