1. March 1, 2016
Health Behaviors Incentive Program Evaluation
Interim Report
Natoshia M. Askelson Brad Wright Suzanne Bentler
Assistant Professor,
Community & Behavioral
Health**, Health Policy
Research Program*
Assistant Professor, Health
Management & Policy**,
Health Policy Research
Program*
Assistant Research Scientist*
Health Policy Research
Program
Elizabeth Momany Brooke McInory Tessa Heeren
Assistant Director, Health
Policy Research Program
Associate Research Scientist*
Survey Research Manager*
Health Policy Research
Program
Research Assistant*
Health Policy Research
Program
Peter Damiano
Director*
Professor, Preventative &
Community Dentistry
Acknowledgement
We would like to acknowledge the interviewers and coders who contributed to this evaluation:
Samantha Budzyn, Patrick Brady, Mayra Martinez, Cris Meier, Chad Norris, Nadia Sabbagh, Blake
Smith, and Rosamond Smith.
*University of Iowa Public Policy Center
**University of Iowa College of Public Health
2. Health Behaviors Incentives Program Evaluation – Interim Report March 1, 2016
Contents
Background........................................................................................................................................................... 1
Overview of Iowa’s Healthy Behaviors Incentive (HBI) Program ............................................................... 2
Claims Data........................................................................................................................................................... 4
Methodology..................................................................................................................................................... 4
Results................................................................................................................................................................ 8
Clinic Manager Interviews ............................................................................................................................... 20
Methodology................................................................................................................................................... 20
Results.............................................................................................................................................................. 21
Member Interviews............................................................................................................................................ 29
Methodology................................................................................................................................................... 29
Results.............................................................................................................................................................. 31
Limitations .......................................................................................................................................................... 45
Future Evaluation Activities............................................................................................................................. 46
Conclusions......................................................................................................................................................... 47
3. Measures
Measure 1 Proportion of members who had a preventive care visit...........................................................................................................9
Measure 2 Proportion of WP/MPC members completing HRA ...............................................................................................................9
Measure 3 Whether a WP/MPC member completed both healthy behaviors...........................................................................................10
Measure 9 Completion of healthy behavior by demographic characteristics............................................................................................11
Measure 10 Health Status by completion of healthy behavior.................................................................................................................11
Measure 33 Provider reported use of HRA..............................................................................................................................................22
Measure 34 Percent of providers reporting encouraging patients to participate.....................................................................................23
Measure 36 Percent of providers reporting reimbursement ....................................................................................................................24
Measure 37 Providers reporting using HRA ..........................................................................................................................................24
Measure 38 Providers reported changes in communication with patients due to HRA..........................................................................24
Measure 39 Provider reported changes in treatment plans due to HRA.................................................................................................25
Measure 40 Provider reported barriers to using the HRA information ..................................................................................................25
Measure 50 Members’ knowledge of requirements of program ...............................................................................................................31
Measure 51 Members’ knowledge of payment process ............................................................................................................................32
Measure 52 Members’ knowledge of purpose of HBI program................................................................................................................34
Measure 53 Members’ understanding of how the program influences behavior .....................................................................................34
Measure 54 Members’ experience with premium payment mechanism ..................................................................................................35
Figures
Figure 1. Percent of Members Who Churn in 2014...................................................................................................................................5
Figure 2. Members Who Move From One County to Another in 2014 ....................................................................................................7
Figure 3. Members Who Completed a Wellness Exam as Identified by Claims Data, 2012 – 2014..........................................................9
Figure 4. Members Who Completed a Health Risk Assessment as Identified by Each of Three Data Sources, 2014..............................10
Figure 5. Percent of Members Who Completed Both a Wellness Exam and Health Risk Assessment as Identified by DHS Data ........11
Tables
Table 1. Descriptive Statistics of Population of Interest............................................................................................................................8
Table 2. Demographics of People in Iowa Wellness Plan Who Did Not vs. Did Complete Activities in 2014 .......................................12
Table 3. Demographics of People in Marketplace Choice Plan Who Did Not vs. Did Complete Activities in 2014...............................13
Table 4. Odds of Completing HRA Based on Insurance Plan .................................................................................................................15
Table 5. Odds of Completing Wellness Exam Based on Insurance Plan .................................................................................................17
Table 6. Odds of Completing Wellness Exam and HRA Based on Insurance Plan.................................................................................19
Table 7. Clinic Characteristics.................................................................................................................................................................21
Table 8. Sample Disposition ....................................................................................................................................................................30
4. Health Behaviors Incentives Program Evaluation – Interim Report March 1, 2016
1
Background
On January 1, 2014 Iowa implemented the Iowa Health and Wellness Plan (IHAWP). IHAWP expands
coverage for low income Iowans through two new programs: the Marketplace Choice and the Wellness Plan.
The Wellness Plan provides coverage for adults aged 19-64 years with income up to and including 100
percent of the Federal Poverty Level (FPL). It is administered by the Iowa Medicaid Enterprise (IME).
Members will have access to the Medicaid provider network established for this program.
The Marketplace Choice Plan provides coverage for adults aged 19-64 years with income from 101-133
percent of the Federal Poverty Level (FPL). The Marketplace Choice Plan allows members to choose
certain commercial health plans available on the health insurance marketplace, with Medicaid paying
the member's commercial health plan premiums.
IHAWP replaces the IowaCare program with plans that cover more services, offer a broader provider network,
and expand coverage to other low income adults in Iowa who were not previously enrolled in IowaCare.
5. Health Behaviors Incentives Program Evaluation – Interim Report March 1, 2016
2
Overview of Iowa’s Healthy Behaviors Incentive (HBI)
Program
As a part of both the Wellness Plan and the Marketplace Choice Plan, enrollees are encouraged to participate
in an HBI program involving three components: 1) a wellness exam and health risk assessment (HRA), 2)
provider incentives, and 3) healthy behaviors. This program is designed to:
• Empower members to make healthy behavior changes.
• Establish future members’ healthy behaviors and rewards.
• Begin to integrate HRA data with providers for clinical decisions at or near the point of care.
• Encourage members to take specific proactive steps in managing their own health and provide
educational support.
• Encourage providers to engage members in completion of the healthy behaviors by offering incentive
payments.
Starting in 2015, a small monthly contribution by the member may be required depending on family income,
although there are no copayments for health care services and prescriptions under the plan. Some Wellness
Plan members will contribute $5 per month, while Iowa Marketplace Choice Plan members will contribute $10
per month. Wellness Plan members with individual earnings less than 50 percent of the Federal Poverty Level
($5,835 per year for an individual, or $7,865 for a family of 2) will not have monthly contributions. IHAWP
members who complete the wellness exam and the HRA will not be responsible for a monthly contribution.
Early survey results of IowaCare members who transitioned into IHAWP found that the vast majority (90%)
were not aware that completing a wellness exam would be part of the program to have their contributions
waived.
Members earning over 49% of the FPL are given a 30-day grace period after the enrollment year to complete
the healthy behaviors in order to have the contribution waived. If members do not complete the behaviors
after the grace period has ended, members will receive a billing statement and a request for a hardship
exemption form. For members of the Wellness Plan, all unpaid contributions will be considered a debt owed to
the State of Iowa but will not, however, result in termination from the Wellness Plan. If, at the time of
reenrollment, the member does not reapply for or is no longer eligible for Medicaid coverage and has no
claims for services after the last premium payment, the member’s debt will be forgiven. For members in
Marketplace Choice, unpaid contributions after 90 days result in the termination of the member’s enrollment
status. The member’s outstanding contributions will be considered a collectable debt and subject to recovery.
A member whose Marketplace Choice Plan benefits are terminated for nonpayment of monthly contributions
must reapply for Medicaid coverage. The IME will permit the member to reapply at any time; however, the
member’s outstanding contribution payments will remain subject to recovery.
Wellness Exam
The wellness exam is an annual preventive wellness exam (New Patient CPT Codes: 99385 18-39 years of age,
99386 40-64 years of age; Established Patient CPT Codes: 99395 18-39 years of age, 99396 40-64 years of age)
from any plan-enrolled physician, Rural Health Clinic (RHC), Federally Qualified Health Center (FQHC) or
Advanced Registered Nurse Practitioner (ARNP). The exams are part of the preventive services covered by the
plans and therefore do not cost the member anything out-of-pocket. A ‘sick visit’ can count towards the
6. Health Behaviors Incentives Program Evaluation – Interim Report March 1, 2016
3
requirement of the preventive exam, if wellness visit components are included and the billing code modifier 25
is used.
Health Risk Assessment
A health risk assessment (HRA) is a survey tool that can be used by members and providers to evaluate a
member’s health. IME has identified Assess My Health as one such tool, although providers can select their
own tool if it asks similar questions. Assess My Health is an online form that takes members between 15 and
40 minutes to complete on the computer. Wellness Plan members who complete the assessment receive a one-
page report and their provider is able to receive a report automatically. Members of the Marketplace Choice
Plan also receive the report, but their provider does not automatically receive the report; Marketplace Choice
Plan enrollees must share the report with their provider. HRA information can be used by providers to
develop plans addressing member needs related to health risk determinants. The HRA could be completed
online at any location, including the health care provider’s office. Some clinics may have contacted patients to
fill out the HRA over the phone, with the clinic inputting the data into the online system.
Provider Incentives
Providers also have incentives available to them, so that they encourage and support their patients in
completing the wellness exam and HRA. Providers should be assisting members with the HRA before or
during their wellness exam. For every Wellness Plan member who completes the HRA with the assistance of
the provider, the provider will receive $25.00. The only HRA which qualifies for this incentive is the Assess My
Health tool.
Further Behavior Incentives
Based on research indicating incentives can be used to change behavior, a program of incentives will be
developed to encourage behavior change among enrollees. To participate in this part of the program, the
member must have completed the wellness exam and the HRA, unless they are below 50% of the FPL or are
Medically Exempt status. Plans for this part of the program are evolving.
7. Health Behaviors Incentives Program Evaluation – Interim Report March 1, 2016
4
Claims Data
Methodology
Data Sources
Data for the current quantitative analysis of the Healthy Behaviors Evaluation were derived from three
sources: Medicaid enrollment and claims data from January 2012 to December 2014, Department of Human
Services records on completion of wellness exams and health risk assessments in CY 2014, and 3M/TREO
Solutions records on completion of health risk assessments in CY 2014. Data for 2012 and 2013 include
members enrolled in the Medicaid State Plan on the basis of income or disability, and IowaCare members. As
of January 1, 2014, the IowaCare program was discontinued, so there are no IowaCare members in the 2014
data. However, there are now Wellness Plan and Marketplace Choice members present in that year of the data.
Study Population and Comparison Groups
As discussed in the evaluation proposal, the focus of this evaluation is the examination of differences in
outcomes between Iowa Wellness and Marketplace Choice Plan members and other comparison groups
outlined below. Because there may be differences between the members in the Wellness Plan and the
Marketplace Choice Plan, the evaluation documents and compares program outcomes for these groups as
well.
The Wellness Plan provides coverage for adults aged 19-64 years with income up to and including 100 percent
of the Federal Poverty Level (FPL). It is administered by the Iowa Medicaid Enterprise (IME). Members will
have access to the Medicaid provider network established for this program. Depending on their county of
residence, Wellness Plan members may be enrolled in one of three programs: fee-for-service, HMO, or
Wellness Plan PCP.
The Marketplace Choice Plan provides coverage for adults aged 19-64 years and members enrolled via three
methods: 1) approximately 6,700 people previously enrolled in IowaCare who had incomes from 101 to 133%
FPL, 2) people who have been enrolled in Medicaid but due to increased income are now eligible for the
Marketplace Choice Plan, and 3) those who have never been in a public insurance program but meet the
income eligibility for Marketplace Choice (101-133% FPL).
Comparison Group 1: Medicaid State Plan (Income Eligible)
Comparison Group 1 is composed of Medicaid State Plan members enrolled due to FPL between 0 and 66%.
There are approximately 300,000 adults who will have at least one month of data in the study period. These
individuals may be enrolled in one of three programs: fee-for-service, HMO or MediPASS PCCM.
Comparison Group 2: Medicaid State Plan (Disability Determination)
Comparison Group 2 is composed of Medicaid State Plan members enrolled due to disability determination.
The FPL for these members may range from 0 to 200%. There are approximately 25,000 adults in this group
who will have at least one month of data in the study period. The only payment structure for these members is
fee-for-service as they are not eligible for a managed care option.
Comparison Group 3: IowaCare
Comparison group 3 consists of former IowaCare enrollees. IowaCare was a limited provider/limited benefit
program that operated from 2005-2013. The provider network included one public hospital in Des Moines, a
8. Health Behaviors Incentives Program Evaluation – Interim Report March 1, 2016
5
large teaching hospital in Iowa City and 6 federally qualified health centers. It was for adults, not otherwise
eligible for Medicaid, with incomes up to 200% FPL. IowaCare enrollees were distributed in three places
following the elimination of this program: 1) those with incomes 101-133% FPL were enrolled into Marketplace
Choice, 2) those with incomes 0-100% FPL were enrolled in Wellness Plan, and 3) those whose income could
not be verified were not enrolled in any program.
Assigning Medicaid Plan Members to Programs
Before proceeding with analyses, we assigned Medicaid plan members to 1 of the 5 groups described above.
For the expansion population, we assigned plan members to either the Iowa Wellness Plan or the Marketplace
Choice Plan. We assigned other individuals to 1 of the 3 comparison groups which included income-eligible
Medicaid State Plan members, disability-eligible Medicaid State Plan members, and IowaCare members.
We attributed individuals to a program if they were enrolled in that program for at least 6 months during the
year. Because individuals can move into and out of Medicaid programs for various reasons, we created a
churn variable to identify instances when a member changed programs from one month to the next or
experienced a gap in coverage. We then aggregated the monthly data to the annual level and counted the
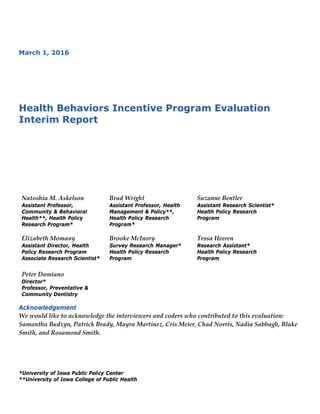
number of these transitions in enrollment, as shown in Figure 1.
To ensure that program assignment resulted in mutually exclusive groups, we required that members never
enrolled in another program or experienced a gap in coverage during the year (in addition to the minimum 6
month enrollment criterion). We were not comfortable assigning individuals who moved between programs or
experienced gaps in coverage to any particular program. However, we also wanted to avoid simply dropping
these data from our analyses. Therefore, we examine the group of individuals experiencing churn separately.
Figure 1. Percent of Members Who Churn in 2014
69.2
21.7
6.5
2.7
0%
10%
20%
30%
40%
50%
60%
70%
80%
90%
100%
0 1 2 3+
Number of Churn Events
9. Health Behaviors Incentives Program Evaluation – Interim Report March 1, 2016
6
Univariate Analyses
First, we examined the annual completion rate for wellness exams among the Wellness Plan and Marketplace
Choice plan members and the IowaCare and Medicaid State Plan comparison groups. We also included a
group of individuals from any of these programs who experienced any churn or gaps in coverage as a distinct
group. This measure (completion of wellness exam) was derived using Medicaid claims data, as these were the
only data available for all programs (Department of Human Services is only tracking completion of wellness
exams among the Wellness Plan and Marketplace Choice Plan members). As baselines for comparison, these
analyses uses data from 2012 and 2013 in addition to the 2014 data. T-tests were used to compare the means
between program pairs, and all differences were statistically significant at p<0.001.
Second, we examined the completion rate for health risk assessments among the Wellness Plan and
Marketplace Choice Plan members in 2014. We also included a group of individuals who were enrolled for 6
months in the Wellness Plan and/or 6 months in the Marketplace Choice plan, but who experienced any churn
or gaps in coverage. Because three different data sources were available, we report the completion rates using
each measure available to us. These included data collected by 3M/TREO Solutions (under contract to the
state), records maintained by the Iowa Department of Human Services (DHS), and Medicaid claims.
Third, we examined the rate of completing both activities (wellness exam AND health risk assessment) among
the Wellness Plan and Marketplace Choice plan members in 2014. We also included a group of individuals
who were enrolled for 6 months in the Wellness Plan and/or 6 months in the Marketplace Choice plan, but
who experienced any churn or gaps in coverage. This outcome is important as completion of both activities is
required to avoid being charged a monthly premium. Because the state will be using DHS records to make
premium and disenrollment determinations, we rely on these DHS records for wellness exam and health risk
assessment completion in constructing this outcome.
Bivariate Analyses
Fourth, we separately explored the demographics of Wellness Plan and Marketplace Choice plan members in
2014, stratifying them on the basis of whether or not they had completed their HRA, wellness exam, or both.
Specifically, we included analyses of age, gender, race/ethnicity, metropolitan area of residence, number of
emergency department visits, number of prescription drugs, and number of chronic conditions. We used rural-
urban continuum codes (RUCCs) to categorize members’ county of residence as either metropolitan, non-
metropolitan urban, or non-metropolitan rural.
Multivariate Analyses
Finally, we ran a series of logistic regression models to predict the likelihood of Wellness Plan and
Marketplace Choice plan members completing an HRA, wellness exam, or both during CY 2014. Specifically,
we modeled each of these outcomes as a function of age, gender, race/ethnicity, metropolitan area of residence,
number of moves during the year, number of emergency department visits, number of prescriptions, number
of chronic conditions, and number of months with full Medicaid coverage (which could range from 6 to 12
months).
Depending on the year, between 7% and 10.5% of our sample moved during the year as shown in Figure 2.
When individuals relocate for any reason, it is likely to be a disruptive event. Therefore, we include a variable
in our models that indicates the number of times a member moved to a different county in Iowa during the
year.
10. Health Behaviors Incentives Program Evaluation – Interim Report March 1, 2016
7
Figure 2. Members Who Move From One County to Another in 2014
Deviations from Proposed Methods
Originally, we proposed to determine the proportion of WP/MPC members who completed at least 1
additional behavior incentive, hypothesizing that it would exceed 50%. However, to date, no additional
healthy behaviors or incentives have been identified beyond the completion of the wellness exam and the
health risk assessment. Since completion of both activities is required to avoid being charged premiums, we
modified this part of the evaluation to instead determine the proportion of WP/MPC members who completed
both activities (wellness exam and HRA).
89.4
8.8
1.8
0%
10%
20%
30%
40%
50%
60%
70%
80%
90%
100%
0 1 2+
Number of moves
11. Health Behaviors Incentives Program Evaluation – Interim Report March 1, 2016
8
Results
Table 1. Descriptive Statistics of Population of Interest
Wellness Plan Marketplace Choice
Observations Value* Std.
Dev.
Observations Value* Std. Dev.
Average Age 64686 39.8 12.95 17830 39.7 12.80
% Male 64686 54.7 0.50 17830 43.4 0.50
% White 64686 61.5 0.49 17830 64.7 0.48
% Black 64686 8.3 0.28 17830 5.2 0.22
% Hispanic 64686 3.7 0.19 17830 5.2 0.22
% Other Race 64686 4.0 0.20 17830 4.7 0.21
% Unknown Race 64686 22.3 0.42 17830 20.1 0.40
% Metropolitan 64686 59.0 0.49 17830 57.3 0.49
% Nonmetropolitan Urban 64686 37.7 0.48 17830 38.5 0.49
% Nonmetropolitan Rural 64686 4.0 0.19 17830 4.8 0.21
Number of Moves 64686 0.1 0.37 17830 0.1 0.33
Number of ER Visits 64686 0.6 1.60 17830 0.4 1.00
Number of Rx Drugs 64686 1.2 2.00 17830 0.9 1.62
Number of Chronic
Conditions
64686 1.5 1.98 17830 1.2 1.76
Months of Coverage (6 - 12) 64686 10.1 2.02 17830 10.0 2.00
*Note: Values for average age, number of moves, ER visits, Rx drugs, chronic conditions, and months of coverage are means within the
Wellness Plan and Marketplace Choice Plan, respectively. Values for all other variables are proportions of the member population in
that plan with a given characteristic. For example, in the above table, 61.5% of Wellness Plan members are white, 8.3% are black, and so
forth, such that the race proportions sum to 100% within the Wellness Plan column (with differences due to rounding).
The following results are organized by the questions and hypotheses as outlined in the original evaluation
proposal. Descriptive statistics for our populations of interest who had either 6 months of exclusive enrollment
in either the Iowa Wellness Plan or the Marketplace Choice Plan are shown in Table 1.
Question 1 Which activities do members complete?
Hypothesis 1.1
The proportion of Wellness Plan (WP) and Marketplace Choice (MPC) members who complete a wellness
exam is greater than the proportion of Medicaid State Plan (MSP) or IowaCare members.
12. Health Behaviors Incentives Program Evaluation – Interim Report March 1, 2016
9
Measure 1 Proportion of members who had a preventive care visit
Protocol-NCQA HEDIS AAP
Data source-Administrative
Analyses-Means tests between WP/MPC members and three comparison groups before and after
implementation
We were able to document the proportion of members completing a wellness exam both pre and post using
Medicaid claims data. This allows us to compare trends among the 3 comparison groups with the first year of
data available for Wellness Plan and Marketplace Choice Plan members. As Figure 3 shows, our hypothesis 1.1
is partially supported. The proportion of Wellness Plan members completing a wellness exam in 2014 was
nearly 26%, which is the highest documented rate among all groups and all years of data analyzed. The
corresponding figure among Marketplace Choice plan members was just 18.5%. Among the income-eligible
Medicaid State Plan members, there is a declining trend over time, going from approximately 22% to 19%. This
is the highest rate among the 3 comparison groups. By contrast, roughly 14% of the disability-eligible Medicaid
State Plan members and 9 – 11% of IowaCare members completed a wellness exam. The “multiple” group
(those who experienced churn) reflects rates of completion comparable to averages of the comparison groups
in 2012 and 2013 and comparable to averages of the Wellness Plan and Marketplace Choice Plan with the two
Medicaid State Plan comparison groups in 2014. However, in every case, an overwhelming majority of
members failed to complete an annual wellness exam.
Figure 3. Members Who Completed a Wellness Exam as Identified by Claims Data, 2012 – 2014
Hypothesis 1.2
The proportion of WP/MPC members who complete a Health Risk Assessment is greater than 50%.
Measure 2 Proportion of WP/MPC members completing HRA
Protocol-Original
21.6
14.3
10.7
0.0 0.0
16.2
19.2
13.6
8.9
0.0 0.0
13.8
18.6
14.7
0.0
25.9
18.5
22.4
0%
5%
10%
15%
20%
25%
30%
Medicaid State
Plan, Income
Eligible
Medicaid State
Plan, Disability
Eligible
IowaCare Wellness Plan Marketplace
Choice Plan
Multiple
2012 2013 2014
13. Health Behaviors Incentives Program Evaluation – Interim Report March 1, 2016
10
Data source-Administrative
Analyses- Descriptives regarding the rate of completion for WP/MPC members
As Figure 4 shows, our hypothesis 1.2 is not supported. While there is significant variation in the results
depending on the data source used to identify completion of a Health Risk Assessment, no result exceeds 25%.
Regardless of which data source is used, Wellness Plan members complete their Health Risk Assessment at a
significantly greater rate (between 2.1 and 5.1 times as high) than their counterparts in the Marketplace Choice
Plan. Individuals who have at least 6 months enrollment in the Wellness Plan and/or the Marketplace Choice
Plan but experience churn manage to complete their HRA at a similar rate to the Wellness Plan group. It is
notable that Medicaid claims appear to identify only a small proportion of Health Risk Assessments being
completed, while the group contracted by the state to collect these data (3M/TREO Solutions) identifies
significantly more HRA completion, and Iowa DHS records, which include individuals calling in to report
having completed their HRA yield the highest completion percentage.
Figure 4. Members Who Completed a Health Risk Assessment as Identified by Each of Three Data Sources,
2014
Hypothesis 1.3
The proportion of WP/MPC members who are eligible to participate and complete at least one behavior
incentive is greater than 50%.
Measure 3 Whether a WP/MPC member completed both healthy behaviors
Protocol-Original
Data source-Administrative
Analyses-Descriptives regarding the rate of completion for WP/MPC members
Using the data collected by Iowa DHS, we determined the proportion of individuals in the Wellness Plan and
the Marketplace Choice Plan who completed both a wellness exam and a health risk assessment in 2014. As
expected, these figures are lower than the figures for completion of each activity when considered
19.8
25.0
6.66.9
11.7
1.3
18.8
23.6
6.0
0%
5%
10%
15%
20%
25%
30%
3M/TREO SOLUTIONS Iowa Department of Human
Services
Iowa Medicaid Claims
Wellness Plan Marketplace Choice Plan Either w/ Churn
14. Health Behaviors Incentives Program Evaluation – Interim Report March 1, 2016
11
independently. As shown in Figure 5, we find that approximately 17% of Wellness Plan members completed
both activities, compared to approximately 8% of Marketplace Choice Plan members and approximately 16%
of the churn group (i.e., individuals who have at least 6 months enrollment in the Wellness Plan and/or the
Marketplace Choice Plan but experience churn.) These figures are especially important as they indicate the
proportion of individuals who have completed the activities required to avoid being charged a monthly
premium in the following year. Clearly, based on these results, the overwhelming majority of members will
have been subject to a monthly premium in 2015.
Figure 5. Percent of Members Who Completed Both a Wellness Exam and Health Risk Assessment as
Identified by DHS Data
Question 2 What personal characteristics are predictive of completing at least one behavior incentive, and the
number (or extent) of behavior incentives completed?
Hypothesis 2.2
Members (WP/MPC) who are young, white, female, and/or live in metro areas are more likely to complete at
least 1 behavior.
Measure 9 Completion of healthy behavior by demographic characteristics
Protocol-Original
Data source-Administrative
Analyses- Logistic regression modeling of HBI participation
Hypothesis 2.3
Members (WP/MPC) with poorer health status are less likely to complete the behaviors when compared to
members with better health status.
Measure 10 Health Status by completion of healthy behavior
Protocol-Original
16.6
7.6
15.7
0%
2%
4%
6%
8%
10%
12%
14%
16%
18%
20%
Wellness Plan Marketplace Choice Either w/ Churn
15. Health Behaviors Incentives Program Evaluation – Interim Report March 1, 2016
12
Data source-Administrative
Analyses- Logistic regression modeling of HBI participation
Tables 2 and 3 provide descriptive statistics for the Wellness Plan and Marketplace Choice Plan members
broken out by whether or not they completed an HRA, Wellness Exam, or Both. These data indicate that those
completing activities tended to be older, white, female, have more health conditions, and more months
enrolled in Medicaid coverage during the year.
Table 2. Demographics of Members in Iowa Wellness Plan Who Did Not vs. Did Complete Activities in 2014
Completed HRA Completed Wellness Exam Completed Both
No Yes No Yes No Yes
Average Age 38.3 44.3 38.6 43.2 38.7 45.3
% Male 57.5 46.2 60.7 38.6 57.3 41.5
% White 60.4 65.1 60.5 64.3 60.7 65.5
% Black 8.8 7.0 8.7 7.3 8.7 6.6
% Hispanic 3.9 3.3 3.7 3.8 3.8 3.3
% Other Race 4.2 3.5 3.9 4.5 4.2 3.4
% Unknown Race 22.7 21.2 23.2 20.1 22.6 21.2
% Metropolitan 57.1 64.8 58.1 61.5 58.1 63.8
% Nonmetropolitan Urban 39.6 31.7 38.6 35.2 38.7 32.4
% Nonmetropolitan Rural 4.0 4.0 4.0 4.0 3.9 4.3
Number of ER Visits 0.6 0.7 0.6 0.7 0.6 0.6
Number of RX Drugs 0.9 2.0 0.9 1.9 1.0 2.1
Number of Chronic Conditions 1.3 2.2 1.3 2.2 1.3 2.3
Months of Coverage (6- 12) 9.9 10.9 9.9 10.9 9.9 11.1
Note: Values for average age, number of moves, ER visits, Rx drugs, chronic conditions, and months of coverage are means within the
Wellness Plan stratified by completion of the activities, respectively. Values for all other variables are proportions of the member
population in that plan by activity completion. For example, in the above table, 57.5% of Wellness Plan members who did not complete
an HRA in 2014 were male, while 46.2% of Wellness Plan members who did complete an HRA in 2014 were male. Therefore, row
percentages will not sum to 1, but column percentages (e.g., for race) will (with differences due to rounding).
16. Health Behaviors Incentives Program Evaluation – Interim Report March 1, 2016
13
Table 3. Demographics of Members in Marketplace Choice Plan Who Did Not vs. Did Complete Activities in
2014
Completed HRA Completed Wellness
Exam
Completed Both
No Yes No Yes No Yes
Average Age 38.9 45.6 39.0 42.2 39.1 46.0
% Male 44.7 33.4 48.0 26.7 44.5 30.9
% White 64.2 68.3 63.7 68.6 64.3 70.2
% Black 5.4 3.9 5.4 4.8 5.3 4.3
% Hispanic 5.3 4.0 5.3 4.9 5.3 3.4
% Other Race 4.8 4.1 4.8 4.5 4.8 3.9
% Unknown Race 20.2 19.6 20.9 17.3 20.3 18.1
% Metropolitan 57.1 58.5 57.3 57.3 57.3 57.6
% Nonmetropolitan Urban 38.8 36.9 38.6 38.5 38.6 37.5
% Nonmetropolitan Rural 4.8 5.1 4.8 4.9 4.7 5.4
Number of ER Visits 0.4 0.4 0.3 0.4 0.4 0.4
Number of RX Drugs 0.8 1.7 0.8 1.5 0.9 1.8
Number of Chronic
Conditions
1.1 2.0 1.1 1.8 1.2 2.1
Months of Coverage (6- 12) 9.9 10.8 9.8 10.8 9.9 11.1
Note: Values for average age, number of moves, ER visits, Rx drugs, chronic conditions, and months of coverage are means within the
Marketplace Choice Plan stratified by completion of the activities, respectively. Values for all other variables are proportions of the
member population in that plan by activity completion. For example, in the above table, 48% of Marketplace Choice Plan members who
did not complete a wellness exam in 2014 were male, while 26.7% of Marketplace Choice Plan members who did complete a wellness
exam in 2014 were male. Therefore, row percentages will not sum to 1, but column percentages (e.g., for race) will (with differences due
to rounding).
Using multivariate logistic regression models, we are able to predict the likelihood of individuals completing
their HRA, Wellness Exam, or Both activities as a function of age, gender, race/ethnicity, metropolitan area of
residence, number of moves during the year, number of emergency department visits, number of
prescriptions, number of chronic conditions, and number of months with full Medicaid coverage (which could
range from 6 to 12 months). For the sake of comparison, we present the results for the Wellness Plan and
Marketplace Choice Plan in the same table for each outcome measure.
Table 4 presents the results of the logistic regression models predicting completion of the Health Risk
Assessment. Overall, the results are fairly consistent between Wellness Plan members and Marketplace Choice
Plan members. In both plans, each additional year of age was associated with 3% greater odds of completing
an HRA, while men had approximately 25% lower odds of completing an HRA than women. Among Wellness
17. Health Behaviors Incentives Program Evaluation – Interim Report March 1, 2016
14
Plan members, non-white race was associated with significantly reduced odds of completing an HRA, ranging
from 15% lower odds to 21% lower odds depending on the racial group. While the odds ratios for non-white
races were also less than 1 among Marketplace Choice Plan members, these figures were not statistically
significant. This may be driven by the smaller sample size in this group.
Compared to individuals living in non-metropolitan urban areas, individuals in metropolitan areas and non-
metropolitan rural areas had higher odds of completing an HRA, and the effects were larger among Wellness
Plan members than Marketplace Choice members. In the Wellness Plan, residents of metropolitan areas had
67% higher odds of completing their HRA, while those in non-metropolitan rural areas had 14% higher odds
of completing their HRA, compared to those in non-metropolitan urban areas. In the Marketplace Choice Plan,
residents of metropolitan areas had 21% higher odds of completing their HRA compared to those in non-
metropolitan urban areas. The number of times an individual moved from one county to another was not a
significant predictor of HRA completion among Marketplace Choice Plan members, but each move was
associated with a 13% reduction in the odds of completing an HRA among Wellness Plan members, suggesting
that relocation may be especially disruptive among those with extremely low incomes.
The proxy variables for health status include the number of annual emergency room visits, the average
number of monthly prescription drugs taken, and the number of chronic health conditions. We find that each
additional emergency room visit is associated with 6% lower odds of completing an HRA for Wellness Plan
members and 9% lower odds for Marketplace Choice Plan members. By contrast, each additional prescription
drug is associated with a 12% increase in the odds of completing an HRA among both Wellness Plan and
Marketplace Choice Plan members, and each additional chronic condition is associated with a 7% increase in
the odds of completing an HRA among Wellness Plan members and a 10% increase in the odds among
Marketplace Choice Plan members. Taken together, this suggests that individuals who have more frequent
interactions with the healthcare system (as evidenced by having more chronic conditions and more
prescriptions) will have more opportunities to be prompted to complete their HRA, while those who are more
reliant on the emergency room for their care are not getting their HRA as often because they are more likely to
be receiving fragmented care as opposed to patient-centered care.
Finally, we find that each additional month of coverage (beyond the 6 month minimum required for inclusion
in our sample) is associated with 29% higher odds of completing an HRA for Wellness Plan members and 27%
higher odds of completing an HRA for Marketplace Choice Plan members. This is as expected, given that the
more time a person has to complete the activity, the more likely they are to complete it.
18. Health Behaviors Incentives Program Evaluation – Interim Report March 1, 2016
15
Table 4. Odds of Completing HRA Based on Insurance Plan
Wellness Plan Marketplace Choice
OR 95% CI OR 95% CI
Age 1.03*** 1.02, 1.03 1.03*** 1.03, 1.03
Male 0.74*** 0.71, 0.77 0.75*** 0.67, 0.82
Black 0.79*** 0.73, 0.85 0.83 0.65, 1.06
Hispanic 0.84*** 0.75, 0.93 0.83 0.66, 1.06
Other Race 0.82*** 0.74, 0.91 0.99 0.78, 1.25
Unknown Race 0.85*** 0.81, 0.89 0.96 0.85, 1.09
Metropolitan 1.67*** 1.61, 1.75 1.21*** 1.10, 1.34
Nonmetropolitan Rural 1.14* 1.03, 1.26 1.14 0.91, 1.43
Number of Moves 0.87*** 0.83, 0.92 0.99 0.86, 1.15
Number of ER Visits 0.94*** 0.92, 0.95 0.91*** 0.86, 0.96
Number of Rx Drugs 1.12*** 1.11, 1.14 1.12*** 1.09, 1.16
Number of Chronic Conditions 1.07*** 1.06, 1.08 1.10*** 1.06, 1.13
Months of Coverage (6 - 12) 1.29*** 1.27, 1.30 1.27*** 1.23, 1.30
Constant 0.01*** 0.01, 0.01 0.00*** 0.00, 0.00
Table 5 presents the results of the logistic regression models predicting completion of the Wellness Exam.
Overall, the results are fairly consistent between Wellness Plan members and Marketplace Choice Plan
members. In both plans, each additional year of age was associated with 1% greater odds of completing a
Wellness Exam, while men had approximately 55% lower odds of completing a Wellness Exam than women.
Among both Wellness Plan and Marketplace Choice Plan members, there was no difference in the odds of
completing a Wellness Exam between whites, blacks, and Hispanics. However, in the Wellness Plan, those of
other races had 23% greater odds of completing a Wellness Exam relative to whites, while in both plans those
of unknown race had between 11 and 13% lower odds of completing a Wellness Exam relative to whites.
Compared to individuals living in non-metropolitan urban areas, individuals in metropolitan areas had higher
odds of completing a Wellness Exam, and the effects were larger among Wellness Plan members than
Marketplace Choice members. In the Wellness Plan, residents of metropolitan areas had 31% higher odds of
completing their Wellness Exam, compared to those in non-metropolitan urban areas. In the Marketplace
Choice Plan, residents of metropolitan areas had 10% higher odds of completing their Wellness Exam
compared to those in non-metropolitan urban areas. There was no difference between individuals living in
urban versus rural non-metropolitan areas. The number of times an individual moved from one county to
another was not a significant predictor of Wellness Exam completion among Marketplace Choice Plan
19. Health Behaviors Incentives Program Evaluation – Interim Report March 1, 2016
16
members, but each move was associated with a 7% reduction in the odds of completing a Wellness Exam
among Wellness Plan members, suggesting that just as was observed for the HRA, relocation may be
especially disruptive among those with extremely low incomes.
The proxy variables for health status include the number of annual emergency room visits, the average
number of monthly prescription drugs taken, and the number of chronic health conditions. We find that each
additional emergency room visit is associated with 7% lower odds of completing a Wellness Exam for
Wellness Plan members and 8% lower odds for Marketplace Choice Plan members. By contrast, each
additional prescription drug is associated with a 12% and 11% increase in the odds of completing a Wellness
Exam among Wellness Plan and Marketplace Choice Plan members respectively, and each additional chronic
condition is associated with a 10% increase in the odds of completing a Wellness Exam among members of
both plans. These results are very similar to those for the HRA model, and again suggest that individuals who
have more frequent interactions with the healthcare system (as evidenced by having more chronic conditions
and more prescriptions) will have more opportunities to be prompted to complete their Wellness Exam, while
those who are more reliant on the emergency room for their care are not getting their Wellness Exam because
they are more likely to be receiving fragmented care as opposed to patient-centered care.
Finally, we find that each additional month of coverage (beyond the 6 month minimum required for inclusion
in our sample) is associated with 27% higher odds of completing a Wellness Exam for Wellness Plan members
and 29% higher odds of completing a Wellness Exam for Marketplace Choice Plan members. This is as
expected, given that the more time a person has to complete the activity, the more likely they are to complete
it.
20. Health Behaviors Incentives Program Evaluation – Interim Report March 1, 2016
17
Table 5. Odds of Completing Wellness Exam Based on Insurance Plan
Wellness Plan Marketplace Choice
OR 95% CI OR 95% CI
Age 1.01*** 1.01, 1.02 1.01*** 1.00, 1.01
Male 0.45*** 0.44, 0.47 0.44*** 0.41, 0.48
Black 0.93 0.87, 1.00 1.01 0.85, 1.21
Hispanic 1.06 0.96, 1.16 1.02 0.86, 1.22
Other Race 1.23*** 1.13, 1.35 1.03 0.86, 1.24
Unknown Race 0.87*** 0.83, 0.91 0.89* 0.81, 0.99
Metropolitan 1.31*** 1.26, 1.36 1.10* 1.01, 1.19
Nonmetropolitan Rural 0.99 0.90, 1.09 1.05 0.87, 1.25
Number of Moves 0.93** 0.88, 0.98 1.03 0.92, 1.16
Number of ER Visits 0.93*** 0.92, 0.94 0.92*** 0.88, 0.96
Number of Rx Drugs 1.12*** 1.10, 1.13 1.11*** 1.08, 1.14
Number of Chronic Conditions 1.10*** 1.09, 1.12 1.10*** 1.08, 1.13
Months of Coverage (6- 12) 1.27*** 1.26, 1.29 1.29*** 1.26, 1.32
Constant 0.02*** 0.02, 0.02 1.29*** 0.01, 0.02
Table 6 presents the results of the logistic regression models predicting completion of both the Wellness Exam
and the Health Risk Assessment. Overall, with the exception of a major difference by gender, the results are
fairly consistent between Wellness Plan members and Marketplace Choice Plan members. In both plans, each
additional year of age was associated with 3% greater odds of completing both activities. Interestingly,
although men were less likely to complete their HRA or their Wellness Exam when modeled separately, we
find here that men in the Wellness Plan have 3% greater odds of completing both activities compared to
women, while men in the Marketplace Choice Plan have 32% lower odds of completing both activities
compared to women. Among Wellness Plan members, non-white race was associated with between 13 and
20% lower odds of completing both activities relative to whites. In the Marketplace Choice Plan, the only
significant racial difference was seen among Hispanics, who had 29% lower odds of completing both activities
compared to whites.
Compared to individuals living in non-metropolitan urban areas, individuals in metropolitan areas had higher
odds of completing both activities, and the effects were larger among Wellness Plan members than
Marketplace Choice members. In the Wellness Plan, residents of metropolitan areas had 53% higher odds of
completing both activities, compared to those in non-metropolitan urban areas. In the Marketplace Choice
Plan, residents of metropolitan areas had 18% higher odds of completing both activities compared to those in
non-metropolitan urban areas. In the Wellness Plan only, individuals living in rural non-metropolitan areas
21. Health Behaviors Incentives Program Evaluation – Interim Report March 1, 2016
18
had 19% greater odds of completing both activities compared to those living in urban non-metropolitan areas.
The number of times an individual moved from one county to another was not a significant predictor of
completing both activities among Marketplace Choice Plan members, but each move was associated with a
16% reduction in the odds of completing both activities among Wellness Plan members. This figure is more
than double the figures for completing either one of the activities separately, suggesting that the disruption of
relocation makes it especially difficult to complete both activities in a year.
The proxy variables for health status include the number of annual emergency room visits, the average
number of monthly prescription drugs taken, and the number of chronic health conditions. We find that each
additional emergency room visit is associated with 9% lower odds of completing both activities for Wellness
Plan members and 11% lower odds for Marketplace Choice Plan members. By contrast, each additional
prescription drug is associated with a 10% and 11% increase in the odds of completing both activities among
Wellness Plan and Marketplace Choice Plan members respectively, and each additional chronic condition is
associated with a 9% increase in the odds of completing both activities among members of both plans. These
results are very similar to those for the other two models, further indicating that individuals who have more
frequent interactions with the healthcare system (as evidenced by having more chronic conditions and more
prescriptions) will have more opportunities to be prompted to complete both their Wellness Exam and HRA,
while those who are more reliant on the emergency room for their care are not completing these activities
because they are more likely to be receiving fragmented care as opposed to patient-centered care.
Finally, we find that each additional month of coverage (beyond the 6 month minimum required for inclusion
in our sample) is associated with 37% higher odds of completing both activities for Wellness Plan members
and 42% higher odds of completing both activities for Marketplace Choice Plan members. Given findings from
the prior two models that more time enrolled translates to a greater likelihood of completing each of the
activities, it is to be expected that completing both activities will benefit from a greater length of enrollment in
the program.
22. Health Behaviors Incentives Program Evaluation – Interim Report March 1, 2016
19
Table 6. Odds of Completing Wellness Exam and HRA Based on Insurance Plan
Wellness Plan Marketplace Choice
OR 95% CI OR 95% CI
Age 1.03*** 1.02, 1.03 1.03*** 1.03, 1.04
Male 1.03*** 0.59, 0.65 0.68*** 0.60, 0.77
Black 0.80*** 0.73, 0.88 0.96 0.72, 1.27
Hispanic 0.86* 0.76, 0.97 0.71* 0.52, 0.97
Other Race 0.82*** 0.73, 0.93 0.93 0.69, 1.25
Unknown Race 0.87*** 0.82, 0.92 0.89 0.76, 1.03
Metropolitan 1.53*** 1.46, 1.61 1.18** 1.04, 1.33
Nonmetropolitan Rural 1.19** 1.06, 1.33 1.20 0.92, 1.57
Number of Moves 0.84*** 0.79, 0.90 1.06 0.89, 1.26
Number of ER Visits 0.91*** 0.89, 0.92 0.89*** 0.83, 0.95
Number of Rx Drugs 1.10*** 1.09, 1.12 1.11*** 1.08, 1.15
Number of Chronic Conditions 1.09*** 1.07, 1.10 1.09*** 1.05, 1.13
Months of Coverage (6-12) 1.37*** 1.35, 1.39 1.42*** 1.36, 1.48
Constant 0.00*** 0.00, 0.00 0.00*** 0.00, 0.00
Conclusion
Overall, we find that the proportion of Wellness Plan and Marketplace Choice Plan members who are
completing their Health Risk Assessment or Wellness Exam is much lower than expected. Moreover, the
proportion of members who complete both activities, which is required to avoid paying a monthly premium in
the following year is very low. According to our findings, approximately 83% of Wellness Plan members and
92% of Marketplace Choice Plan members failed to complete required Healthy Behaviors in 2014, and with the
exception of certain low-income Wellness Plan members, should have been subject to paying premiums in
2015 based on their rates of compliance. Individuals who are younger, non-white, live in non-metropolitan
areas, and visit the emergency room more often are especially at-risk of failing to complete the required
activities. Future reports with data from 2015 should clarify whether these findings persist.
23. Health Behaviors Incentives Program Evaluation – Interim Report March 1, 2016
20
Clinic Manager Interviews
Methodology
Proposed methods and variations from the methods
In the original evaluation proposal, we had outlined interviewing health care providers in order to understand
how much clinics know about the program, to understand how clinics might be encouraging the completion of
healthy behaviors, and to understand how the healthy behaviors might be changing practices in the clinic.
After informal discussions with health care providers, we determined that health care providers are often
removed from the billing and logistic practices of clinics. Frequently providers are not aware of type of
insurance a patient has. Clinic managers were identified as the people who most likely understand the
programs and insurance of patients. Managers are often responsible for clinic processes as well. Through
research we have conducted on clinic systems to encourage immunizations, we knew that clinic managers are
very easy to access and willing to participate in surveys and interviews. The final change in this evaluation
activity was related to the analysis. In the proposal, we had indicated that we would be using Grounded
Theory for the analysis. Because so few clinic managers had detailed information and experience with the
program, it was not appropriate to use Grounded Theory. The coding was closed, based on the interview
protocol, the research questions and the hypotheses.
Sample draw
The sample of clinic managers was drawn based on the number of completed wellness exams and HRAs at a
primary care clinic (family medicine and internal medicine). This information came from the Medicaid claims.
We only included clinics which had at least 5 completed wellness exams, because we wanted to have clinics in
the sample who had experience with the program. We also only included primary care clinics (family medicine
and internal medicine). There were a total of 131 primary care clinics with 5 or more completed wellness
exams for enrollees.
Interviews
The current study uses interviewing to collect qualitative information about the HBI program from clinic
managers. The preliminary hypotheses provided an outline for the interview script. Some questions in the
interview were designed to measure knowledge or awareness, for example: Specifically thinking about the
wellness exam- are you aware of what counts as a wellness exam? Some questions were designed to measure the
clinic’s exposure to and experience with the HBI program; for example: Can you tell me about the communication
you have had with the Iowa Health and Wellness Plan? The interview script included all elements of consent in the
introduction, and offered a $10 gift card as an incentive to participate.
Before making contact with clinics over the telephone, all clinics in the sample were mailed an invitation to
participate in the study. This letter notified clinics about the purpose of the research and upcoming telephone
contact. Microsoft Access software was used to track and document calls.
A team of six interviewers completed a required training to ensure adequate familiarity with the HBI program
and informed consent procedures. Interviewers were trained to use neutral language and prepared prompts
when interacting with interviewees. To promote consistent interviewing styles across members of the team,
interviewers were required to practice and record a mock interview. Interviewers were evaluated and given
feedback about their performance from the project manager. This process was repeated as needed until the
24. Health Behaviors Incentives Program Evaluation – Interim Report March 1, 2016
21
project manager approved each interviewer to make telephone calls to clinics. The telephone interviews were
audio recorded and then transcribed.
Coding
To interpret information collected from the clinic manager interviews, the responses were categorized and
labeled, or coded. Coding the transcripts assists in the systematic identification and analysis of recurring
themes across interviews. The coding process began with thorough readings of all the transcripts. Following
the reading, codes were developed based on the interview protocol, research questions, and hypotheses. A
codebook was developed with code definitions to describe relevant inclusion criteria for the transcribed
narratives. For example, to document the interviewee’s level of familiarity with the HBI program, the
following criteria was used: Respondent describes their understanding of HBI program--This includes the information
itself, the source of information (IME, DHS, ACO, patients, supervisor) and mode of delivery (in-person, website, e-
mails, ACO, seminar, conference, etc.) Any information volunteered by the respondent that fit this criteria was
coded as “Familiar with HBI.”
The codebook also contained examples of interview text for each code. To ensure the code definitions were
applied consistently, all members of the coding team interpreted the same set of transcripts. Coders read the
transcripts and categorized content to the corresponding definition in a spreadsheet. Coded content was then
compared across individual coders to ensure a common understanding of the parameters outlined in the code
definitions. The PI of the current study reviewed the practice set of transcripts, then approved each individual
member of the team to continue coding new transcripts with the same method. This method of cross-checking
contributes to the reliability of qualitative coding with multiple coders.
Results
Of the 131 clinics in the sample, 52 clinics were interviewed. After removing ineligible clinics, the American
Association for Public Opinion Research (AAPOR; https://www.aapor.org/ ) response rate was 49%, with a
71% cooperation rate. AAPOR sets the industry and academic standards for calculating response rates for
surveys and polls.
Clinic characteristics
Table 7. Clinic Characteristics
Respondents Non-respondents Sample Total
N (%) N (%) N (%)
Clinic Location
Rural 39 (75%) 65 (82%) 104 (79%)
Micropolitan* 4 (8%) 3 (4%) 7 (5%)
Metropolitan* 9 (17%) 11 (14%) 20 (15%)
Total 52 79 131
25. Health Behaviors Incentives Program Evaluation – Interim Report March 1, 2016
22
*Metropolitan and micropolitan areas defined by population standards set by the United States Census Bureau1
Table 7 illustrates responding and non-responding locations. No statistically significant differences were found
in the number of well visits or HRA completed between those clinics that completed the interview and those
that did not. The completion of HRA by clinics ranged from zero to 54. Of the 131 clinics sampled, 109 clinics
completed zero Health Risk Assessments, accounting for an average of less than one (0.9) completed HRA per
clinic. Of the 22 clinics that completed at least one HRA, the average was 5.5. The clinic sample excluded
clinics who had four or fewer completed wellness exams, so the number of completed wellness exams at each
clinic ranged from five to 221, accounting for a 21.5 average across the 131 clinic sample. A total of 52
interviews were completed and sorted into three groups based on the completeness and accuracy of clinic
manager responses. One interview was excluded from analysis, since the clinic only provided obstetrics
services. The remaining 51 interviews were categorized based on the content of the respondent’s narratives.
Group 1 (19 respondents) Clinic managers who exhibited high levels of knowledge and familiarity with HBI
program.
Reported high patient participation
Active enrollee recruitment and outreach
Answers to questions that measured knowledge were consistently accurate
Group 2 (22 respondents) Clinic managers who exhibited moderate or inconsistent levels of knowledge and
familiarity with HBI program.
Demonstrated basic knowledge of the program, not familiar with details
Recalled accurate information for some components, and inaccurate information for others
Group 3 (10 respondents) Clinic managers who exhibited marginal levels of knowledge and familiarity with
HBI program.
Responses related to Medicaid initiatives other than HBI. (IHH, SCHIP, IowaCare)
Inaccurate or partial responses to questions that measured knowledge
Unaware of clinic participation
Little to no experience with components of HBI program
For the research questions and hypotheses that require clinic managers to have awareness of the program, we
only used the interviews from Group 1. Using interviews from the other groups would have provided
inaccurate information. It is important to note that of the 19 interviews in Group 1, four of the clinic managers
did not recognize the name of the program.
Question 4 What are the effects of the program on health care providers?
Hypothesis 4.1
Providers use the information from the Health Risk Assessment.
Measure 33 Provider reported use of HRA
33A Percent of providers who report using HRA
1 http://www.census.gov/population/metro/about/
26. Health Behaviors Incentives Program Evaluation – Interim Report March 1, 2016
23
Protocol-Original
Data source-Provider survey, Provider in-depth interviews
Analyses-Qualitative
33B How providers use HRA
Protocol-Original
Data source- Provider survey, Provider in-depth interviews
Analyses-Qualitative
To assess measure 33A and 33B, clinic managers were asked Can you tell me how, if at all, the information in the
health risk assessment is used by your clinic? Can you provide a specific example? Of the nineteen most
knowledgeable clinic managers, six of them were not able to provide answers regarding the clinic’s use
information collected in the HRA. Eleven respondents reported using information collected by the HRA to
guide conversation in individual patient appointments, or storing the results with the patient’s history file,
although their descriptions lacked detail and it was hard to assess how much was actually happening.
Three respondents reported using the information from the HRA to recognize patterns in the general health
care needs of the IHAWP patient population of the clinic. For example, one respondent said, “It's useful in that
we can take this information, we see this person needs a physical…it helps us catch people that have maybe
fallen through our cracks.” [128] Two clinic managers mentioned referring patients who reported smoking
cigarettes in the HRA to smoking cessation tools, specifically Quitline Iowa.
Hypothesis 4.2
Providers are encouraging patients to participate in behavior incentive programs.
Measure 34 Percent of providers reporting encouraging patients to participate
Protocol-Original
Data source-Survey, In-depth interviews
Analyses-qualitative
To assess measure 34, clinic managers were asked Has your clinic done anything to promote this program to
enrollees? Of the nineteen most knowledgeable clinic managers, six reported no efforts to promote the HBI
program to IHAWP enrollees. The remaining 13 clinic managers reported promoting enrollee participation
in the HBI program through one of three methods: phone calls, mailings, and in-person prompts. Clinic
managers often provided information explaining their reasoning behind their chosen strategies. For example,
one clinic manager reported using only mailings, saying, “We did not call this year. Just because a lot of them
have numbers that are disconnected. And they won't call you back. And it's kind of hard to explain all that in a
voice mail.” [121]
Clinic managers explained that promotion efforts were intended to inform enrollees about the program,
prompt enrollees to schedule a wellness visit, encourage completion of the HRA outside the office, or to
simply suggest contacting the clinic for more information. One clinic manager described the promotion efforts
of the clinic’s health coach, saying,
She'll have a list of people who are on the Iowa Health and Wellness Plan and she'll go through and
she'll look to see if they've had a, a wellness exam during the year. And if they haven't, she'll try calling
27. Health Behaviors Incentives Program Evaluation – Interim Report March 1, 2016
24
them to schedule that. I think we are allowed to try two calls and then a letter, um, during each quarter
of the year....She also tries to call 'em to say, hey, there's this health risk assessment you can fill out, um,
you know, which will be helpful to do before your appointment. And she even goes as far as, you
know, let's say they have a physical scheduled at 10 a.m. that morning...She'll say, why don't you come
into my office at 9:00 and I can help you do it, you know, if the patient doesn't have a computer.[194]
Hypothesis 4.3
Providers are receiving their additional reimbursement.
Measure 36 Percent of providers reporting reimbursement
Protocol-Original
Data source-Provider survey
Analyses-Process
To assess measure 36, clinic managers were asked Has your clinic received incentives based on the percent of
members that have completed the exam? Of the 19 most knowledgeable clinic managers, 13 were not aware of
any receipt of incentives through the HBI program. One clinic manager in this group said, “Do they go to the
ACO? Or do they go to the clinic, we don't know that.”[128] Three clinic managers reported some familiarity
with the incentives, and described a lack of clarity concerning who receives the incentive money. For example,
“I would guess any incentives we would have gotten would have come back through the [NAMED ACO], and
I don't necessarily see what all shakes out through that”[123] and “I think so. Um, that's kind of handled at the
corporate level... I don't know where we stand, um, as far as receiving 'em.” [177]The remaining three clinic
managers reported some certainty of their clinic receiving incentives for achieving a percentage of completed
wellness exams. For example, one clinic manager said, “I think that we've received one. Um, and I think it's,
like, um, 50 dollars or something like that.”[195]
Hypothesis 4.4
Providers are more likely to use the HRA with Wellness Plan members compared to Marketplace Choice Plan
members
Measure 37 Providers reporting using HRA
37B Providers reporting on using HRA
Protocol-Original
Data source-In-depth interview
Analyses-Qualitative analysis
There was not enough use of the HRA, nor understanding of the difference between Wellness Plan
members and Marketplace Choice Plan members to provide evidence for this hypothesis.
Hypothesis 4.5
The HRA changes communication between the provider and patient.
Measure 38 Providers reported changes in communication with patients due to HRA
Changes in communication due to use of HRA
Protocol-Original
28. Health Behaviors Incentives Program Evaluation – Interim Report March 1, 2016
25
Data source-Provider in-depth interviews
Analyses-Qualitative
To assess measure 38, clinic managers were asked Have there been any changes in patient-provider communication
in using the health risk assessment? Of the 19 most knowledgeable clinic mangers, eight reported no change in
communication, and three said they did not know. One clinic manager attributed the lack of communication
change to collecting redundant information, saying, “Probably not...No. 'Cuz it's stuff that would be covered
anyway if they came in just for a, a wellness visit.”[219] Eight clinic managers reported a positive change in
patient provider communication with the addition of the HRA. One clinic manager describes improvements in
relationships, saying
People are just more willing to talk about things, it gets them to come back in more and, you
know, then they're thankful that they were able to come in. I think once they know, like,
they've done it and then we discuss it with 'em, they know that somebody cares. [121]
Another clinic manger describes the communication benefit of completing the HRA in a personal setting,
saying, “Maybe they were in the privacy of their own home taking the Healthy Behaviors, um, there might
have been a chance to be more honest. Answers were down on paper, and they didn't necessarily have to say
some of those things.” [195]
Hypothesis 4.6
The HRA changes provider treatment plans.
Measure 39 Provider reported changes in treatment plans due to HRA
Protocol-Original
Data source-Provider in-depth interviews
Analyses-Qualitative
To assess measure 39, clinic managers were asked Have health risk assessments been used to inform treatment
decisions? Of the nineteen most knowledgeable clinic managers, nine reported that only providers would
know information related to treatment decisions. Ten clinic managers affirmed that the HRA was used to
inform treatment decisions. Some examples of the HRA being used to inform treatment decisions included
high blood pressure and cholesterol treatment, pre-diabetic monitoring, smoking cessation options, sexual
health, and referral to specialists. One clinic manager summed up the application of HRA information, saying,
“Yes. If they see that there's a part of the assessment that the patient is needing help with, then we can reach
out to services to help.” [133]
Hypothesis 4.7
There are barriers to providers using the HRA information.
Measure 40 Provider reported barriers to using the HRA information
To assess measure 40, clinic managers were asked What are the barriers for members to completing the health risk
assessment? In response to this question, four of the 19 most knowledgeable clinic managers reported no
barriers. Eight clinic managers reported being unable to collect information from IHAWP members who
lacked material resources like transportation, computers, internet access, or phones, resulting in low
participation rates.
29. Health Behaviors Incentives Program Evaluation – Interim Report March 1, 2016
26
Clinic managers reported several factors that discouraged patients from completing the HRA, such as low
health literacy, time commitment, lack of awareness, and low interest. One clinic manager reported, “they
are often, um, not informed...They aren't aware, you know, they haven't even heard of it, um, I know we have
an employee here that never received information on it. Um. And many of them don't have their own, um,
computer….We haven't had that many participate, unfortunately.” [143] Another clinic manager said, “I do
think the risk assessment is way too long…When they start doin' it themselves they get sick of it and stop."
[123]
Three clinic managers reported complications in tracking and linking HRA information, one said, “We were
having troubles getting logged on to the system. And therefore the patients were not actually getting attached
to our clinic, they were having to use that MBR11. Um, which was the code that they were to apply to use on
the health risk assessment. Which means none of our patients initially were ever attached to our clinic. So it
doesn't look like we did a lot.” [195]
Protocol-Original
Data source-Provider in-depth interviews
Analyses-Qualitative
Findings from Groups 2 and 3
The majority of clinic manager interviews were categorized in Group 2 or 3 (n = 32). These groups represent
clinic managers who did not demonstrate enough awareness or knowledge about the program to convince
coders that the clinic managers actually knew about the program or the clinic managers indicated that they
did not know anything about the program. These interviews were not used to answer the research questions
and hypotheses proposed in the evaluation plan, but do provide us with some valuable information about
program implementation. We collapsed Groups 2 and 3 and identified the following themes.
General lack of awareness and confusion about the program
This group of 32 clinic managers either had a vague idea about the Healthy Behaviors Incentive program or
knew nothing about the program. Most managers reported that they did not hear about this program from
anyone. Some clinic managers indicated that they remembered having read something about it or having
heard about it during a meeting or conference. A few mentioned that they remembered something about the
program that was covered at a rural health conference. One manager indicated that the clinic might have
received information about the program. She stated, “I mean, I’m not saying that we didn’t already have some
information…We just hadn’t had time to go through it.” [113]
It was also very common for the clinic mangers to confuse the HBI program with other insurance and
Medicaid programs. Some respondents believed they were aware of the HBI program, but their description of
the program indicated that they actually were referring to another Medicaid program, such as the Integrated
Health Home or Medicaid Health Home. For instance, one clinic manager said, “The Healthy Behaviors, um,
are we talking about, like, they have a chronic disease? Or are we talking about the psychiatry part of it.” [113].
Another manager said, “You know, I’m not really sure if I have. I think I, I mean, I think it sounds familiar,
yeah. It that…does that involve like, like weight loss? Um, that sort of thing?” [132]
These respondents were not aware of the expanded definitions for well visits. A few of the respondents
indicated that their billing staff might be more knowledgeable about these issues. One manager stated, “Like I
30. Health Behaviors Incentives Program Evaluation – Interim Report March 1, 2016
27
said, I’m not sure if our insurance would know that either. But I, after I do get off the phone with you. I’m
gonna ask them. (laughing)” [222]
Most of the clinic managers had no awareness of incentives for providers to encourage the completion of
the healthy behaviors. Some indicated that billing staff might be aware of this kind of information.
There were clinic managers who indicated that they were either new to the position or that program such as
HBI were previously handled by staff that no longer worked at the clinic. They said that it might have been
possible that someone else had known about this program and that information had not been conveyed to
them. When asked how she might have learned about the program, a clinic manager stated,
Um, just kind of from my, the office manager that was here before I was had, kind of
mentioned it before she left. Um I’ll be honest, I don’t know if I have any formal, um, letter or
anything that really stated the whole thing. I just remember her mentioning it and we do have
a, we have a health coach that’s here at our office and I know she has gotten some, has
received some stuff about it but that, like I said, that’s been, that’s been a while ago. [170]
Of the clinic managers that were able to recall pieces of information or a vague awareness of a program like
this, but not the name, those managers had often heard about the program from a patient asking a question
or bringing their HBI information to the provider’s office. When asked if the clinic manager was aware of
HBI, the person said that had not received any information, but their patients told them about it. When asked
if she had received any information she said, “Yeah, not that I’m aware of, that they were doin’ this, um, but
just patients callin’ and sayin’ that, oh I have a wellness exam, blah, blah, blah.” [216]. Another manager
indicated, “’cuz I think, if anything, we were, who were we talking to? We just had a meeting and I remember
that coming up. Because somebody mentioned something. Um. Maybe it was a patient.” [111]
Some clinic managers mentioned that they had very few patients who were insured through IHAWP;
therefore they did not know much about the program. A few clinic managers indicated that they did not
believe any of their IHAWP patients paid contributions, so they did not believe this program applied to them.
When the interview explained the HBI program and asked if the program sounded familiar one clinic manager
said no and explained “But let me tell you the reason why, to us, it probably doesn’t apply too much. We, they,
they don’t pay a premium, our patient population….they don’t pay any type of premium…they don’t pay
copays or anything like that.” [169] One clinic manager insisted they had not signed up to participate in the
HBI and would not sign up in the future. She said, “…if they [patients] have any questions as far as wanting
to get in, and I’m not going to discourage them from applying for it because we are not partaking in it.” [124]
Changing Medicaid programs
Some managers indicated that it was difficult to keep up with Medicaid changes. One manager pointed to
the perception that programs were constantly changing at Medicaid. The manager stated, “But as things
change, I mean, I mean, you guys are change-or whatever Iowa Medicaid is changing over, Magellan, all that
kind of stuff is changing, so. I mean things are always changing.” [161]. Another manager said, “I personally
think it’s, um, can be confusing with the switching from month-to-month.” [127].
One individual said that the current changes in Medicaid might mean that this program would be
discontinued, so they were unmotivated to find out more information. After a manager indicated that he/she
did not know about the HBI, the interviewer provided a brief description, and the managers response was
“Does this one stay around or is that one wiped off the map too when Medicaid has, you know, has it, it’s
already selected four, um insurances to, er managed care organizations or whatever.” [127]
31. Health Behaviors Incentives Program Evaluation – Interim Report March 1, 2016
28
Outreach to patients about program
Although these managers did not understand enough about the HBI to be included in the findings above,
there were still outreach efforts done by clinics that might lead to the completion of a wellness exam. These
respondents did indicate some efforts to do outreach to their patients about well-exams but these efforts were
not because they were conscious of the program and wanted to encourage participation, but because it was
standard practice to do some type of reminder (call, letter, and postcard) for all patients.
Communication with Medicaid/IME/DHS
The majority of these clinic managers reported that their communication with Medicaid/IME/DHS was
positive. Telephone calls to Medicaid resulted in satisfactory answers. Often members used the website as
their first option for finding answers to their questions. None of the clinic managers indicated that their
communication with the state was specifically about the HBI. Most of their communication was related to
claims.
Interest in learning more about the program
After hearing the interviewer describe the HBI program some clinic managers were interested in more
information. A few clinic managers were going to check with other clinic staff to see if they had awareness of
the program. Others indicated they would look at the website or call Medicaid to find out more information.
One manager said, “But, I feel like I need to read up on this more now, after talking to you!(laughing)” [113]
One clinic manager indicate that there might be better ways for Medicaid to communicate with clinics. The
manager said,
…maybe having a representative come out and explain to you either the additional benefits
now that these patients will have these are the that you could give them, offer them services
that are covered benefits for’em, that type of thing. …I think they get so much paperwork and
stuff, it probably gets set aside. Whereas if you had an actual representative here, it might be
more useful. [158]
Most of the clinic managers did not indicate that they would follow up with any sources to find out more
information.
32. Health Behaviors Incentives Program Evaluation – Interim Report March 1, 2016
29
Member Interviews
Methodology
Adjustments were made to the study design in the original evaluation proposal to account for the smaller than
expected rates of completed wellness exams and HRAs. In addition, results from the clinic manager
interviews suggested that there was a general lack of awareness about the program, so we believed that it was
important to talk to more members to find those who are very aware of the program. Note: There were no
expanded healthy behaviors in the program, so we could not ask about completion of these.
The sample was drawn from IHWAP enrollees whose ages were 19-64 as of August 14, 2015 with a valid
telephone number and mailing address, who had been in the program at least 6 months. The sample was
pulled in four groups: those who had completed only the HRA, those who had completed only the wellness
exam, those who had completed both, and those who had not completed either. Each group was drawn to
have an equal number of enrollees who identified as being black, Hispanic and white. Each group also
contained roughly equal numbers of men and women.” We oversampled for enrollees who identified as black
or Hispanic in order to ensure that we had completed interviews from the most diverse sample possible.
A team of nine interviewers completed a training session to ensure adequate familiarity with the HBI program,
the IHAWP, informed consent procedures, and the interview script. HIPPA training was also completed by all
interviewers. Interviewers were trained to use neutral, non-leading language and prepared prompts when
interacting with interviewees. To promote consistent interviewing styles across members of the team,
interviewers were required to practice and record mock interviews. Interviewers were evaluated and given
feedback about their performance from the project manager. This process was repeated as needed until the
project manager approved each interviewer to make telephone calls to enrollees.
A total of 468 IHWAP enrollees were sent a letter explaining the study and inviting the enrollee to participate.
The letter included the telephone number on record for the enrollee and a tear-off form for enrollees to send
back to provide us their current/preferred phone number where they could be reached. A business reply
envelope was also included for the enrollee to return the form at no cost. Trained interviewers called the
sample in a random order. No more than 10 attempts were made to each enrollee. The attempts were made on
rotating times and days between the hours of 9 a.m. and 8 p.m. on weekdays, 10 a.m. to 6 p.m. on Saturday
and 12 to 5 p.m. on Sunday. The interviews ranged between 5 and 51 minutes. Microsoft Access software was
used to track and document call disposition (see Table 8)
The interview script included all elements of consent in the introduction. Enrollees were offered a $25 gift card
to their choice of Wal-Mart, Target, or Casey’s for completing the interview. A language interpreting service,
CyraCom, specializing in interpretation and translation of healthcare related contexts was used for non-
English speaking enrollees. Additionally, one of the interviewers, a native Spanish speaker, conducted 5
interviews in Spanish. All interviews were recorded and transcribed.
A total of 152 interviews were completed for a response rate of 46%. Of the 152 interviews, 85 were women
and 76 were men. Their ages ranged from 19 to 64 based on ages calculated from birth dates available in the
Medicaid claims data (M= 41.84, SD = 13.51). Thirty-six percent of the respondents were categorized at 0% FPL,
8.6% at 1-50% FPL, 51%-100% was 30.3%, 21.1% were in 101%-133%, and 3.9% were over 134% FPL. According
to Medicaid claims data 36.8% identified as white, 32.9% as African American/Black, and 30.3% as Hispanic.
33. Health Behaviors Incentives Program Evaluation – Interim Report March 1, 2016
30
The interview protocol consisted of open-ended questions related to enrollees experience with IHWAP and
their awareness and experience with the Healthy Behaviors Program. The preliminary hypotheses about the
program provided an outline for the interview script. Some questions in the interview were designed to
capture the general importance of health insurance and preventive care. For example, How important is it for
you to have health insurance coverage and How important is getting regular check-ups to you? Certain questions in
the interview were designed to measure knowledge and awareness of the HBI program and its components,
for example, Have you gotten a checkup/wellness exam since you have been on this new insurance? Tell me a little bit
about what happened during this exam? And did you know about the health risk assessment? Other questions were
designed to measure where and how enrollees are obtaining information about the program, Have you received
any information about getting a wellness exam- who was it from and what do you remember it saying? Additional
questions attempted to gather data about the enrollee’s experience with the HBI program as well as
barriers/facilitators to completion of the components. For example, Was there something that made it [health risk
assessment/Assess My Health] easy to complete? What?
We looked for differences between those that responded and those that did not. There were no statistically
significant differences between the respondent and non-respondents related to percent federal poverty level,
number of well visits completed as determined by Medicaid claims data, no difference between the groups in
whether the enrollees were from Marketplace Choice or Iowa Wellness Plan. There were also no differences in
race/ethnicity between the respondents and non-respondents. Respondents were more likely to have
completed an HRA as measured by the HBI dataset from 3M. The mean age of respondents (M = 41.84, SD =
13.51) was slightly older than the mean age of non-respondents (M = 37.72 years, SD= 13.41). Non-respondents
were more likely to be male.
Table 8. Sample Disposition
Frequency Valid Percent
Answering Machine/Voicemail 58 12.4
Busy Signal 5 1.1
Callback 63 13.5
Completed Interview 152 32.5
Disconnected Number 66 14.1
Incarcerated 2 0.4
Ineligible 3 0.6
No Answer 10 2.1
Other Problem Number 1 0.2
Out of State 3 0.6
Refused 39 8.3
Unreachable 6 1.3
Wrong Number/No Such
Person
60 12.8
Total 468 100.0
Coding
To interpret data collected from the in-depth enrollee interviews, the responses were categorized and labeled,
or coded. Coding the transcripts assists in the systematic identification and analysis of recurring themes across
34. Health Behaviors Incentives Program Evaluation – Interim Report March 1, 2016
31
interviews. The coding process began with thorough readings of all transcripts by the PI and a member of the
research team. Following the reading, codes were developed based on the interview protocol, research
questions, and hypotheses. A preliminary codebook was developed based on information gathered from the
interview transcripts. Code definitions and examples were developed to describe relevant inclusion criteria for
the transcribed narratives. For instance, to document the respondent’s understanding of the importance of
having health insurance (HI), the following criteria was used: Apply this code when the respondent identifies that
having health insurance is important because of cost, because it helps them manage a current health concern (chronic or
acute) or because the respondent received education or knowledge that benefits their health. Importance was further
defined as capturing more conceptual ideas provided by the enrollee versus benefits which includes more tangible things.
Any information provided by the respondent that fit this criteria was coded as “Importance of having HI.”
To ensure the code definitions were applied consistently, all members of the coding team met to review,
discuss and amend this codebook. Eight coders participated in this initial meeting. Inter coder reliability was
established by having each member of the coding team interpret and code the same three interview transcripts.
To code, coders read the transcripts and categorized applicable content to the corresponding definition into a
standardized spreadsheet that was provided to all coders. Coded content from these three interviews were
then compared across individual coders to ensure a common understanding of the parameters outlined in the
code definitions. The codebook was further refined and additional training of coders was completed before
each individual member of the coding team was approved to continue coding new transcripts. Ultimately,
seven trained coders participated in the final coding process. This method of cross-checking further
contributes to the reliability of qualitative coding with multiple coders.
A total of 146 interviews were coded. The uncoded interviews were the interviews conducted in Spanish. The
transcription and translation of these interviews is currently being finished and have not been included in the
current report.
Results
According the Medicaid administrative data, 61.8% had completed an HRA at some time during their
enrollment and 56.6% had completed a well visit at some time during their enrollment. We wanted to ensure
that we were interviewing enrollees who had completed the healthy behaviors and those that had not. From
the respondents 26.3% had only completed the HRA, 21.1% had only completed a well visit, 35.5% had
completed both the well visit and the HRA, and 17.1% had completed neither healthy behavior. Based on the
Medicaid administrative data, 76.3% of the interviewed enrollees were in the Iowa Wellness Plan (IWP) and
23.7% were in Marketplace Choice (MPC).
Note for the results below, the study ID is included after the respondents’ quotes.
Hypothesis 7.4
Members (WP/MPC) understand the logistics (for example- payment, payment options, requirements of the
program, …) of the HBI program.
Measure 50 Members’ knowledge of requirements of program
Protocol-Original measure
Data source-In-depth Interviews and Consumer survey
Analyses-Qualitative analysis and Frequencies
35. Health Behaviors Incentives Program Evaluation – Interim Report March 1, 2016
32
To assess measure 50, The HBI program requirements of receiving a wellness exam and completing a health
risk assessment were described and interviewees were asked if they knew anything about the program. Seven
out of thirty-five interviewees enrolled in Marketplace Choice appeared to be aware of the HBI’s
requirements when described while twenty-seven stated they were not familiar with the HBI’s
requirements and one did not provide an answer. One Marketplace Choice member stated that they were
aware of the program through a letter from DHS “Interviewer: Ok. And do you remember what the
information on the letter said from DHS? Interviewee: Just to, if, to get those two things done so you don't
have to get the fees every month or whatever” [1021], while another reported that their clinic informed them of
the program “Yes. I have, yes. I've gotta look for that at home, 'Cuz when I made my appointment the doctor
told me to, his nurse told me to bring that in, that information so they could submit it” [3064].
Thirty-four out of one hundred eleven interviewees enrolled in the Iowa Wellness Plan appeared to be
aware of the HBI’s requirements. One interviewee recalled receiving information regarding the requirements
of HBI when he was enrolled stating, “Yeah I knew that part… it actually came in the, when I first got the
insurance and it came with a welcome packet and all the information. That was actually in there” [3051].
Interviewees from both plans who identified they were aware of the program requirements stated this
information came through introductory materials from when they enrolled in the program, mailings, or being
told by their clinician or other clinic staff.
Quotes from Marketplace Choice members:
• Yes. And I've done those…I haven't heard really anything. I did both the assessment and the physical,
that's all I heard. [3001]
Quotes from Iowa Wellness Plan members:
• Yeah, I got the letter in the mail last year. And it's my fault I didn't get it done. But I did get the
information that you have to have it done, the questionnaire and the wellness exam by January 12. So
that you won't get charged. Yeah I got all the information, I just didn't do it. Which was my fault. [1085]
• Yep. It does. So 2014 and then this year, I've filled out the health assessment. I made a checkup last
year, but I have not had a checkup this year yet. I know that's one of the requirements to maintain the
insurance (inaudible). [3061]
• I think they told me that when I first got it, in the pamphlet. [3091]
• They actually, they helped me filled somethin' out online. It was somethin' new, I think, and they
wanted everybody that had that insurance to sign up for it 'cuz, I guess it's, go in for a checkup every...
year or somethin', you know, havin' to come in and do a checkup so you can stay on, stay with the
insurance and they can keep up with your information.[3072]
• I believe I have heard of it, yes...I don't remember where I heard it or from where it was or the time. All
I know is that I have this program and I don't pay anything. I'd rather keep it like this, and I wouldn't
change it for anything else, you know. [1066]
Measure 51 Members’ knowledge of payment process
Protocol-Original measure
Data source-In-depth Interviews and Consumer survey
Analyses-Qualitative analysis and Frequencies
36. Health Behaviors Incentives Program Evaluation – Interim Report March 1, 2016
33
To assess measure 51, Interviewees were asked Have you ever received an invoice or bill for monthly premiums or
contributions? Nineteen MPC members and 86 IWP reported never receiving an invoice for monthly
premiums/contributions or did not believe they had. Thirty of these interviewees stated that they did not
know why they did not received an invoice or bill for monthly premiums or contributions, nineteen stated
it was due to their low income, and sixteen stated it was because of the insurance plan they were covered
by. Thirty interviewees who had received an invoice or bill for premiums simply acknowledged the receipt of
an invoice and reported that payment was made without issue, or that the invoice or bill had been received in
error. Eighteen interviewees enrolled in the Marketplace Choice and 76 interviewees enrolled in the Iowa
Wellness Plan responded that it was important or beneficial to have a way to avoid paying monthly premiums
with many stating their belief was due to financial constraints. Enrollees did not report problems with paying
premiums but some did acknowledge confusion with the receipt of bills for services that were not covered by
their insurance plan.
Quotes from Marketplace Choice members:
• Correct. I pay it monthly. And my understanding is, it gets taken off of my taxes. I will find that out
this year when I file my taxes. [4023]
• Yes I have and I pay that, 10 dollars a month. Sometimes I let it go for two months and then I send 'em
two months at a time. But yeah, I get a bill every month and I send the 10 dollars in. [1016]
• I did and yeah they sent me something for like, 5 dollar thing. But it is. Lately they haven't been
sending me any. But normally they do. Maybe once a month [3077]
• I just recently got one, and it's for only, like, 10 dollars. So I'm not quite for sure how it works. [1021]
• No, like would that, I would have to pay?...well yes. Right now I'm paying 10 dollars a month. To be
honest with you I don't think that's that much, you know as a matter of fact I think that's pretty free.
[2049]
Quotes from Iowa Wellness Plan members:
• Yes ma'am I just get a bill once a month for 5 dollars, just send it in to 'em. [1061]
• I started to receive these actually. And it was just last month, it was a 5-dollar... membership due, if you
will, that's, kind of, what they were calling it. And then you could always opt, if you were financially
not able to pay that amount. [1004]
• I would like to do those [healthy behaviors] and not pay. Because I don't have money and I'm not
working. [1096]
• Yeah I think that's good, yeah. I can pay it, I can pay it or I can do the assessment, it, it works either
way, you know, I could pay it or I can do the assessment. [2017]
• It is. Yes it is. 'Cuz like you know, like I said, I don't have, I barely make it, let me put it that way. So
yeah I am glad there was ways to avoid [paying a contribution] yeah. Not because I'm stingy, I just
simply don't have the money. [3062]
• Yes. It is. Very beneficial. Because it, it saves a LOT of money at the end of the day. And it's also, it
forces me to check, before a checkup, to make sure I'm doing fine. So it, it works for me on both ends.
[3071]
37. Health Behaviors Incentives Program Evaluation – Interim Report March 1, 2016
34
Hypothesis 7.5
Members (WP/MPC) understand the purpose of HBI and how it is supposed to influence their behavior.
Measure 52 Members’ knowledge of purpose of HBI program
Protocol-Original measure
Data source-In-depth Interviews and Consumer survey
Analyses-Qualitative analysis and Frequencies
To assess measure 52, interviewees were probed Why do you think your health plan is encouraging people to get
check-ups/annual exams? What about health risk assessments? Interviewees enrolled in both Marketplace Choice
plans and the Iowa Wellness plan identified preventive care, identifying current and future healthcare
issues, general health promotion, encouraging annual checkups, and lowering healthcare costs in the long
term as reasons health plans are encouraging individuals to participate the HBI program. Preventative care
and lowering healthcare costs were the most common responses among all interviewees.
Quotes from Marketplace Choice members:
• I think it's important to get annual exams. I mean, there's underlying health issues that a lot of people
don't realize they have. That need to be addressed. And. So. I think that's very important to have an
annual exam. I think it makes 'em think more in depthly about their health. And, you know, why they
should or shouldn't have health insurance. And, 'cuz they ask, it asks good questions about you and
makes ya think about it. [3001]
Quotes from Iowa Wellness Plan members:
• Well, maybe they, it's to head off any problems, you know. Catching things early. And, you know, for
your own betterment and. [1079]
• Well I imagine it's because of the increase in illnesses like diabetes and cancer. Now, I don't know if
we're seeing it more often or if before people just didn't notice. So I'm guessing that now they want
people to be able to detect all of that sooner and to be able to get treatment sooner, to be able to fight it
off. [2002]
• Well I think if we stay on top of things, then that keeps health costs down. [3101]
• Just to make sure they're healthy, and that they're not covering things that could be prevented. [4103]
• One, because preventative care, you know, is one, life-saving. It's money-saving. And, you know,
people need to be aware and, you know, take (very) care for themselves. [3010]
• To avoid any major problems like, for example the mammogram that prevents your or they do an early
(detention) of cancer, so. [3066]
Measure 53 Members’ understanding of how the program influences behavior
Protocol-Original measure
Data source-In-depth Interviews and Consumer survey
Analyses-Qualitative analysis and Frequencies
To assess measure 53, Interviewees were asked What do you think the benefits are to getting regular check-ups? and
What do you think are the benefits from completing this assessment? Interviewees enrolled in Marketplace Choice