International Journal of Pharmaceutical Science Invention (IJPSI)
Thrombin Generation Assays ISTH poster 2009
1. Comparison of Three different Thrombin Generation Assays in Patients with
Haemophilia
Aghighi S., Riddell A., Chowdary P., Gatt A. Katharine Dormandy Haemophilia Centre & Thrombosis Unit, Royal Free Hospital, Pond Street, London NW3 2QG,
United Kingdom
Introduction
• Several commercial thrombin generation tests (TGT) are now available.
• Recent studies have reported the application of TGT to evaluate patients with hyper
or hypo-coagulopathy 1, 2, 3
•Several studies have reported low thrombin generation in patients with severe
Haemophilia A (HA) 4, 5, 6
.
•However, due to different sample preparation techniques, phospholipid
concentrations and tissue factor concentrations employed, comparability of results
between studies is difficult, including thrombin generation assays with corn trypsin
inhibitor (CTI) 5, 6
.
Conclusion:The harmonisation of the results, as recommended by the TGT ISTH SSC
working party, improved comparability of the parameters from the three different thrombin
generation tests used in this group of Haemophilia patients
Patient Group & Control Group: .46 male patients with Haemophilia A (26
severe, 10 moderate and 10 mild) and a control group comprising of 25 healthy
volunteers.
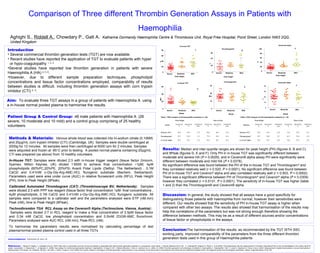
Results: Median and inter-quartile ranges are shown for peak height (PH) (figures A, B and C)
and ttPeak (figures D, E and F). Only PH in in-house TGT was significantly different between
moderate and severe HA (P = 0.0029), and in Ceveron® alpha assay PH were significantly were
different between moderate and mild HA (P = 0.0378).
No significant difference was found between the PH of the in-house TGT and Thrombogram®
and
they correlated relatively well (r = 0.520, P = 0.0001). No significant difference was found between
PH of in-house TGT and Ceveron®
alpha and also correlated relatively well (r = 0.503, P = 0.0002).
There was a significant difference between PH of Thrombogram®
and Ceveron®
alpha (P = 0.0309)
however they correlated (r = 0.5131, P = 0.0001). The sensitivity of in-house TGT was higher (table
1 and 2) than the Thrombogram® and Ceveron® alpha.
Discussion: In general, the study showed that all assays have a good specificity for
distinguishing those patients with haemophilia from normal, however their sensitivities were
different. Our results showed that the sensitivity of PH in-house TGT assay is higher when
compared with other two assays. The results also showed that harmonisation of the results may
help the correlations of the parameters but was not strong enough therefore showing the
difference between methods. This may be as a result of different sources and/or concentrations
of tissue factor or phospholipids in the assays.
Methods & Materials: Venous whole blood was collected into tri-sodium citrate (0.106M)
and 20µg/mL corn trypsin inhibitor (CTI) (Cambridge, UK). Samples were double centrifuged at
2000g for 12 minutes. All samples were then centrifuged at 6000 rpm for 2 minutes. Samples
were aliquoted and frozen at -85°C prior to testing. A pooled normal plasma containing 20µg/mL
CTI was prepared (as above) from 10 healthy volunteers.
In-House TGT: Samples were diluted 2:3 with in-house trigger reagent (tissue factor (Innovin,
Sysmex, Milton Keynes, UK) diluted 1:6000 to achieve final concentration ~1pM, 4µM
phospholipids (60%PC,20%PE, 20%PS) Avanti Polar Lipids (Delfzyl, The Netherland) , 0.1M
CaCl2 and 0.41mM z-Gly-Gly-Arg-AMC.HCL flurogenic substrate (Bachem, Switzerland).
Parameters used were area under curve (AUC) in relative fluroescent units (RFU), Peak Height
(PH), time to Peak Height (ttPeak).
Calibrated Automated Thrombogram (CAT) (Thrombinoscope BV, Netherlands): Samples
were diluted 2:3 with PPP low reagent (tissue factor final concentration 1pM- final concentrations ,
4µM phospholipids, 0.1M CaCl2 and 0.41mM z-Gly-Gly-Arg-AMC.HCL flurogenic substrate. All
samples were compared to a calibrator well and the parameters analysed were ETP (nM.min)
Peak (nM), time to Peak Height (ttPeak).
Technothrombin TGA RCL Assay on the Ceveron® Alpha (Technoclone, Vienna, Austria):
Samples were diluted 2:7 in RCL reagent to make a final concentration of 0.5pM tissue factor
and 0.34 mM CaCl2, low phospholipid concentration and 0.5mM ZGGR-AMC flurochrom.
Parameters analysed were AUC RCL (nM.min), Peak-RCL (nM).
To harmonise the parameters results were normalised by calculating percentage of test
plasma/normal pooled plasma control used in all three TGTs
References: 1. Besser M, Baglin C, Luddington R,et al. (2007) High rate of unprovoked recurrent venous thrombosis is associated with high thrombin generation potential in a procpective cohort study. J Thormb Haemost Oct 6 (10). 2. LuddingtonR, Grigorov R, Wiens L. et al (2009). First experiences with the measurement of Thrombin Generation(TGA) on the Ceveron®alpha in the routine lab.GTH
poster presentation. 3. Matsumoto, T., & Ogiwara, K. (2008). New assays for monitoring haemophilia treatment. Haemophilia, 14 Suppl 3, 83. 4. Beltran-Miranda C, Khan A, Jaloma-Cruz, A, Laffan, M. (2005) Thrombin generation and phenotypic correlation in haemophilia A. Haemophilia 11(4). 5. Lewis S, Stephens E, Florou G et al. (2007). Measurement of global haemostasis in severe haemophilia A
following factor VIII infusion. Br J Haemtol 183 (6) 6. van Veen J, Gatt A, Cooper P, et al. (2008) Corn trypsin inhibitor in fluorogenic thrombin-generation measurements is only necessary at low tissue factor concentrations and influences the relationship between factor VIII coagulant activity and thrombogram parameters . Blood. Coag Fibrinolysis 19 (3) 183.
Aim: To evaluate three TGT assays in a group of patients with Haemophilia A using
a in-house normal pooled plasma to harmonise the results.
Peak Height
Ceveron® alpha
Severe Moderate Mild
0
20
40
60
80
100
%
ttPeak
Thrombogram®
Severe Moderate Mild
0
10
20
30
Min
Peak Height
In-house TGT
Severe Moderate Mild
0
20
40
60
80
%
ttPeak
In-house TGT
Severe Moderate Mild
0
20
40
60
Min
All HA
Peak Height Time to Peak
Sensitivity
%
Specificity
%
Likelihood
ratio
Sensitivity
%
Specificity
%
Likelihood
ratio
In-house TGT 99.0 94.4 17.8 86.6 94.4 15.6
Thrombogram® 92.7 95.0 9.3 77.0 95.0 15.4
Ceveron®
alpha 92.6 94.7 17.6 87.0 94.7 16.5
Mild HA
Peak Height Time to Peak
Sensitivity
%
Specificity
%
Likelihood
ratio
Sensitivity
%
Specificity
%
Likelihood
ratio
In-house TGT 93.8 94.4 16.9 75.0 94.4 13.5
Thrombogram® 92.3 90.0 9.2 61.5 95.0 12.3
Ceveron®
alpha 78.6 94.7 14.9 78.6 94.7 14.9
Peak height
Thrombogram®
Severe Moderate Mild
0
20
40
60
%
A B
C
D
E
F
Ceveron® alpha
Severe Moderate Mild
0
10
20
30
40
ttPeak
%
Table 1. ROC analysis of all haemophilia A patients (n = 46) Table 2. ROC analysis of mild haemophilia A patients (n = 10)
Acknowledgement: Technoclone Ltd Surry, UK