
Recommended
More Related Content
What's hot
What's hot (19)
Similar to Curry Capital Group Report
Similar to Curry Capital Group Report (20)
Recently uploaded
Recently uploaded (20)
Curry Capital Group Report
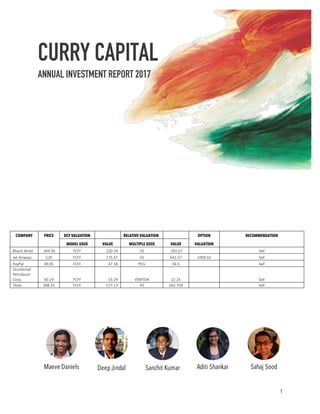
- 1. 1 CURRY CAPITAL ANNUAL INVESTMENT REPORT 2017 COMPANY PRICE DCF VALUATION RELATIVE VALUATION OPTION RECOMMENDATION MODEL USED VALUE MULTIPLE USED VALUE VALUATION Bharti Airtel 344.50 FCFF 220.74 VS 293.57 Sell Jet Airways 529 FCFF 175.37 VS 641.57 1009.16 Sell PayPal 49.05 FCFF 47.18 PEG 36.5 Sell Occidental Petroleum Corp. 60.19 FCFF 53.29 VEBITDA 22.25 Sell Tesla 308.35 FCFF 177.13 VS 265.759 Sell Maeve Daniels Aditi Shankar Sahaj SoodDeepJindal Sanchit Kumar
- 2. 2 BHARTI AIRTEL COMPANY OVERVIEW Founded in 1995 in New Delhi, India, Bharti Airtel is a leading provider of telecommunications services, operating the largest mobile network in India and third largest worldwide. It currently trades on both the Bombay Stock Exchange (BSE) and the National Stock Exchange of India (NSE). Positioned squarely in the telecommunications services industry, its business lines are split among mobile services, offering GSM mobile services directly to customers nationwide; telemedia services, providing Internet connectivity services to households; business services, offering voice, data, network integration, and data center services to large-, medium- and small-enterprises as well as government stakeholders; and direct-to-home direct TV services. This wide range of services is naturally underpinned by the rapid gains in Internet and communication technologies that have swept the world over the company’s lifetime; yet, Bharti has succeeded in chiseling a niche in the market driven by its outsourcing strategy. While it maintains robust infrastructure domestically in the form of optical fibers and points of presence (POPs), facilitating multiprotocol label switching (MPLS) and synchronous digital hierarchy (SDH) to ensure rapid and reliable delivery. Though its core business has thrived in India, seeing roughly 71% of revenues as of Q3 2016, the group has diversified its geographic reach to operate in 17 other countries in Africa1 and the Asia-Pacific region, among them Sri Lanka and Bangladesh. As such, its most technologically-developed operations have taken root in India, offering 2G, 3G, and 4G wireless services, mobile commerce, fixed line services, and high speed DSL broadband. In its other regions, it offers 2- and 3G wireless services and mobile commerce. DCF VALUATION: NUMBERS AND NARRATIVES 1 The complete list of African countries in which Airtel operates is: Burkina Faso, Chad, Democratic Republic of the Congo, Gabon, Ghana, Kenya, Madagascar, Malawi, Niger, Nigeria, Republic of the Congo, Rwanda, Seychelles, Sierra Leone, Tanzania, Uganda, and Zambia. These operations, while recognized as part of the parent Bharti Airtel, are managed by a subsidiary called Airtel Africa. Stable Growth NOL: ₹0 EBIT: ₹ 197,406.85 Current Revenue: ₹ 984,933.00 Current Margin: 20.04% Revenue Growth: 7.08% Sales Turnover Ratio: 0.95 Competitive Advantages Expected Margin: 20.04% Value of Op Assets ₹ 1,953B + Cash ₹ 53.76B - Value of Debt ₹ 1,221B - Minority Interests ₹ 56.69B + Non-Op. Assets ₹ 156.8B Value of Equity ₹ 884.9B - Value of Options ₹ 2.5B Value per share ₹ 220.74 All existing options valued as options, using current stock price of ₹ 344.50. Stable Revenue Growth: 4.43% Stable Operating Margin: 20.04% Stable ROC = 6.70% Reinvest 66% of EBIT (1-t) Terminal Value: ₹ 84.073B / (6.70% – 4.43%) = ₹ 3,699B Riskfree Rate: India Govt Bond 10 Year Rate 6.971% - Country Default Spread 2.540% Risk – Free Rate 4.430% Beta 0.92 Telecommunications Services Current D/E : 74.89% Risk Premium 9.57% Geographic Region Risk Premium: India x 76.28% 8.82% Africa x 22.68% 12.00% South Asia x 1.04% 11.45% Cost of Equity: 13.22% Cost of Debt: 5.99% 4.43% + 1.60% + 3.13% = 9.16% Tax Rate = 34.61% Weights Debt = 74.89% Used credit rating of Baa2 / BBB to determine appropriate default spread. Terminal Year: Rev : ₹ 1,811B CoC : 6.70% Tax : 34.61% EBIT(1-t) : ₹ 247.9B Reinv. : ₹ 163.8B FCFF : ₹ 84.1B Bharti Airtel in May 2017 In Millions INR Maeve Daniels Low = 15.5% Base = 20.24% High = 25% Low = 0.69 53.44₹₹ 153.10₹₹ 281.13₹₹ Base = 0.82 82.56₹₹ 199.73₹₹ 327.75₹₹ High = 0.95 103.72₹₹ 220.88₹₹ 348.90₹₹ Target EBIT Margin Sales to Capital 1 2 3 4 5 6 7 8 9 10 Revenues 1,054,666.26₹₹ 1,129,336.63₹₹ 1,209,293.66₹₹ 1,294,911.65₹₹ 1,386,591.40₹₹ 1,477,407.68₹₹ 1,566,335.99₹₹ 1,652,309.34₹₹ 1,734,237.87₹₹ 1,811,030.47₹₹ EBIT (Operating Income) 211,383.25₹₹ 226,349.19₹₹ 242,374.71₹₹ 259,534.84₹₹ 277,909.90₹₹ 296,111.91₹₹ 313,935.51₹₹ 331,166.87₹₹ 347,587.53₹₹ 362,978.82₹₹ EBIT(1 - t) 107,805.46₹₹ 115,438.08₹₹ 123,611.10₹₹ 132,362.77₹₹ 141,734.05₹₹ 159,539.17₹₹ 178,177.24₹₹ 197,488.05₹₹ 217,283.92₹₹ 237,351.85₹₹ - Reinvestment 73,411.36₹₹ 78,608.89₹₹ 84,174.40₹₹ 90,133.95₹₹ 96,515.43₹₹ 95,606.42₹₹ 93,618.87₹₹ 90,508.05₹₹ 86,249.88₹₹ 80,843.06₹₹ FCFF 34,394.09₹₹ 36,829.20₹₹ 39,436.70₹₹ 42,228.82₹₹ 45,218.62₹₹ 63,932.75₹₹ 84,558.37₹₹ 106,980.00₹₹ 131,034.03₹₹ 156,508.78₹₹ 1 2 3 4 5 6 7 8 9 10 Revenues EBIT (Operating Income) EBIT(1 - t) - Reinvestment FCFF Cost of Capital Cumu. Discount Factor Sales to Capital Ratio Invested Capital Cost of Capital 10.13% 10.13% 10.13% 10.13% 10.13% 9.44% 8.76% 8.07% 7.39% 6.70% Cumu. Discount Factor 0.9081 0.8246 0.7488 0.6799 0.6174 0.5641 0.5187 0.4800 0.4470 0.4189 Sales to Capital Ratio 0.95 0.95 0.95 0.95 0.95 0.95 0.95 0.95 0.95 0.95 Invested Capital 1,929,343₹₹ 2,007,952₹₹ 2,092,127₹₹ 2,182,261₹₹ 2,278,776₹₹ 2,374,383₹₹ 2,468,001₹₹ 2,558,509₹₹ 2,644,759₹₹ 2,725,602₹₹ Takes into account a composite Equity Risk Premium of based upon business operating regions: Africa, India, Bangladesh and Sri Lanka. + x Based upon an industry unlevered beta of 0.62. Scenario Analysis
- 3. 3 In today's ever-digitizing world, telecommunications often serves the crucial social glue across people groups. Founded in 1995 in New Delhi, India, Bharti Airtel has been positioned with one of the largest demographic bases in the world from its inception, allowing it to capitalize on the digital revolution that has occurred over the past two decades to make India the second-largest telecommunications market in the world today. With such a mix of products that may serve rural and urban regions alike, Airtel's geographic reach and technical expertise are lasting competitive advantages that have allowed it to diversify both its business and location-based risks and realize success. Its customer base is now well over 360 million individuals, roughly a ten percent year-over-year growth in customer acquisition. As such, its current revenue growth rate has been modeled at 7.08%, reflective of the historical five-year average of its revenue growth rate. Coupled with consistent and accelerating growth in ‘Total Minutes Spent on Network’—what we identified to be a key revenue driver given the strength of the mobile services business and its pay-per-minute revenue model—this bodes well for the sustainability of such revenue growth in the near-term. While teledensity in India is currently around 84%, having grown exponentially over the past decade, this can be expected to reach nearly 100% within the medium-term, leading to a natural upper limit on the gains that can be realized from such a trend and attendant slowdown in revenue growth. As a conservative estimate, we expect this number to scale downwards to settle at 4.43%, the risk-free rate utilized in the valuation. Though the global industry average operating margin is 15.2%, the team agrees that Bharti's operating margin is one of its key competitive advantages that it will continue to maintain over the near-term, due to its cost model utilizing the low-cost, high-volume ‘minutes factory’ approach. Even so, for the sake of conservatism, we assumed that the operating margin will neither improve nor worsen over the horizon. Airtel’s current African markets in a high effective tax rate of nearly 50%, however, we recognize that Airtel’s intention to consolidate its African markets will lessen the significance of high-tax business environments and cause its tax rate to approach India’s marginal tax rate. Additionally, Airtel’s current inefficiency in utilizing its capital (its sales-to-capital ratio) can be attributed to its large and poor capital project choices. However, its impending consolidation will serve to increase its sales-to-capital ratio—here to 0.95—particularly in focusing back upon markets in which the appropriate technological infrastructure already exists without needing significant capital investments. Ultimately, it is assumed that the telecommunications sector will have lower risk than others, given its governmental preference as well as lower-risk operations, thus leading to a lower cost of capital in the long run than the firm currently faces RELATIVE VALUATION In order to derive a relative valuation, the team turned to S&P Capital IQ to collect the data of a sample of 30 comparable companies which serve to provide an accurate industry regression—the “direct comparison” approach. These companies share various ‘fundamentals’ with Airtel, such as market capitalization (greater than $15B, compared to Airtel’s $21.4B) and, of course, primary industry (telecommunications), while spanning a wide geographic range to paint a more holistic ‘global’ picture and control for geographic risk factors through diversification. Given the large infrastructural investments required to support a telecommunications company as well as the philosophical importance of sales in a customer-centric industry, the team felt it appropriate to utilize a firm-wide EV-Sales multiple for the regression. As seen below, the R-squared correlation metric is 49.87%, suggesting that the regression can be considered relatively representative of the observations. More importantly, however, the T-values for each of the independent variables chosen —3-year revenue CAGR as an indicator of growth, operating margin as an indicator of profitability, and reinvestment rate as
- 4. 4 a proxy for growth efficiency—were observed to be statistically significant and therefore telling in the context of our regression. Using our regressed equation, we derived a predicted multiple of 2.46x, below its actual 2.68x based on today’s market pricing. Backing out enterprise and equity values, we obtained a predicted value per share of ₹293.57, of which Airtel’s current trading price is 117.35%. The simpler, traditional ‘average-comps’ approach yields an average EV / Sales multiple of 2.63x and implied share price of ₹333.80, still 103% of the current trading price. Though this value reveals only slight overvaluation—surely not enough ceteris paribus to sway our position—we believe that the level of overvaluation indicated by the regression equation should give us pause when considering our portfolio. MARKET REGRESSION VALUATION The market regression equation for EV / Sales for Global companies (Damodaran, January 2017) shown below proves insufficient when used to price this company. Its yielded predicted multiple value is 1.18x, resulting in a negative equity value and implied share price of - ₹4.37. Clearly, this value cannot be trusted nor utilized when analyzing the company at hand. Given this regression’s low R-squared value of 8.80%, however, the team had not expected a telling result. Adopting a slightly different perspective, we decided to examine the market regression equation for EV / Sales for Emerging Markets Companies (Damodaran, January 2017) seen below. Though its yielded predicted multiple value was slightly more optimistic at 1.24x, resulting in a positive equity value, the implied share price remained mere peanuts, at ₹9.52, 3621% of its current trading price. With an R-squared EV / Sales = 2.137 - 2.83 Total Revenues, 3 Yr CAGR % [LTM] + 4.85 Operating Margin + 0.253 Reinvestment Rate EV / Sales = 2.53 + 0.32 g + 4.91 Op. Margin + 2.50 DFR - 2.30 Tax Rate
- 5. 5 value of 6.60%, we were confident that this result provided an even murkier picture of the company’s true pricing. CONCLUSION Both our intrinsic (DCF) valuation and relative valuation approaches suggest that Bharti Airtel is overvalued, leading us to a natural conclusion to sell. Though a mature, stable company who does not quite face the same volatilities or risks of failure as other younger companies may, its recent track record of poor investment project choices—particularly in its African markets—give us pause to reconsider the intrinsic soundness of the company’s growth trajectory. It should also be noted that the DCF is built upon even the most generous of reinvestment assumptions. Though operating margin can reasonably be expected to (conservatively) remain the same or (optimistically) improve as operating losses in the African markets are consolidated, it remains to be seen whether Airtel will be able to capture and integrate the advances in technological efficiency without attendant investments in technological infrastructures: the key trade-off in this scenario. RECOMMENDATION SELL. As our estimated value per share is a mere ₹220.74 relative to the current trading price of ₹344.50, we believe this is an excellent opportunity to recognize some upside. Particularly in view of the recent downward trend in its stock price, we would advise this change in position occur as soon as possible. EV / Sales = 3.13 + 0.62 g + 3.60 Operating Margin - 1.70 DFR - 3.70 Tax rate
- 6. 6 JET AIRWAYS COMPANY OVERVIEW Jet Airways is the second largest airline in India after Indigo with 21.2% passenger market share. It operates over 300 flights daily to 68 destinations worldwide including 45 domestic and 20 international destinations in 15 countries across Asia, Europe and North America from its main hubs situated in Mumbai, Chennai, Bangalore and Kolkata. Most of its flights are domestic connecting across the metropolitan cities in India. This is a money losing company as it reported significant losses for 8 consecutive years from 2007 to 2015. Jet Airways is operating in an extremely competitive and cyclical market with rising capital expenditures, extremely high debt levels, and declining margins as most aviation companies in South Asia have been incurring significant losses. The company revived itself with a 24% stake sale to Etihad in 2013 which apart from giving it a necessary cash infusion also brought about synergies in terms of joint fuel uplift, marketing and sales. Jet Airways was finally able to earn a profit of 3971.6 million Rs in 2016-2017, thus indicating some positive signs in the future. However, it is important to note that the profit was primarily a result of a reduction in fuel prices which reduced the airline’s fuel costs by 27%. DCF VALUATION : NARRATIVES AND NUMBERS Jet Airways is a mature company that has been in the declining phase with the book value of equity being negative. Jet Airways has been able to generate profits in 2016, and is looking to continue improving its financial conditions. The team has used the FCFF model to calculate the net present value for its future cash flows. To estimate the revenue growth rate as a value driver for Jet Airways, we looked at the revenue growth rate for Jet Airways in the last 5 years which was approximately 11.28%. On the other hand, the global industry average for revenue growth in the last 5 years was significantly lower at 6.08%. Considering that Jet Airways grew its revenues while being in financial distress, we have assumed that it would be able Operating Countries India x 100% 8.82% Stable Growth NOL: 79511.6 EBIT: 13922.8 Current Revenue: 219993.5 Current Margin: 6.33% Revenue Growth: -7.75% Sales Turnover Ratio: 2.05 Competitive Advantages Expected Margin: 11.05% Value of Op Assets: 167921 + Cash 14777.3 - Value of Debt 162776.4 Value of Equity 19922.11 - Equity Options 0 Value per share 175.37 Stable Revenue Growth: 4.41% Stable Operating Margin: 11.05% Stable ROC = 8.91% Reinvest 49.49% of EBIT(1-t) Terminal Value: 20193.51 / (8.91% – 4.41%) = 448744.70 Riskfree Rate: India Treasury 10yr Bond rate = 4.41% Beta 0.50 Air Transport Operating Leverage Current D/E : 218% Risk Premium 8.82% 1 2 3 4 5 6 7 8 9 10 Cost of Equity: 15.17% Cost of Debt: 4.41% + 3.50% + 2.54% = 10.45% Tax Rate = 34.61% Weights Debt = 69% ; Equity = 31% Used S&P credit rating to determine appropriate default spread. ∞ Terminal Year: Revenues : 553354 COC: 8.91% Tax Rate : 34.61% EBIT (1 – t) : 39983 Reinv.: 19790 FCFF : 20193 Jet Airways in May 2017 In Millions INR Deep Jindal Revenues 219,993.50 244,808.77 272,423.20 303,152.53 337,348.14 375,401.01 412,588.23 447,790.26 479,843.09 507,597.21 529,982.25 EBIT (Operating income) 13,922.80 16,649.10 19,813.30 23,479.51 27,720.70 32,619.97 37,799.24 43,138.41 48,491.73 53,692.99 58,563.04 EBIT(1-t) 8,714.28 16,649.10 19,813.30 23,479.51 24,671.41 20,416.84 23,658.55 27,000.33 30,350.97 33,606.44 36,654.61 - Reinvestment 21,597.27 24,033.45 26,744.42 29,761.19 33,118.25 32,364.86 30,637.10 27,896.28 24,155.03 19,482.19 FCFF (4,948.17) (4,220.14) (3,264.91) (5,089.78) (12,701.41) (8,706.31) (3,636.77) 2,454.69 9,451.42 17,172.42 Costofcapital 9.5% 9.5% 9.5% 9.5% 9.5% 9.3% 9.2% 9.1% 9.0% 8.9% Cumulateddiscountfactor 0.91364235 0.83474235 0.76265597 0.6967948 0.63662124 0.58222077 0.53299734 0.48842017 0.44801626 0.41136375 PV(FCFF) (4,520.86) (3,522.73) (2,490.01) (3,546.53) (8,085.99) (5,069.00) (1,938.39) 1,198.92 4,234.39 7,064.11
- 7. 7 to maintain this growth of 11.28% over the next 5 years as well going forward. While estimating the Operating Margin for Jet Airways in year 10, we assumed that Jet Airways would be able to improve its operations and achieve the global industry average of 11.05%, which is an optimistic assumption considering the financial situation it is in currently. Finally, we believe that Jet Airways wouldn’t increase its reinvestment rate significantly considering its budgetary constraints of high-levels of debt and thus have estimated the sales to capital ratio to be 1.15, which was the average ratio in the previous 5 years. Using a bottom up levered beta of 1.22, the cost of equity comes up to 15.17%. With an after-tax cost of debt of 6.83% and a debt capital ratio of 69%, the cost of capital for Jet Airways is 9.45%. Finally, to calculate terminal value, we have ruled out the assumption that the company will have a cost of capital like mature companies after 10 years. Jet Airways is already a mature company with a cost of capital of 9.45% and that is the cost of capital we are assuming after year 10. We have however assumed that the company will be earning a return on capital equal to the cost of capital, because we don’t believe that Jet Airways has any long-lasting competitive advantages going forward that it would allow it to earn a higher return on capital. Using all these estimations, the DCF model tells us that the estimated value per share for Jet Airways is 175.37 Rs. The current share price is 529 Rs and thus we believe that the equity is overvalued by 302%. There are a multiple number of reasons we feel that the share price is overvalued by the market. To begin with, Jet Airways was finally able to make profits in 2016 after 8 years and also released positive earnings in the third quarter which has led to investors being bullish about the stock due to a short termism approach which ignores the operational problems of Jet Airways, its previous years of losses and its high debt levels. Another reason for the spike in the stock price have been speculations that Etihad Airways is planning to raise its stake in Jet Airways from 24% to 49%. Jet Airways’ ability to earn profits in 2016 was not due to significant improvement in operational efficiency or turnaround by management but due to the reduction in fuel prices by 27% thus lowering Jet Airways’ operational expenses. We clearly believe that Jet Airways has thus benefitted from market conditions in the recent times and we look forward to see if the aviation company is able to improve its future cash flows going forward. Going forward, the management is planning to use its cash flows and raise 300-million-dollar equity to finance expansion abroad. However, the company has high levels of debt with a debt capital ratio of 0.69 and its return on capital is 5.89% which is far lower than its cost of capital of 9.45%. Thus, we believe Jet Airways could increase shareholder value by using its cash flows to pay back its debt and pay dividends rather than using it for expansion purposes. RELATIVE VALUATION The team collected data from S&P Capital IQ and used 31 companies as comparable to construct the industry regression. All comparable companies were public companies that fell under the ‘airline services’ sector within the Asian emerging market sector. Since Jet Airways has a negative book value of equity, we decided to use a firm multiple for our valuation. To choose the best multiple, we ran regressions across multiples like EV/Sales, EV/EBITDA and EV/FCFF using different proxies for revenue growth, risk and re- investment rate found out that EV/Sales had the highest R-Square of 51.08% as shown below:
- 8. 8 We then checked the correlations to find which proxies had the highest correlation with EV/Sales multiple and had the lowest correlations amongst each other. This analysis can be found in Appendix A. Finally, we ran a regression again using these three variables, to get a regression equation of: Using Jet Airways’ numbers, the predicted EV/Sales was 0.86 while the actual EV/Sales is 0.56. Moreover, the estimated value per share for Jet Airways would be 641.57 Rs as opposed to the current market share price of 529 Rs. We believe that the major reason why relative valuation gives us an undervalued result for Jet Airways is because most of the comparable aviation companies used in the analysis are in the emerging Asian market have been incurring huge losses, which makes Jet Airways relatively better. Increasing the sample size to include aviation companies in more developed developed markets may tell us a different story. OPTION VALUATION Since Jet Airways is a money-losing firm with high levels of debt (50%), we felt that it would be insightful to value the company as a call option. We inputted the value of operating assets as the underlying asset of the option and estimated the variance as the global air-transport industry variance of 46.40%. Further inputting the cumulative face value of debt, average maturity of 5 years and riskless Indian rate of 6.94%, the value per share amounted to 1009.16 Rs. This would be the value of the call option if liquidated in the future and thus explains what the potential share price could be considering the variance of 46.40% and the time value of money. The option valuation also revealed that Jet Airways’ probability of default is 48%, which is fair considering that auditors had raised a red flag regarding the company’s ‘going concern’ status recently in 2013 RECOMMENDATION: The DCF Valuation is most suited to value Jet Airways because it takes a long-term approach and finds an intrinsic value of the company by incorporating the key value drivers of the company. It doesn’t get affected by the short-term positive swings of the market and tunnel-vision approach of the EV/Sales = 0.416 + 0.525 5 Year Beta [Latest] + 4.69 Operating Margin- 1.102 Total Revenues, 10 Yr CAGR % Regression Analysis: EV/Sales versus 2 Year Beta , 5 Year Beta , 1 Year Beta , ... Analysis of Variance Coefficients Term Coef SE Coef T-Value P-Value VIF Constant 0.597 0.241 2.48 0.022 2 Year Beta [Latest] -0.018 0.403 -0.04 0.965 2.74 5 Year Beta [Latest] 0.457 0.314 1.46 0.160 2.23 1 Year Beta [Latest] -0.249 0.243 -1.02 0.318 2.10 Operating Margin 4.25 1.55 2.74 0.012 1.28 Total Revenues, 10 Yr CAGR % [L -1.13 1.11 -1.02 0.321 1.84 Total Revenues, 5 Yr CAGR % [LT -1.14 2.90 -0.39 0.699 4.13 Total Revenues, 3 Yr CAGR % [LT 0.75 3.24 0.23 0.819 6.79 Total Revenues, 1 Yr Growth % [ 0.65 1.46 0.45 0.660 3.60 Reinvestment Rate -0.0153 0.0226 -0.68 0.506 1.14 Model Summary S R-sq R-sq(adj) R-sq(pred) 0.457992 51.08% 30.11% 0.00%
- 10. 10 PAYPAL HOLDINGS COMPANY OVERVIEW On July 17, 2015, PayPal Holdings became an independent publicly traded company by spinning off from eBay. It is a leading technology platform and digital payments company whose vision is to democratize the financial services. PayPal offers a two-sided proprietary global technology platform to facilitate the processing of payment transactions around the globe. This business is mature as they already have over 197 million users and process over 6.1 billion transactions. PayPal is also available in more than 200 countries and support 25 currencies. They will seek to expand their global capabilities in this business by increasing their customer base and scale and expand their value proposition to customers. The growth of their new business, digital payments, will depend on the expansion of multiple commerce channels, the growth of mobile devices and merchant applications, the growth of consumers globally with Internet and mobile access, and the pace of transition from cash and checks to digital forms of payment. Their strategy will be to build new strategic partnerships to acquire new customers, recreate its role in the digital ecosystem, and focus on innovation in the digital world. PayPal faces high competition as they compete with a wide range of businesses including banks, credit card providers, technology and ecommerce companies, and traditional retailers. They have also completed four acquisitions in 2015, which include Xoom, Paydiant, and CyActive. DCF VALUATION: NUMBERS AND NARRATIVES PayPal is not only a processing company but is becoming a digital payments company by entering mobile payments on behalf of consumers and merchants worldwide. CEO Dan Schulman’s vision aligns with moving to being more mobile-banking friendly. Its mature business (payment processing) will witness decreasing revenues and operating margins due to increased competition and concessions granted in several Stable Growth NOL: - EBIT: $1721.69 Current Revenue: $11,273 Current Margin: 15.27% Revenue Growth: 20% Sales Turnover Ratio: 1.86 Competitive Advantages Expected Margin: 14.9% Value of Op Assets $48,339.30 + Cash $8,928.00 = Firm Value $57,267.30 - Debt $481.65 = Equity $56,785.65 - Equity Options $105.45 Value per share $ 47.18 All existing options valued as options, using current stock price of $49.05. Stable Revenue Growth: 2.33% Stable Operating Margin: 14.9% Stable ROC = 6.83% Reinvest 34% of EBIT(1-t) Terminal Value: $68,326.50 * 0.5370 = $36,689.37 Riskfree Rate: 10 year t-bond rate = 2.33% Beta: 0.63 Internet Merchant Services Unlevered Industry Beta corrected for cash Current D/E : 0.82% Risk Premium: 6.20% Single Business Operating Countries ERP Country Risk Premium: 6.20% 1 2 3 4 5 6 7 8 9 10 Cost of Equity: 6.26% Cost of Debt: 2.33% + 1.6% = 3.93% Tax Rate = 30% Used S&P credit rating (BBB/Baa2) to determine appropriate default spread (1.6%). ∞ Terminal Year: Rev: $44743.04603 COC: 6.83% Tax Rate: 30% EBIT (1 – t): $4,666.70 Reinvestment: $1,592.01 FCFF: $ 3,074.69 PayPal as of May 2, 2017 In Millions USD Sanchit Kumar Cost of Capital: 6.24% Debt to Capital = 0.81% Sales to Capital ratio is internet merchant services industry average. Expected margin is weighted average of comparables (Global Payment for Mobile Payments & Total System Services for Transaction Processing) New business of mobile payments = high growth Sensitivity Analysis:
- 11. 11 partnerships with competitors (Visa, Mastercard, and Discover) to have several retail point of sale solutions for its new mobile payments business. Yet, its vision to enter the massive payments industry coupled with monetizing recent payment and social media acquisitions like Venmo and Braintree will fuel high revenue growth at 20% and a high return on capital at 18.35% at year 10. In the future, competition from Amazon and Apple in mobile payments will cap its revenues (in the 10th year) much below these giants. In the FCFF model, the team assumes that expected margins will decrease over time due to increasing competition in digital payments and payments processing. A 30% Tax rate was used as we expect changes in the US Tax Code in the near future. Additionally, we assume the internet merchant services industry reinvestment rate (or sales to capital ratio) as PayPal is likely to reinvest into its new business like other online technology companies. We also assume that it will function as a mature company after year 10 since it already has a mature business, and therefore its cost of capital will likely parallel that of a mature company (6.83%). Although the team sees PayPal earning a ROC higher than its COC for the next 10 years, its competitive advantages it has today will likely fade over time since it will face high competition in both industries. These assumptions provided a value per share of $47.18. It is overvalued since its current stock price is $49.05. After carrying out a sensitivity analysis in which the key variables for the valuation are its expected operating margin and its growth rate, the team is confident to suggest that PayPal is overvalued since a growth rate of 20% is fairly optimistic. RELATIVE VALUATION By removing negative and extreme multiples, the team collected data from S&P Capital IQ and used 18 companies as comparable to construct the industry regression. All comparable companies fell under the ‘internet merchant services’ sector and had market caps of greater than $1 billion. Further, only public companies were chosen and global companies were used since PayPal operates in over 200 countries and has a diversified revenue stream. Since companies in this sector have very different growth rates, the team decided to choose the PEG ratio to eliminate differences in growth. They key intrinsic value factors in PEG include payout, growth, and risk. However, since our sample size was relatively small, we only used two variables (growth and risk) to conduct the regression. The team assured that the PEG ratio was consistent -- growth must be matched up to the EPS on which it is based. Since most expected growth rates are off trailing earnings, the team decided to use a trailing PEG. After creating a correlation matrix of differing metrics for growth and risk, the highest correlations with the multiple and least correlation between independent variables helped choose the respective independent variables for growth and risk (2 year beta and expected growth 2 year). After running scatterplots of PEG against each variable, it was imperative to take an LN of growth since this would increase the R-squared as the relationship between expected growth and PEG was not linear. As a result, the R-squared increased as shown in this fitted line plot: 4.03.53.02.52.01.51.0 5 4 3 2 1 0 S 0.682473 R-Sq 71.1% R-Sq(adj) 69.1% Ln(growth) PEG Fitted Line Plot PEG = 5.159 - 1.167 Ln(growth)
- 12. 12 The regression results are as follows: The median PEG Ratio for the industry was 1.68, which yields a share price for PayPal of $60.74. We also applied the regression equation to PayPal’s current variables (growth and beta) to yield a multiple of 2.60 and corresponding share price of $36.50. This indicates that PayPal is overpriced. MARKET REGRESSION VALUATION The market regression equation for PEG for US stocks (Damodaran, January 2017) is: With these values, PayPal has a negative PEG ratio (-3.27). As a result, this regression is meaningless for PayPal. CONCLUSION Both our valuation and pricing metric suggest that we should SELL PayPal Holdings. Our DCF valuation suggests that the stock is fairly priced; however, since we use a fairly optimistic growth rate of 20% to make this estimate, PayPal Holdings is unlikely to generate higher growth and reach a higher share price. This is overwhelming evidence that PayPal is overvalued. RECOMMENDATION Sell. Based on our DCF valuation of $47.18, we recommend selling PayPal Holdings at the current price of $49.05. PEG = 0.50 + 0.51 Payout Ratio – 1.09 ln(gEPS) - 0.60 Beta Regression Analysis: PEG versus Risk, Ln(growth) Model Summary S R-sq R-sq(adj) R-sq(pred) 0.705850 71.11% 66.99% 55.28% Coefficients Term Coef SE Coef T-Value P-Value VIF Constant 5.068 0.872 5.81 0.000 Risk 0.074 0.490 1.41 0.882 1.01 Ln(growth) -1.164 0.200 -5.83 0.000 1.01 Regression Equation: PEG = 5.068 + 0.074 Risk - 1.164 Ln(growth)
- 13. 13 OCCIDENTAL PETROLEUM CORPORATION COMPANY OVERVIEW Occidental Petroleum Corporation (OXY), founded in 1920, engages in the acquisition, exploration, and development of oil and gas properties in the United States and internationally. The company operates in three segments: Oil and Gas, Chemical, and Midstream and Marketing. The Oil and Gas segment explores for, develops, and produces oil and condensate, natural gas liquids (NGLs), and natural gas. The Chemical segment manufactures and markets basic chemicals, including chlorine, caustic soda, chlorinated organics, potassium chemicals, ethylene dichloride, chlorinated isocyanurates, sodium silicates, and calcium chloride; vinyls comprising vinyl chloride monomer and polyvinyl chloride; and other chemicals, such as resorcinol. The Midstream and Marketing segment gathers, processes, transports, stores, purchases, and markets oil, condensate, NGLs, natural gas, carbon dioxide, and power. This segment also trades around its assets consisting of transportation and storage capacity, as well as oil, NGLs, gas, and other commodities. Over the last 2.5 years, the oil industry experienced its deepest downturn since the 1990s. After OPEC agreed to cut production late last year, oil prices strengthened for several months. However, as spring rolled around, US inventories began to build, and prospects of stronger oil prices have faded somewhat. While OXY has certainly seen consecutive years of negative earnings/growth, the company is heavily diversified within the Oil and Gas sector. As an ‘Integrated Oil and Gas’ company, OXY seems to be hedged against overall oil price volatility. In recent years, OXY’s Chemical & Midstream and Marketing arms have done extraordinarily well. Furthermore, OXY has divested of unprofitable plants in California and North Dakota, while developing new partnerships in lucrative areas outside of the oil sector. In early 2011, Occidental partnered with Abu Dhabi’s state oil company in developing the Shah Field, one of the largest natural gas fields in the Middle East, through a joint venture known as Al Hosn Gas. Al Hosn Gas became operational in 2015. While Occidental will certainly see short-term setbacks as oil prices become more volatile and the company diversifies further, strategic management decisions could generate long-term returns. DCF VALUATION: NUMBERS AND NARRATIVES
- 14. 14 As OXY is an integrated oil and gas company, its earnings are not fully dependent upon oil price volatility. Therefore, in the valuation process, the team chose to apply a FCFF approach in conjunction with an options valuation approach (to account for the undeveloped reserves of oil, gas, and LNGs). In determining the marginal cost of extraction, the team analyzed the volumes of each natural resource in each country, then used the country average to determine the final number. Growth numbers (25%) are primarily based upon OXY’s timeline of production/plant development, and historic growth figures after plant development. As plants become fully operational, OXY will naturally reap higher revenues Both the sales to capital ratio (2.5) and target operating margin (15%) are certainly above the industry averages and drawn from assumptions of high growth within the mid-market and chemicals sector – as previously mentioned, OXY is highly diversified (and more diversified than many of its competitors). This works as an advantage for OXY, especially as it develops its chemical and mid-market segments further. Still, however, relatively aggressive growth estimates yielded a value per share of $53.29, approximately $7 less than OXY’s early May trading price. As pundits and economists postulate, markets are inefficient: OXY’s status as ‘overvalued’ could indicate the market expectation that oil prices will go up. However, as previously mentioned, OXY is highly diversified and may not follow the same pattern as that of oil prices. OXY’s structural issues (huge piles of debt) have only been ameliorated recently, and the company will only start to see growth as new ventures become fully operational. Further, the team assumed that the ROC would exceed the COC (8.6%) in the years after the terminal year. The team believes that the firm has long- lasting competitive advantages in its level of diversification – OXY’s presence in the chemical and mid- market segments (and relative success in these) will propel it forward as competitors suffer through cyclical price patterns. RELATIVE VALUATION The team collected data from S&P Capital IQ and used 36 companies as comparable to construct the industry regression. All comparable companies fell under the ‘integrated oil & gas’ sector and had market caps of greater than $1 billion. Since companies in this sector see large amounts of the debt, the team chose to stick with a firm multiple (EV/EBITDA) for the regression. The R-sq correlation metric is relatively low, but as previously mentioned, each company’s level of diversification varies, so the industry may not have consistent metrics/levels of correlation. Further, the energy sector has seen significant volatility in light of policy decisions (OPEC) and environmental concerns. Model Summary S R-sq R-sq(adj) PRESS R-sq(pred) 4.80207 20.43% 12.73% 1058.37 0.00% Coefficients Term Coef SE Coef 95% CI T-Value P-Value VIF Constant 6.85 1.58 ( 3.63, 10.06) 4.34 0.000 Total Revenues, 1 Yr Growth % [ 0.0636 0.0327 (-0.0032, 0.1303) 1.94 0.061 1.03 1 Year Beta [Latest] 4.22 2.21 ( -0.29, 8.73) 1.91 0.066 1.03 Effective Tax Rate -1.55 1.62 ( -4.85, 1.75) -0.96 0.345 1.01 Regression Equation EV/EBITDA = 6.85 + 0.0636 Total Revenues, 1 Yr Growth % [ + 4.22 1 Year Beta [Latest] - 1.55 Effective Tax Rate
- 15. 15 The mean EV/EBITDA for the industry was 10.57, which yields a share price for OXY of $34.97, while the median EV/EBITDA for the industry was 8.56, corresponding with a share price of $26.44. We also applied the regression equation to OXY’s current variables (growth, beta, tax rate) to yield a multiple of 7.57 and corresponding share price of $22.25. Rather than using the conventional EV/EBITDA regression equation, we utilized proxies for risk (beta instead of WACC) to improve correlation numbers. Since our sample size was relatively small, we only used three variables to conduct this regression. Both values indicate that OXY is extremely overvalued (171% and 73%, respectively). MARKET REGRESSION VALUATION The market regression equation for EV/EBITDA for US stocks (Damodaran, January 2017) is: With these values, OXY yields a EV/EBITDA of 31.22 and a corresponding share price of $122.70. Clearly, the market regression equation does not account for industry-specific factors and may be generally unreliable for a company involved in multiple businesses and driven by commodity prices. Further, the low R-sq (6%) for the regression indicates low predictive ability. CONCLUSION The team ultimately places more weight on the DCF valuation. While both the DCF valuation and relative valuation point towards the same decision (SELL), the lack of correlation amongst oil/gas companies and the market in general makes relative valuation a weak method. Even though a company could be categorized as ‘integrated oil and gas,’ this may not indicate the same level of diversification across the board. As OXY is highly diversified, the relative valuation yielded generally unreliable numbers. DCF valuations are more robust, especially for negative earnings energy companies, which require additional analysis into undeveloped reserves, extensive lease commitments, and R&D costs. Relative valuations don’t necessarily take these factors into account. RECOMMENDATION Sell. Based on our DCF valuation of $53.29, we recommend selling Occidental stock at the current price of $60.19. EV / EBITDA = 35.83 + 7.60 g - 19.10 DFR - 24.40 Tax Rate - 147.60 WACC
- 16. 16 TESLA COMPANY OVERVIEW Tesla designs, develops, manufactures and sells high-performance fully electric vehicles, and energy storage systems, as well as installs, operates and maintains solar and energy storage products, including generation, storage and consumption. Tesla has established a global network of vehicle stores, service centers and Supercharger stations to accelerate the widespread adoption of Tesla products. Tesla’s vehicles, engineering expertise across multiple products and systems, intense focus to accelerate the world’s transition to sustainable transport, and business model differentiates them from other manufacturers. DCF VALUATION: NUMBERS AND NARRATIVES Tesla is a relatively young, high growth company with negative earnings. The team’s assumption for the key value drivers—5-year compounded annual growth rate, target pre-tax operating margin and sales-to- capital ratio—depended significantly on the story that the team believed for Tesla. In determining the type of company that Tesla has evolved into, we looked to the company’s competitive advantages. Tesla’s primary competitive advantages are the loyalty that the Tesla brand commands and its significant technological edge over its competitors. Brand Loyalty & Technological Edge Elon Musk contributes heavily to consumers’ perceptions of the company. Mr. Musk’s effect on the company can be compared to Steve Jobs’ effect on Apple during his time as Chairman and CEO of the Silicon Valley tech giant. Mr. Musk, much like Mr. Jobs, is an extremely effective showman and salesman primarily due to two reasons: the consistency of his vision for a sustainable future which is reflected in all of Tesla’s Stable Growth NOL: EBIT: (634.73) Current Revenue: 8,549.35 Current Margin: (7.4%) Revenue Growth: 50% Sales-to-Capital Ratio: 1.40 Competitive Advantages: Brand loyalty, technological advantage Value of Op Assets $37,444.82 + Cash $4,006.60 - Value of Debt $8,869.06 = Value of Equity $31,714.03 - Equity Options $2,823.73 Value per share $177.13 All existing options valued as options, using current stock price of $308.35. Stable Revenue Growth: 2.33% Stable Operating Margin: 9.8% Stable ROC = 9% Terminal Value: 8,632.20 / (7.50% – 2.33%) = $166,967.19 Riskfree Rate: T-Bond rate = 2.33% Beta = 0.945 Auto & Truck; Electronics (General) Unlevered beta corrected for cash Current D/E : 13.02% Weighted ERP: 5.86% ERP of USA, Norway, China, and Rest of the World. Cost of Equity: 8.38% Pre-Tax Cost of Debt: 2.33% + 5.5% = 7.83% Tax Rate = 30% Weights: Debt = 11.52% Equity = 88.48% Cost of Capital = 8.04% Used S&P credit rating to determine appropriate default spread. Terminal Year: $ 169,790.83 Revenues 7.50% COC 30% Tax rate $ 11,647.65 EBIT (1-t) $ 3,015.45 Reinvestment $ 8,632.20 FCFF Tesla in May 2017 In Millions USD Sahaj Sood
- 17. 17 products, and his ability to sell that vision from a superior, almost ideological standpoint. Tesla’s technological edge also distinguishes it from other automakers. One of the company’s significant breakthroughs is its lithium ion battery technology, whose energy storage capabilities have contributed greatly to the advancement of the range of fully-electric cars. Therefore, in its valuation, the team decided that Tesla should be viewed as much as a tech company as it is viewed an automotive company. Despite its acquisition of SolarCity late last year, the team believed that over the next decade, its margins would be driven mainly by its automotive business segment. These competitive advantages led us to select a target pre-tax operating margin of 9.80%, the same margin earned by high-end automaker BMW last year. This is despite Tesla’s shift towards becoming a mass-market producer of cars who typically earn a lower margin than our assumed target. We chose BMW as a point of reference as it primarily produces high end vehicles and also has a fully electric car in its fleet of offerings in the form of its ‘i’ Series. Value Drivers: Bridging the story-telling and number-crunching Our view of Tesla as a tech and automotive company drove our assumptions of the value drivers. For the sales-to-capital ratio, the team computed a weighted average measure. The weights used were the estimated value of the “Auto & Truck,” “Electronics (General)” and “Power” business segments relative to the estimated value of the whole business. To calculate the value of Tesla’s “Electronics (General)” business, the team split the revenues earned by the company over the last twelve months equally between that segment and the “Auto & Truck” segment. We then computed each segment’s estimated values by multiplying the respective revenues by the industry average EV/Sales ratios. We came to a sales-to-capital ratio of 1.40. Tesla’s anticipated release of the mass-market Model 3 is the main reason for the team’s 50% five-year compounded annual growth rate estimate. Early indications of consumer excitement for the Model 3 is evidenced by the 180,000 reservations that were made during the first day of ordering for the mass-market car, as reported by the Wall Street Journal. If Tesla can match supply with demand, we believe that our 50% growth rate is more-than-justifiable. The team also elected to override four key assumptions of the FCFF model. We believe that in stable growth, Tesla will have a cost of capital of 7.5%, higher than the typical ‘risk-free rate + 4.5%’ estimate for stable growth firms in maturity. This is driven by the company’s purchase of SolarCity, which operates in a nascent industry, and Mr. Musk’s track record of being a bullish, risk-taking CEO. We also overrode the assumption that Tesla will earn a return on capital equal to its cost of capital in maturity by assuming a 9% ROC. We qualify this by assuming that Tesla’s competitive advantages in technology and brand loyalty will not necessarily fade over the next decade and beyond. However, the team, recognizing Mr. Musk’s penchant for risk-taking and involvement in a variety of different projects which could indicate a lack of clear focus, coupled with the reality that many young growth firms fail, has decided to consider a 10% probability of failure for Tesla in the future. We chose 10% since Mr. Musk’s vision for his many companies appears to be unfolding on schedule and according to plan, yet his involvement in many other projects such as Spacex, Neuralink and The Boring Company could mean that he is spreading himself too thin. Finally, we overrode the assumption that the company has no losses carried forward from prior years into this valuation. Tesla is currently a negative earnings company with an NOL carried forward of $341.17 million that will shield its income from taxes. After incorporating these assumptions into the valuation model, the team arrived at a value per share of $177.13. The day close price as of May 7, 2017 was $308.35, indicating that the stock is overvalued by 74.08%. Below is a scenario analysis the team conducted:
- 18. 18 Value per share in 2027 assuming EBIT (Operating) margin = 8.5% Sales to Capital 1.28 (Auto) $56.41 1.40 (Weighted Average) $95.27 1.66 (Tech) $160.19 Value per share in 2027 assuming EBIT (Operating) margin = 9.8% Sales to Capital 1.28 (Auto) $138.27 1.40 (Weighted Average) $177.13 1.66 (Tech) $242.05 Value per share in 2027 assuming EBIT (Operating) margin = 11.5% Sales to Capital 1.28 (Auto) $245.33 1.40 (Weighted Average) $284.19 1.66 (Tech) $349.11 The analysis indicates that at 50% growth, Tesla would need an 11.5% growth and a slightly higher sales- to-capital ratio than the 1.40 weighted average to achieve a value per share similar to the market price. Assuming the same sales-to-capital ratio and pre-tax operating margin, the company would need to display growth of 61% to achieve $308.80 value per share. The team feels that this is unlikely, and that the market will eventually correct itself. Therefore, we recommend: SELL. RELATIVE VALUATION The team used S&P Capital IQ to screen for comparable companies in the ‘Storage Batteries’ and ‘Automobile Manufacturers’ sectors with market capitalizations greater than $1 billion to construct the industry regression. Our final screening contained 42 companies: 40 automobile manufacturers and 2 in the storage batteries sector. We chose to screen only for publicly traded companies across the world. Since Tesla is a negative earnings, high-growth company, the team opted to use the EV/Sales multiple. The key drivers of the EV/Sales multiple include operating margin, re-investment rate, revenue growth, and the weighted average cost of capital.After creating a correlation matrix of the various proxies for growth, risk, and cash flow potential, the team considered proxies with high correlations to the multiple and low correlations between independent variables themselves to contain multi-collinearity. The team ran some initial regressions to obtain a clearer picture of which independent variables best predicted the EV/Sales by examining different R-Squared and t-value results. The following shows our final regression results: Model Summary S R-Sq R-Sq (Adj.) 0.794554 65.71% 62.00% Coefficients Term Coefficient SE Coeff. T-Value P-Value VIF Constant 1.082 0.297 3.65 0.001
- 19. 19 Total Revenues, 5 Yr CAGR [LTM] 5.094 0.697 7.31 0.000 1.08 Pre-tax Operating Margin 3.60 2.51 1.44 0.159 1.06 5-year beta -1.132 0.223 -5.08 0.000 1.13 DFR 0.222 0.724 0.31 0.761 1.10 Regression Equation Inputting the independent variables into the regression equation yielded a predicted EV/Sales of 5.37. The price per share predicted for Tesla using this multiple is $265.76, 16% overvalued. The team chose to use 5-year beta as the risk measure because of its significantly higher significance compared to DFR. We also excluded re-investment to stay consistent with our belief that automakers’ reinvestment rates are not properly representative of Tesla’s, which reinvests more in line with tech companies. Market Regression Equation Inputting the independent variables into the market regression equation yielded a predicted EV/Sales of 3.57. The price per share for Tesla using this multiple is $171.65, 80% overvalued. RECOMMENDATION Sell. Based on our DCF valuation of $177.13, we recommend selling Tesla at the current price of $308.35. EV / Sales = 1.082 + 5.094 Total Revenues, 5 Yr CAGR [LTM] + 3.60 Pre- tax Operating Margin - 1.132 5-year beta + 0.222 DFR EV / Sales = 2.93 – 0.65 g + 4.48 Operating Margin + 1.80 DFR – 1.80 Tax Rate
- 20. 20 APPENDIX APPENDIX A: MULTICOLLINEARITY TESTS, JET AIRWAYS We found out that 5-year beta, 10 Yr Revenue CAGR and Operating Margin had all the highest correlation with EV/Sales and had very low correlations with each other. Operating Margin’s T-Value is 2.74 while 5- Year Beta’s T-Value is about 1.5 and are thus both statistically significant. Revenue 10 YR CAGR has a T- Value of 1.02 which is lower than the statistically significant threshold of 1.5, but we have included it as one of our chosen proxies for a more holistic approach.