
Recommended
Recommended
More Related Content
What's hot
What's hot (19)
Similar to Big Five Factors Restraining World Growth by Kevin Lings
Similar to Big Five Factors Restraining World Growth by Kevin Lings (20)
Recently uploaded
Recently uploaded (20)
Big Five Factors Restraining World Growth by Kevin Lings
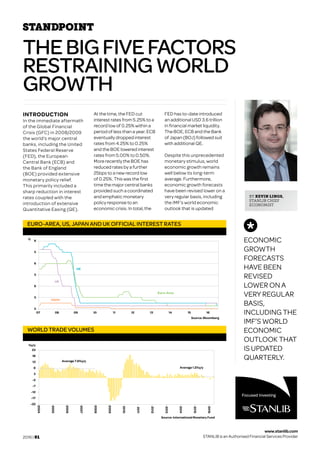
- 1. 2016 | 01 www.stanlib.com STANLIB is an Authorised Financial Services Provider THEBIGFIVEFACTORS RESTRAININGWORLD GROWTH BY KEVIN LINGS, STANLIB CHIEF ECONOMIST INTRODUCTION In the immediate aftermath of the Global Financial Crisis (GFC) in 2008/2009 the world’s major central banks, including the United States Federal Reserve (FED), the European Central Bank (ECB) and the Bank of England (BOE) provided extensive monetary policy relief. This primarily included a sharp reduction in interest rates coupled with the introduction of extensive Quantitative Easing (QE). At the time, the FED cut interest rates from 5.25% to a record low of 0.25% within a period of less than a year. ECB eventually dropped interest rates from 4.25% to 0.25% and the BOE lowered interest rates from 5.00% to 0.50%. More recently the BOE has reduced rates by a further 25bps to a new record low of 0.25%. This was the first time the major central banks provided such a coordinated and emphatic monetary policy response to an economic crisis. In total, the FED has to-date introduced an additional USD 3.6 trillion in financial market liquidity. The BOE, ECB and the Bank of Japan (BOJ) followed suit with additional QE. Despite this unprecedented monetary stimulus, world economic growth remains well below its long-term average. Furthermore, economic growth forecasts have been revised lower on a very regular basis, including the IMF’s world economic outlook that is updated ECONOMIC GROWTH FORECASTS HAVE BEEN REVISED LOWER ON A VERY REGULAR BASIS, INCLUDING THE IMF’S WORLD ECONOMIC OUTLOOK THAT IS UPDATED QUARTERLY. EURO-AREA, US, JAPAN AND UK OFFICIAL INTEREST RATES UK Euro-Area US Japan Source: Bloomberg % 6 5 6 5 6 5 5 07 08 09 10 11 12 13 14 15 16 WORLD TRADE VOLUMES -22 -17 -12 -7 -2 3 8 13 18 23 2004 2005 2006 2007 2008 2009 2010 2011 2012 2013 2014 2015 2016 %y/y Average 7.8%y/y Average 1.2%y/y Source: International Monetary Fund
- 2. 2016 | 02 www.stanlib.com STANLIB is an Authorised Financial Services Provider quarterly. For example, over the period from 1995 to 2005 the US economy achieved an average Gross Domestic Product (GDP) growth rate of around 3.5%, spiking to over 4% on a regular basis. Since 2009, US GDP growth has averaged a mere 1.5% p.a and is forecast to grow at only 1.7% in 2016. A similar argument can be made for economic growth in the United Kingdom as well as the Euro-area. Clearlytheextensive andprolongedmonetary policyresponsefromthe majorcentralbankshas notproducedtherebound ineconomicgrowthmost analystsandcentralbankers anticipated.Thisraisesakey question,“whatisrestraining worldgrowth?”Itisclearlynot thelevelofinterestratesora lackofliquidityinthefinancial system. After extensive research, it is possible to identify at least five major factors restraining world growth. 1. AN INCREASE IN GLOBAL TRADE PROTECTION Many countries, including the United States, United Kingdom and Euro-area have experienced a rise in right- wing politics in recent years and a clamor for increased protectionism. This is partly in response to the perceived ill-effects associated with globalisation, the escalation of the migrant crisis in Europe and the ongoing erosion of manufacturing activity in many developed markets. The result is that the G20 countries, according to the World Trade Organisation (WTO) have more than tripled their number of trade restrictions since the GFC. This, unsurprisingly, has contributed enormously to a slowdown in the rate of growth of world trade. In fact the volume of world trade has slowed from a growth rate of almost 8% in the years prior to the GFC to a mere 1.5% in 2016. This would be the slowest pace of growth in global trade since the financial crisis of 2009. Historically strong trade growth has been a sign of strong economic growth, as trade has provided a way for developing and emerging economies to grow quickly and strong import growth has been associated with faster growth in developed countries. While the benefits of trade are clear, it is also clear that the benefits have to be shared more widely. The slowdown in world trade is very closely related to the overall slowdown in world economic growth. Consequently, the increase in trade protectionism has contributed to the somewhat sluggish and disappointing global economic environment. 2. A LACK OF FIXED INVESTMENT ACTIVITY In most developed economies the cost of capital is at a historical low. This is partly reflected in corporate bond yields, but it is also reflected in the cost of bank debt. Despite this, the sharp pull- back in fixed investment that occurred during the GFC has largely been sustained in recent years; including infrastructural development by the public sector. For example, over the period from 1990 to 2008 fixed investment activity in the developed world amounted to an average of 23.3% of GDP. Since the GFC, this ratio has dropped to an average of only 20.3%. This three percentage point reduction in fixed investment activity amounts to a staggering USD 1.3 trillion less fixed investment activity at 2016 prices. A similar trend has occurred in the Euro- area. Without a relatively strong rise in fixed investment spending, including infrastructural development, it is hard for most economies to generate a vibrant and sustained increase in employment that leads to much more vibrant economic growth across a broad range of economic sectors. 3. DEPENDENCY RATIOS IN DEVELOPED MARKETS Globally, life expectancy has been trending higher for a number of decades and was recently recorded at just over 70 years having been as low as 45 years shortly after the Second World War. This is understandable given regular breakthroughs in medicine as well as a general increase in access to modern medicine. Onitsown,theriseinlife expectancywouldnot necessarilybeexpected torestrainglobalgrowth. However,crucially,there hasbeenaremarkable shiftindependencyratios, especiallyinthedeveloped world.Forexample,theyouth dependencyratio(thatisthe numberofdependents,aged zeroto14asapercentage ofthetotalpopulationaged 15to64)hasfallensharply fromaround48%in1960 toaround26%in2016.This hasoccurred,primarily, becausethebirthratehas fallenin-linewiththegrowthin averagehouseholdincomes. Incontrast,theelderly dependencyratio(thatisthe numberofdependentsover theageof65asapercentage ofthetotalpopulation,aged 15to64),hasrisensharply fromamere14%in1960to 25%in2016. This change in the composition of the total DEVELOPED MARKETS FIXED INVESTMENT AS % OF GDP 17 18 19 20 21 22 23 24 25 26 27 1990 1991 1992 1993 1994 1995 1996 1997 1998 1999 2000 2001 2002 2003 2004 2005 2006 2007 2008 2009 2010 2011 2012 2013 2014 2015 % of GDP Ave 1990 - 2008 Ave 2009 - 2015 Source: International Monetary Fund
- 3. 2016 | 03 www.stanlib.com STANLIB is an Authorised Financial Services Provider dependency ratio in the developed world is having a profound impact on global growth. This includes the lack of young entrants to the labour market coupled with the need to divert an increasing amount of resources into supporting the elderly population. The net result is a change in the composition of economic growth (for example more spending on healthcare) as well as an overall restraint on growth given that older people use credit much more sparingly compared with newly employed younger people. 4. THEREBALANCING OF THE CHINESE ECONOMY Chinaisintheprocessof rebalancingitseconomy. ThisimpliesthatChinais endeavouringtoshiftthe composition of itseconomy awayfromfixedinvestment activityandtowardsa greaterroleforhousehold consumption, including theconsumptionofboth goodsandservices.This fundamental shiftin structure oftheChineseeconomyis alreadywelladvancedand isexpectedtocontinuefor many years. WhilethegrowthinChinese householdconsumption willbewidelyapplauded internationally,theslowdown intherateofgrowthin fixedinvestmentactivityis havinga profoundimpacton manyemergingeconomies, especiallycommodity producers.Thisisbecause theslowdowninfixed investmentactivity (coupled witha relativelyrapidrisein thecostofmanufacturing productioninChina)hasled toamoderationintherateof growthofindustrialactivity andasharpfall-offinimport demand–especiallythe importationofcommodities. Thenetresulthasbeen lowercommodityprices, whichhasunderminedthe economicperformanceof manyemergingeconomies, includingSouthAfrica. Theprocessofrebalancing theChineseeconomyisvital foritssustainedeconomic success. IfChinaisable tosuccessfullytransition fromaninvestmentbased economyintoaneconomy thathasahealthymixofboth consumptionandinvestment itwilleasilybecomethe largesteconomyintheword. However,givenhowimportant China’seconomicgrowth hasbeentocommodity DEVELOPED MARKETS AGE DEPENDENCY RATIO (Ratio of Working age Population to Non-Working age Population) Source: US Census Bureau Age 65+ as % of working age (rhs) Age less than 16 as % of working age (lhs) 10 12 14 16 18 20 22 24 26 20 24 28 32 36 40 44 48 52 1960 1965 1970 1975 1980 1985 1990 1995 2000 2005 2010 2015 CHINA IMPORTS -40 -30 -20 -10 0 10 20 30 40 50 60 70 2007 2008 2009 2010 2011 2012 2013 2014 2015 2016 % y/y, 3-month moving average, USD Source: National Bureau of Statistics of China THERE HAS BEEN A REMARKABLE SHIFT IN DEPENDENCY RATIOS, ESPECIALLY IN THE DEVELOPED WORLD. FOR EXAMPLE, THE YOUTH DEPENDENCY RATIO HAS FALLEN SHARPLY FROM AROUND 48% IN 1960 TO AROUND 26% IN 2016. IN CONTRAST, THE ELDERLY DEPENDENCY RATIO HAS RISEN SHARPLY FROM A MERE 14% IN 1960 TO 25% IN 2016.
- 4. 2016 | 04 www.stanlib.com STANLIB is an Authorised Financial Services Provider China’s economic rebalancing is undermining world economic growth in the short-term, especially emerging economies. of respondents think that there is a 86% Source: World Economic Forum in the world today leadership crisis producersinrecentyears, China’seconomicrebalancing isunderminingworld economicgrowthintheshort- term,especiallyemerging economies. 5. A GLOBAL LACK OF CONFIDENCE The level of economic sentiment, measured on a global basis, is noticeably lower now compared with the level of confidence that prevailed prior to the GFC. For example the Sentix index, which measures confidence levels in the major economies, averaged an index level of 25 prior to the GFC. Since the GFC, the indicator has averaged around eight index points. There are a wide range of factors that help to explain the lower average level of economic sentiment. This includes a crisis of leadership, especially political leadership. In fact, according to the World Economic Forum’s Global Leadership Index for 2015, 86% of respondents think there is a leadership crisis in the world. There are also numerous research reports highlighting the growing wealth divide in the world, as well as rising levels of corruption. Transparency International highlighted in their 2015 report on corruption that more than six billion live in a country that is considered highly corrupt. The combination of increased corruption, a growing wealth divide and a lack of effective leadership has clearly combined to undermine economic sentiment on a global scale. Lower levels of confidence are typically associated with an increased reluctance to undertake large purchases (for example the purchase of a house), but also a reluctance by the business sector to invest in additional machinery and equipment. CONCLUSION Eight years after the GFC, it is evident that although central banks were very effective in responding to the financial crisis, the key factors holding back the world economy today are largely unrelated to the level of interest rates or the amount of QE on offer. Instead, there needs to be a renewed focus on other critical policy measures such as trade, competition, labour, industrial and fiscal policy. This includes the development of vital economic infrastructure. Under current circumstances, all of these policy areas have the potential to lift world growth much more effectively than further monetary stimulus. GLOBAL ECONOMIC SENTIMENT (SENTIX INDEX) Sentix global confidence index -50 -40 -30 -20 -10 0 10 20 30 40 50 2004 2005 2006 2007 2008 2009 2010 2011 2012 2013 2014 2015 2016 Confidence prior to financial crisis Confidence post financial crisis Source:Sentix