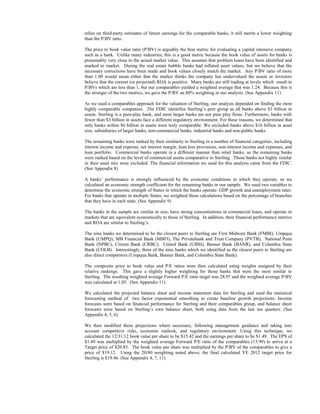
SlideShare a Scribd company logo
1 of 18
Download to read offline
Banking

Gonzaga University Student Research
This report is published for educational purposes
only by students competing in the CFA Institute
Research Challenge.

Sterling Financial Corporation

Ticker: ●STSA
Price: ●$18.49

Date 01/26/2012

Recommendation: ●Hold
Price Target: ●$19.46

Split-Adjusted
Earnings/Share
Mar.

Jun.

Sept.

Dec.

Year

P/E
Ratio

P/B
Ratio

2009A

($0.40)

($0.55)

($7.48)

($5.37)

($13.80)

NA

1.51x

2010A

-1.43

-0.94

0.54

-10.37

-12.2

NA

1.53x

2011A

0.09

0.12

0.18

0.24

0.63

26.51x

1.18x

2012E

0.26

0.46

0.35

0.42

1.49

13.06x

1.26x

Highlights


Price Target: Our analysis indicates a one year price target of $19.46, which is a 5.25% increase
over the current price of $18.49.



Market Comparison: Sterling has performed better than the SPDR S&P Regional Banking index
(KRE) over the past 6 months with a 9.19% return compared to 5.35% for the index. Sterling’s
volatility (beta 2.21) is higher than the index, however, which has a beta of 1.02.

11.61-19.71 
107,553
2.21
NA
62,057,645
1.15B

Growth Strategies: A primary organic growth strategy for Sterling is to increase loan originations.
The company originated $926 million in portfolio loans in 2011, which represents a 195% increase
over the previous year. We estimate that this trend will continue (although at a slower rate)
throughout 2012 due to improving loan demand and low interest rates. In addition to the growth of
the loan portfolio, the bank is actively pursuing a strategy of growth by acquisition. In the first
quarter of 2012, they should complete a Purchase and Assumption agreement with First
Independent Bank in Vancouver WA. Along with market penetration and asset growth benefits,
this transaction will allow Sterling to begin offering trust and wealth management services to its
existing clients.

Market Profile
52 Week Price Range
Average Daily Volume
Beta
Dividend Yield (estimated)
Common Shares Outstanding
Market Capitalization
Institutional Holdings (shares)
Insider Holdings (shares)

45.42M
6.49M

Earnings per share
Book Value per Share
Tier 1 Capital

0.63
14.16
11.40%



Improving Trends: Net interest margin has improved since the recapitalization in August 2010,
where Sterling was at 3.03%, to 3.29% as of December 31, 2011. The loan loss allowances have
also decreased steadily from $335M in December, 2009 to $177M in September of 2011, giving
them an average quarterly decrease of $21M over those seven quarters. Other Real Estate Owned
(OREO) has also fallen from its peak of $161M at the end of 2010 to $81.9M by the end of 2011.



Valuation Risks: Continued economic uncertainty and a generally cautious market may have a
negative impact on the volatility and price of Sterling in the coming year. Slow growth in the
economy could also keep interest rates low, which would put continued pressure on Sterling’s
interest rate margins. This could slow down loan growth rates putting pressure on earnings. This
earnings pressure, however, would be partially offset by improved interest income from the existing
commercial loan portfolio.



Conclusion: Sterling is a fundamentally sound company that should perform well in its business
operations. At current market prices, Sterling is a hold, but they could become a buy in the event of
market correction.

1
Indexed Returns

$115
$112
$109
$106
$103
$100
$97
$94
$91
$88
$85
$82
$79
$76
$73
$70

STSA
KRE*

*SPDR S&P Regional Banking ETF (KRE) Source:Yahoo Finance

Business Description
Sterling Financial Corporation is the bank holding company for Sterling Savings Bank, which began in 1983
in Spokane, Washington. Sterling Savings bank also operates a subsidiary commercial bank, Intervest
Mortgage Investment Co., founded in 1987, which focuses on institutional lending. Sterling expanded
rapidly, largely through aggressive acquisitions, and now has over $9.1 billion in assets, with 178 branches in
five states including Washington, Oregon, Montana, Idaho and California.
As a regional commercial bank Sterling offers a typical array of financial products including consumer loans,
real estate mortgages, retirement and wealth management services, commercial loans, and a full range of
deposit products. While they offer a broad product mix, they have a strong focus on business relationships.
Moving forward, the bank seeks to strengthen this focus.
During the height of the market, Sterling was heavily involved in construction lending, especially speculative
development projects, with as much as 33% of their total loan portfolio concentrated in this one segment.
When the real estate market collapsed, many of these loans defaulted. Many banks, including Sterling, are
still liquidating OREO properties, much of which was land and speculative housing developments. OREO
increased dramatically as management took foreclosure actions on non performing assets, and since their
peak at the end of 2010, Sterling has been liquidating these problem loans systematically. As a necessary
reaction to the current market conditions, only 4% of their loan portfolio is now concentrated in construction
and development (C&D). This has helped to improve their portfolio quality, since C&D loans typically carry
the highest level of default risk. Analysis of their current portfolio concentration indicates that they are much
more reasonably diversified, so OREO should continue to decline.
Sterling’s subsidiary, Intervest, is a small portion of the overall company, but because this company
specializes in brokering loans to the secondary market (primarily insurance companies), they are able to offer
terms to borrowers that most community banks or credit unions cannot offer. This allows Sterling to capture
borrowers that would be forced to work with larger national banks that also offer institutional lending
solutions. The loans that are sold to insurance companies are typically of high quality, but the terms would
not be favorable to Sterling because they often have longer fixed-rate terms associated with them. By
brokering these loans, Sterling is able to earn fee income while reserving capital for higher yielding loan
products.
Management has targeted their portfolio concentrations at 1/3 in consumer loans (including mortgages), 1/3
in commercial loans and 1/3 in non-owner occupied commercial real estate. With much of their loan
portfolio in commercial loans, they are at the high end of the spectrum compared to their peer group. This is
not necessarily a concern, but it does indicate the strategic approach that they are taking. This strategy has a
unique set of benefits and risks, which we discuss throughout this analysis.
Community Involvement
One of Sterling’s strengths is their Community Involvement, which has been a focus for Sterling since its
inception. They show commitment to customer relationships and their communities through multiple
channels, as they hope to make a positive impact on the communities in which they operate. In 2010,
Sterling employees donated more than 25,000 hours to over 400 organizations, demonstrating their dedication
to the mission of being a community-focused entity. This community investment is not only good for
society, but it creates name recognition and a positive image of the bank.
Recapitalization
Due to its heavy loan losses from 2008-2010, Sterling’s capitalization plunged until they came under heavy
regulatory pressure that culminated in a Cease and Desist order in 2010. The Cease and Desist order required
Sterling to improve its Tier 1 capital to 10% or better, reduce its level of classified and non-performing loans,
and to restructure the management team. Sterling restructured in August 2010, receiving a net capital
infusion of $730 million from two private equity funds and 30 other individual investors. Both of the private
equity firms are registered as bank holding companies, with significant banking experience. Each received
one non-voting board seat. Subsequent to the restructuring, Sterling’s capitalization exceeded their 10% Tier
1 capital requirements. As part of this recapitalization, the cease and desist order was lifted.
A large part of Sterling’s strategy has been to reduce its levels of non-performing assets by selling or
otherwise divesting themselves of distressed properties. They have been able to reduce OREO properties by
$68.9 million year over year, which is a 46% decrease. Loan loss allowance has fallen by $69.6 million over
the past year, which is a 28% decrease.

Millions

Loan Loss Allowance
400
350
300
250
200
150
100
50
0

Management
Much of the success of the recapitalization of Sterling can be attributed to the current management of Sterling
Financial Corporation and Sterling Savings Bank. Despite a challenging environment for the banking
industry, managers were able to orchestrate the investment of two large private equity firms, who provided
the large capital investment necessary for recapitalization. This success, along with consistent improvement
of the financial performance of the institution, indicates the strong capabilities of management. Brad
Williamson, director of the state DFI Banking Division, who headed the team that was in charge of closing
banks in Washington, stated succinctly that, “Sterling survived because management did a good job getting a
handle on its problems.”
J. Gregory Seibly serves as the President and CEO of Sterling Financial Corporation, and has been a major
part of the restructuring of Sterling. Mr. Seibly also sits on the Board of Directors, which boasts impressive
resumes within the banking industry, as well as in other business endeavors. Included in the Board are former
management from Wells Fargo & Company, Bank of America, U.S. Bank, Citicorp, and JPMorgan Chase, as
well as presidents of Ivar’s Inc., Norwest Corporation, and Starbucks Coffee. This extensive understanding
of business and banking allows Sterling to view their current situation from knowledgable positions and
diverse prior experiences. Executive experience is critical to determining the direction of the organization, so
it is important that Sterling’s leadership comes from diverse financial backgrounds. The presence of these
diverse backgrounds and experiences suggests that they will have the knowledge necessary to grow Sterling
into the future.
One notable management change in 2011 was that Sterling’s former CFO was replaced with Patrick J.
Rusnak. Before moving to Sterling, Mr. Rusnak was the CEO of AmericanWest Bank. He was promoted
from CFO to CEO and tasked with the responsibility of recapitalizing to avoid bankruptcy. He was successful
in recapitalizing the bank by negotiating investments from private equity investors. This experience in
working through the turnaround of a troubled bank and the facilitation of a recapitalization exhibits valuable
skills which will help Mr. Rusnak to facilitate Sterling’s full recovery.
The private equity (PE) firms that injected capital into Sterling were Warburg Pincus and Thomas H. Lee
Partners. According to Private Equity International, an industry trade publication, Warburg Pincus is the 13th
largest private equity firm in the world and Thomas H. Lee Partners is the 27th largest (based on total
fundraising over the preceding 5 years). Although banking regulations restrict the PE firms from exercising
direct control over the management of banks, the management expertise and network of industry contacts
they provide is a tremendous asset for a relatively small bank such as Sterling. Sterling also benefits from the
expertise of Scott L. Jaeckel, the managing director of Thomas H Lee Partners, and David A. Coulter, the
managing director and senior advisor at Warburg Pincus, who joined the Board of Directors in 2010. As a
result of the bargaining power of these large investors, Sterling may be able to engage in service contracts
with vendors on more favorable terms. The PE firms provide a wealth of knowledge that will be useful in
benchmarking and determining best practices. Prior to the financial crisis, Sterling outgrew the expertise of
their management, which led to many of the subsequent problems. Overall, our analysis of the new
management at Sterling indicates that they are well equipped to direct the company towards greater
profitability, in the future.
Growth Strategy
Sterling has strived to increase loan originations year over year. The company originated $926M million in
portfolio loans in 2011, which represents a 195% increase over the previous year. We estimate that this trend
will continue throughout 2012 due to improved loan demand and low interest rates. Downward pressure on
interest rates is a concern, however, due to the increase in demand and increase in competition as many banks
more aggressively pursue loan growth. This trend is evidenced by the decrease in loan yields of 0.13% since
3rd qtr of 2011.

Loan Portfolio
Concentrations
Sterling

13%

4%

18%
7%
7%

25%
13%

10%

2%
Residential real estate

Investor CRE

Multifamily

Construction

Total commercial real estate

Owner occupied CRE

C&I

Total commercial

Sterling has recently been increasing their percentage of assets concentrated in multi-family housing loans.
This is beneficial as this is one of the strongest sectors in the commercial real estate spectrum. Management
has an internal target for this sector of 22% of total loans. The average loan to value (LTV) of these loans is
66% and the debt service coverage ratio (DSCR) (net operating income divided by debt payments) is 1.30:1.
Both of these ratios are better than the standard underwriting qualifications of 75% LTV and 1.20:1 DSCR at
most competing commercial banks. This should help them to avoid significant defaults.

Consumer

Loan Portfolio
Concentration
First Independent
47%

6%

6%
13%
16%

12%

Consumer and Other

C&I

CRE

Multi-Family

1-4 Family

C&D

At projected growth rates for multi-family loans, the company will need to start selling these notes in order to
maintain their target loan portfolio composition. This could be done effectively through their subsidiary,
Intervest. They could also attempt to grow their other loan segments at a similar rate.
In addition to loan portfolio growth, the bank is actively pursuing a strategy of growth by acquisition. In the
first quarter of 2012, they should complete a Purchase and Assumption agreement with First Independent
Bank in Vancouver, WA. Along with market penetration and asset growth benefits, this transaction will
allow Sterling to begin offering trust and wealth management services to its existing clients. With Tier 1
capital exceeding 11%, Sterling is well-positioned for further acquisitions.
First Independent Purchase and Assumption
As previously noted, Sterling has historically grown their business primarily through acquisitions. Now that
they have returned to profitability, they appear to be returning to that model. Sterling is in the process of
finalizing a P&A Agreement with First Independent Bank. The P&A structure was chosen over an acquisition
in order to allow Sterling to exclude approximately $79 million worth of undesirable assets. The transaction
will add approximately $691 million in deposits, $450 million of trust and wealth management assets, and 16
additional branch and office locations.
First Independent operated with a similar focus on community banking, so this acquisition should allow
Sterling to expand their reach in the Vancouver/Portland market, while maintaining their community focus
and feel. One of the most beneficial aspects of this transaction is that it will allow Sterling to add wealth
management and trust services to its product offerings throughout the company. Our analysis indicates that
there will not be significant overlap of the geographical footprint of the combined entities. Sterling’s
management has stated that they expect modest operational efficiencies from the P&A as a result of the
consolidation of back office personnel.
Deposit Mix
First Independent
26%
16%

35%
13%

7%

3%
CDs
IRA
Savings
Money Market
Non-interest Checking

The acquired assets and deposits have a product mix favorable to Sterling, and merited a $25 million
premium, of which $17 million is contingent upon the quality of the loan portfolio and retention of at least
90% of pre P&A deposit levels. The conditions of the closing are reasonable and the banks are working
closely with regulators throughout the process, so the transaction is likely to be completed in the first quarter
of 2012.
Customer Retention
The McKinsey Banking Report suggests that banks will need to transition to a Customer Relationship focus
in order to succeed in today’s economy. Sterling paid above industry average for time deposits in an effort to
attract customers and maintain adequate liquidity prior to the restructuring. This resulted in interest expense
being well above industry average. Sterling seeks to retain their core customers, but allow “floating”
customers (those that change banks often in search of the best rates) to drift away. To retain their core
customers, Sterling is focusing on customer service and relationship banking, positioning itself to become the
premier one-stop commercial bank in their region. This builds customer loyalty, while also shifting their
deposit mix more toward business checking accounts and demand deposits, instead of savings accounts and
CD’s.

Industry Overview and Competitive Positioning
Financial markets have remained volatile as investors are still trying to determine the impact of the housing
crisis going into the future, as well as determine the impact of the European debt crisis on the economy.
Although loan demand is currently rising, there is still the threat that lagging loan demand due to poor
economic conditions and uncertain economic outlook could slow the financial sector recovery. Although it
does not directly impact regional banks, the spillover effects of the European debt crisis could adversely
impact the market for financial stocks as a whole.
In today’s banking environment, where interest rate risk is a significant concern, commercial lending
typically offers the benefit of variable loan rates, which can reduce this risk. In general, banks prefer to have
variable loan products in a rising rate environment. Following the recent Federal Reserve pronouncements,
we believe that interest rates will remain fairly flat through 2013. Loan demand has increased over the past
two quarters, especially for business loans. This trend is helpful for commercial banks such as Sterling.
Despite concerns about commercial real estate following the pattern of extremely high foreclosures, as seen
in the housing sector, commercial real estate foreclosures have not been as high as projected. In the Pacific
Northwest (Sterling’s primary market), the foreclosure rate and rate of distressed properties has been
manageable.
Regulatory Risk
On October 1, 2011 the Durbin Amendment of the Dodd-Frank Act took affect. This regulation significantly
reduces the fee income generated by the use of debit cards for institutions with more than $10 billion in
assets. It is anticipated that Sterling will not reach the $10 billion threshold in 2012, but likely would in
2013. At that point, the projected revenue losses per year will be approximately $7 million. These
transaction fee changes do not affect credit card fees. Sterling has very low levels of credit card assets as a
percentage of total loans, and could increase their marketing of credit cards in order to offset this loss of
income.
The Troubled Asset Relief Program (TARP) was signed into law in October 2008, as an attempt by the U.S.
Government to increase liquidity and capitalization by purchasing assets and equity from financial
institutions, thereby strengthening the financial sector as a whole. Sterling received funds from TARP in
December of 2008. As a concession to Sterling, the preferred stock shares issued to the government were
converted to common stock during their recapitalization, so they have no further special obligations as a
consequence of TARP. The government’s consequential minority ownership of Sterling has no impact on its
valuation.
The Federal Reserve’s recent endorsement of higher capital requirements could limit the profitability
potential of large institutional banks. Although these changes could impact smaller banks, it could function as
an opportunity for Sterling, as these regulations are likely to affect larger banks more heavily. Further,
Sterling’s Tier 1 capital is already 11.4%, and they are maintaining an 11% target rate. Any regulatory
change in this area could benefit Sterling, as Sterling would likely exceed the new standard, and it would put
further pressure on Sterling’s competitors.
Competitor Analysis
Banking has become a commoditized industry. In order to compete effectively, some banks try to specialize
in key areas and some use a diversification strategy (all things to all people). The competitive landscape for
Sterling includes a wide range of financial institutions. Large banks such as BofA, Chase and Wells Fargo,
and small community banks all compete with Sterling for customers. (See Marketshare tables in Appendix 3)
Within Washington, Oregon, Idaho, Montana and California, Sterling has the ability to serve the specific
needs of the customer, but their lack of presence outside those states makes Sterling less appealing to
depositors who need access to their funds across the country or internationally. For example, Sterling cannot
compete with larger banks such as JPMorgan Chase or Bank of America in their geographical reach, because
those banks each offer over 5,000 branch offices nationwide where Sterling is currently limited to 193
branches and only the Northwest region.
Credit unions, which have been growing rapidly, were given an additional surge of membership and exposure
as a result of Occupy Wall Street and National Bank Transfer Day initiatives which urged bank customers to
move to these non-profit financial institutions. Regulations for credit unions have become less stringent over
time, allowing them to have less restrictive membership requirements and to offer additional business
products. They are increasingly becoming a threat to banks as they expand into commercial lending.

Deposit Mix-Sterling

32%

19%

41%

8%

Interest-bearing transaction

Noninterest-bearing transaction
Savings and MMDA

Time deposits

Net Interest Margin
The shape of the treasury yield curve has flattened significantly over the past 6 months. Flattening of the
curve is caused by a number of factors, including the Fed’s quantitative easing, but usually is indicative of
bond investors’ lack of confidence in the market. Net interest margin has been impacted by this shrinking
margin between short and long term interest rates. As long term interest rates decline, competition forces
banks to lower the rates that they charge for loans. Savings rates are not able to fall at the same rate, so their
margins shrink. This is a significant risk for Sterling as they have a higher than average cost of capital.
In addition to the capital that Sterling raised through private equity firms, they needed to quickly raise capital
by attracting traditional deposits. To accomplish this, they were required to offer significantly higher rates
than market for deposits (primarily time deposits). This strategy was successful, but it reduced the net
interest margin of the bank. With maturities between 1 and 5 years, these CDs are starting to mature and this
should help reduce the average cost of capital. As of December 31st, 2011, the average cost of these deposits
was 0.80%, which matched the peer average. This cost of funds for Sterling is down from 0.86% in the third
quarter of 2011. The P&A will also help to reduce the cost of deposits because First Independent has an
average cost of interest bearing deposits significantly below the market, at 0.41%.
As with most financial institutions, a vast majority of Sterling’s fixed mortgages are immediately sold to
Fannie Mae or Freddie Mac after origination. This asset management strategy reduces Sterling’s exposure to
interest rate risk in the current interest rate environment since real estate loans have long term rates that are
still historically low.
Regulation Q, originally part of the Glass-Steagall Act of 1933, was recently repealed by the Dodd-Frank
Act. As a result of the repeal of Reg Q, banks are no longer prohibited from paying interest on demand
deposits (checking accounts). The impact of this change will likely be minimal in this low rate environment,
but once interest rates start to climb, this will be another competitive tool that banks will use to attract
deposits, and could negatively impact net interest margins.
Duration Gap Analysis
One tool commonly used to calculate interest rate risk is an analysis of the Duration Gap between assets and
liabilities. Sterling manangment has calculated their duration of assets at 1.65 years and duration of liabilities
at 2.42 years. This yields a duration gap of -1.088 years. Because of a negative duration gap, Sterling’s
financial performance will actually improve as interest rates rise (all else being equal). It should be noted that
in calculating durations of assets and liabilities, managers must make certain assumptions when determining
the cash flow streams. If these assumptions are incorrect, then the validity of the duration gap analysis will
also be incorrect. Based on Sterling’s duration numbers, the change in net worth as a percentage of assets
would increase 50% if interest rates increase by 3%. This indicates that Sterling could significantly benefit
from an environment of rising interest rates.

Investment Summary
Our analysis indicates a one year price target of $19.46, which is a 5% increase over the current price.
Sterling has performed better than the SPDR S&P Regional Banking index over the past 6 months with a
9.19% return vs. 5.35% for the index. Sterling’s volatility (beta of 2.21) is higher than the index, which has a
beta of 1.02.
Currently, Sterling does not pay dividends. Competitors such as Umpqua Holdings Corporation (UMPQ) and
Glacier Bancorp, Inc. (GBCI) have paid regular dividends to investors, making them appear stronger to
investors who have a focus on dividend returns. Sterling stopped paying dividends during the financial crisis
(after the third quarter of 2008). Very recently, one of the obstacles to paying dividends, the Memorandum of
Understanding (MOU), was recinded. According to Sterling management, the Department of Financial
Institutions (DFI) is reviewing Sterling’s financial condition relating to the final restrictions on dividend
payments. This would indicate that Sterling may be able to start paying dividends once it has paid all of the
accrued interest on its subordinated debt. Management has indicated that they do not currently have plans to
issue dividends.
Positive EPS Surprises:
Sterling has a good track record of positive EPS surprises over the past four quarters, indicating that they
have been successful in managing the firm. This recent track record of positive surprise also suggests that
Sterling has been effective at managing market expectations by being very transparent in their actions. The
positive track record continues in performance against the Financial sector as a whole, in which Sterling has
outperformed by 3.7% in the last month and 18.9% over six months.
The market has reacted well to Sterling’s performance outlook and the news of the P&A agreement with First
Independent. The share price has risen over 18.5% since the purchase announcement. This also may be an
indicator that the market supports management’s decision to seek out these types of acquisitions.

Figure 1: Sterling Stock Price and News Last 12 Months
Source: Schwab

Valuation
We derived the price target of Sterling using a weighted average of the Forward P/E ratio (20% weight) and
the P/BV ratio (80%). Historically, the PE ratio has been a commonly used ratio for determining the current
valuation of a company’s stock. One problem with this ratio in a poor economic climate is that when there
are very low or negative earnings, then this valuation tool becomes less effective. As banks have started to
recover from the recession, this ratio is again a relevant instrument for assessing the value of a company. The
Forward PE ratio looks further into the recovery, creating more realistic valuation expectations. Because it
relies on third-party estimates of future earnings for the comparable banks, it still merits a lower weighting
than the P/BV ratio.
The price to book value ratio (P/BV) is arguably the best metric for evaluating a capital intensive company
such as a bank. Unlike many industries, this is a good metric because the book value of assets for banks is
presumably very close to the actual market value. This assumes that problem loans have been identified and
marked to market. During the real estate bubble banks had inflated asset values, but we believe that the
necessary corrections have been made and book values closely match the market. Any P/BV ratio of more
than 1.00 would mean either that the market thinks the company has undervalued the assets or investors
believe that the current (or projected) ROA is positive. Many banks are still trading at levels which result in
P/BVs which are less than 1, but our comparables yielded a weighted average that was 1.24. Because this is
the stronger of the two metrics, we gave the P/BV an 80% weighting in our analysis. (See Appendix 11)
As we used a comparables approach for the valuation of Sterling, our analysis depended on finding the most
highly comparable companies. The FDIC identifies Sterling’s peer group as all banks above $3 billion in
assets. Sterling is a pure-play bank, and most larger banks are not pure play firms. Furthermore, banks with
fewer than $3 billion in assets face a different regulatory environment. For these reasons, we determined that
only banks within $6 billion in assets were truly comparable. We excluded banks above $16 billion in asset
size, subsidiaries of larger banks, non-commercial banks, industrial banks and non-public banks.
The remaining banks were ranked by their similarity to Sterling in a number of financial categories, including
interest income and expense, net interest margin, loan loss provisions, non-interest income and expenses, and
loan portfolio. Commercial banks operate in a different manner than retail banks, so the remaining banks
were ranked based on the level of commercial assets comparative to Sterling. Those banks not highly similar
in their asset mix were excluded. The financial information we used for this analysis came from the FDIC.
(See Appendix 8)
A banks’ performance is strongly influenced by the economic conditions in which they operate, so we
calculated an economic strength coefficient for the remaining banks in our sample. We used two variables to
determine the economic strength of States in which the banks operate: GDP growth and unemployment rates.
For banks that operate in multiple States, we weighted these calculations based on the percentage of branches
that they have in each state. (See Appendix 9)
The banks in the sample are similar in size, have strong concentrations in commercial loans, and operate in
markets that are equivalent economically to those of Sterling. In addition, their financial performance metrics
and ROA are similar to Sterling’s.
The nine banks we determined to be the closest peers to Sterling are First Midwest Bank (FMBI), Umpqua
Bank (UMPQ), MB Financial Bank (MBFI), The Privatebank and Trust Company (PVTB), National Penn
Bank (NPBC), Citizen Bank (CRBC), United Bank (UBSI), Banner Bank (BANR), and Columbia State
Bank (COLB). Interestingly, three of the nine banks which we identified as the closest peers to Sterling are
also direct competitors (Umpqua Bank, Banner Bank, and Columbia State Bank).
The composite price to book value and P/E ratios were then calculated using weights assigned by their
relative rankings. This gave a slightly higher weighting for those banks that were the most similar to
Sterling. The resulting weighted average Forward P/E ratio target was 28.97 and the weighted average P/BV
was calculated at 1.05. (See Appendix 11)
We calculated the projected balance sheet and income statement data for Sterling and used the statistical
forecasting method of two factor exponential smoothing to create baseline growth projections. Income
forecasts were based on financial performance for Sterling and their comparables group, and balance sheet
forecasts were based on Sterling’s own balance sheet, both using data from the last ten quarters. (See
Appendix 4, 5, 6)
We then modified these projections where necessary, following management guidance and taking into
account competitive risks, economic outlook, and regulatory environment. Using this technique, we
calculated the 12/31/12 book value per share to be $15.42 and the earnings per share to be $1.49. The EPS of
$1.49 was multiplied by the weighted average Forward P/E ratio of the comparables (13.99) to arrive at a
Target price of $20.85. The book value per share was multiplied by the P/BV of the comparables to give a
price of $19.12. Using the 20/80 weighting noted above, the final calculated YE 2012 target price for
Sterling is $19.46. (See Appendix 4, 7, 11)
Financial Analysis
Sensitivity Analysis
EPS
3
2.25
1.49
0.99
0

BVPS
18.42
16.18
15.42
14.92
13.93

Price
26.67
22.35
19.47
17.57
17.27

Sensitivity analysis
To determine the sensitivity of the market price to variability in earnings per share, we determined a range of
possible earnings per share estimates. These estimates range from no earnings to $3 per share for 2012. For
each earnings estimate, we calculated book value and used our target forward PE ratio and price to book
value ratio to determine a target price. For our low estimate of no earnings, forward PE ratio would be not
applicable, so the price target has a 100% weighting on the price to book value ratio. This sensitivity analysis
provided a range of possible stock prices, from a no earnings $17.27 per share target to a high earnings
$26.67 price target.
Capital Structure
Sterling benefits from a capital structure with little or no debt, making it less financially risky when compared
to the industry aggregate. Competitors such as Glacier Bancorp, Inc. (GBCI) operate with greater long-term
liabilities and therefore greater financial risk. Sterling does, however, have over $1 billion in junior
subordinated notes (forward repurchase agreements) for which they pay an average interest rate of 3.9%.
These interest payments have been accruing, and are required to be paid current before dividends can be paid.
The high interest rate on these notes has an adverse impact on the net interest margin of the bank. (See
Appendix 5)
Earnings
We took Sterling’s performance ratios and forecasted earnings based on projected changes. Interest income is
expected to decline somewhat over the next year, but this is partially offset by a decrease in interest expense.
Net interest margin improves to 3.38%, which is only a partial improvement over the 3.30% at close of 2011.
Management’s target for net interest margin is 4.00, but we do not expect Sterling to reach this target until the
Federal Reserve relaxes interest rate controls. (See Appendix 6, 7)
Balance Sheet
An understanding of the trends in asset growth is critical to an understanding of the financial performance of
the company. Our analysis of Sterling’s asset growth assumes that loan portfolio would decrease somewhat
in the first quarter and then begin gradual growth as Sterling manages the portfolio to remain below the $10
billion asset level. This has a net positive effect on Sterling’s net income for 2012. We expect the securities
portfolio to be managed in a similar fashion, with tapered growth and then some decline in the fourth quarter,
to keep Sterling from exceeding the $10 billion asset level. (See Appendix 5)
Sterling maintains a direct purchase plan for individuals to buy newly issued shares directly through their
transfer agent, American Stock Transfer & Transfer Services, LLC. Increase in common shares outstanding
through this program is very small, and we projected very modest increases throughout the year.

Investment Risks
Insufficient Capital Levels
If Sterling’s current capital levels are found to be insufficient because of changing regulations, they may need
to raise additional capital that may be subject to additional regulatory restrictions. For example, if the
economic conditions worsen leading to additional provision for loan losses then it could force Sterling to seek
additional capital.
Issuing New Securities
Sterling may decide to raise capital through public or private debt or equity finacing, so if the decision is
made to raise funds through the issuance of securities that could dilute ownership interests of existing
shareholders.
Acquisition Risks
Acquisitions make up a large part of Sterling’s growth strategy, leaving them susceptible to the risks
associated with acquisitions. These risks include overpaying for assets as well as improper implimentation or
integration of newly aquired assets. Unfavorable accounting consequences as well as increases in taxes may
cause acquisitions that appeared to be beneficial to ultimately hurt Sterling overall because of unforeseen
factors.
Regulator Restrictions
There remains some uncertainty as to when regulator restrictions will be lifted or additionally imposed.
Under the terms of the Reserve Bank Agreement, Sterling cannot currently pay dividends, and there is no
certainty that the restriction on dividends will be lifted in the near future. The Reserve Bank Agreement also
prevents Sterling from appointing new board members or senior executive officers, which could prevent
Sterling from making personel changes that could benefit the bank.
THL and Warburg Pincus
Because of the significant holdings of these investors they each have a representative on the Board of
Directors. Although these board members are non-voting, they will have influence over corporate
governance. This becomes a risk if the goals of THL and Warburg Pincus become substantially different
Sterling, leading to a conflict of interests on the Board.

Stock Volatility
Sterling’s stock price has been very volatile, which may cause investors to lack confidence in the investment
quality of this stock. This volitility may be a result of factors completely outside of the control of Sterling, as
well as larger trends within the Financial Sector, which includes Sterling. Public perception has a significant
impact on stock price so if the public continues to lack confidence in the banking industry it could negatively
impact the stock price.
Appendix 1 (Source: Sterling 10-Q 2011 3rd Quarter)
Largest Institutional Holders of STSA
Holder

Shares

% Outstanding

Value*

Reported

KING STREET CAPITAL M ANAGEM ENT, L.L.C.

2,973,487

4.8

36,811,769

30-Sep-11

Capital World Investors

2,888,260

4.66

35,756,658

30-Sep-11

Cyrus Capital Partners, L.P.

2,390,405

3.86

29,593,213

30-Sep-11

THORNBURG INVESTM ENT M ANAGEM ENT INC.

2,272,729

3.67

28,136,385

30-Sep-11

Anchorage Capital Group, LLC

2,272,727

3.67

28,136,360

30-Sep-11

LEE PARTNERS (THOM AS H.)

12,948,112

20.89

160,297,626

30-Sep-11

WARBURG PINCUS LLC

12,948,107

20.89

160,297,564

30-Sep-11

1,359,791

2.19

16,834,212

30-Sep-11

WELLINGTON M ANAGEM ENT COM PANY, LLP

907,191

1.46

11,231,024

30-Sep-11

BlackRock Institutional Trust Company, N.A.

603,540

0.97

7,471,825

30-Sep-11

Shares

% Outstanding

Value*

Reported

SM ALLCAP WORLD FUND

1,666,668

2.69

20,633,349

30-Sep-11

AM ERICAN FDS INSURANCE SER-GROWTH FD

VANGUARD GROUP, INC. (THE)

Appendix 2 (Source: Sterling 10-Q 2011 3rd Quarter)
Largest Mutual Fund Holders of STSA
Holder

1,221,592

1.97

15,123,308

30-Sep-11

VANGUARD SM ALL-CAP INDEX FUND

467,860

0.75

5,792,106

30-Sep-11

ISHARES RUSSELL 2000 INDEX FD

391,569

0.63

5,877,450

31-Oct-11

VANGUARD TOTAL STOCK M ARKET INDEX FUND

268,327

0.43

3,321,888

30-Sep-11

VANGUARD SM ALL CAP VALUE INDEX FUND

259,273

0.42

3,209,799

30-Sep-11

VANGUARD EXTENDED M ARKET INDEX FUND

251,775

0.41

3,116,974

30-Sep-11

FBR SM ALL CAP FINANCIAL FUND

244,185

0.39

3,023,010

30-Sep-11

Fidelity Strategic Advisors Small-M id Cap Fund

186,800

0.3

2,624,540

31-Aug-11

ISHARES RUSSELL 2000 VALUE INDEX FD

175,413

0.28

2,632,949

31-Oct-11
Appendix 3 (Source: Sterling Investor Relations presentation)

Appendix 4
Balance Sheet Assumptions
Assets and Liabilities
Total assets
Cash and due from depository institutions
Securities
Net loans & leases
Bank premises and fixed assets
Other real estate owned
Goodwill and other intangibles
All other assets
Total liabilities and capital
Total liabilities
Deposits held in domestic offices
Other borrowed funds
All other liabilities
Common stock

30-Dec-11

30-Mar-12

30-Jun-12

30-Sep-12

30-Dec-12

1.97%
4.14%
-1.54%
-0.43%
-26.58%
-9.12%
7.72%

0.99%
2.39%
-0.70%
-0.43%
-26.58%
0.00%
0.75%

0.49%
0.80%
0.00%
-0.54%
-26.58%
0.00%
0.00%

0.25%
0.00%
0.62%
-0.76%
-26.58%
0.00%
-1.25%

0.12%
-2.39%
0.94%
-0.97%
-26.58%
0.00%
-2.30%

0.10%
-5.27%
13.84%

0.10%
-5.27%
-13.84%

0.10%
-5.27%
-13.84%

0.10%
-5.27%
-13.84%

0.10%
-5.27%
-13.84%

0.02%

0.02%

0.02%

0.02%

0.02%
Appendix 5
Balance Sheet Projections (*Dollar figures in 000's)
Assets and Liabilities
Total assets
Cash and due from depository institutions
Interest-bearing balances
Securities
Federal funds sold & reverse repurchase agreements
Net loans & leases
Trading account assets
Bank premises and fixed assets
Other real estate owned
Goodwill and other intangibles
All other assets

30-Mar-12

30-Jun-12

30-Sep-12

30-Dec-12

9200202
488077
381956
2608770
0
5577565
0
83652
60137
20078
361923

9921707
540899
430271
2836582
0
5978715
0
115082
44537
23151
382742

9942706
539400
435610
2836582
0
6015872
0
114210
32698
25985
377958

9913329
537232
441016
2768788
0
6072121
0
113099
24006
28818
369265

Total liabilities and capital
Total liabilities
Total deposits
Deposits held in domestic offices
% insured
Federal funds purchased & repurchase agreements
Trading liabilities
Other borrowed funds
Subordinated debt
All other liabilities

9168755
8282996
6492403
6492403
0.9008
1055763
0
384253
245290
105288

9164964
8254784
6498994
6498994
0.9008
1055763
0
364021
245290
90716

9118811
8179661
6505592
6505592
0.9008
1005763
0
344855
245290
78161

9018315
8057291
6512197
6512197
0.9008
905763
0
326698
245290
67343

Total equity capital
Total bank equity capital
Perpetual preferred stock
Common stock
Surplus
Undivided profits
Noncontrolling interests in consolidated subsidiaries

885759
893759
0
1964627
61115
-1131983
0

910180
910180
0
1965020
61115
-1115955
0

939150
939150
0
1965413
61115
-1087378
0

961024
961024
0
1965806
61115
-1065897
0

Book Value Per Share
Tier 1 Capital
Shares Outstanding
Average Total Assets

14.26
11.48474823

14.64
15.09
15.42
10.94319971 11.26765992 11.56426801

62119703

62181822

62244004

62306248

9,196,719.7

9,560,954.9

9,932,206.7

9,928,017.7
Appendix 6
Earnings and Profitability Summary Ratios

Q1 2012

Percent of Average Assets:

4.43
1.15
3.28
1.14
3.67
0.33
0.43
0.16
0.58
0.58
0.58
0.58

Interest Income (TE)
- Interest Expense
Net Interest Income (TE)
+ Noninterest Income
- Noninterest Expense
- Provision: Loan & Lease Losses
Pretax Operating Income (TE)
+ Realized Gains/Losses Sec
Pretax Net Operating Income (TE)
Net Operating Income
Net Income Adjusted Sub S
Net Income

Q2 2012
Q3 2012 Q4 2012
Postmerger
4.56
4.53
4.51
1.14
1.13
1.12
3.42
3.40
3.38
1.32
1.38
1.44
3.89
3.86
3.83
0.13
0.12
0.12
0.71
0.79
0.87
0.00
0.00
0.00
0.71
0.79
0.87
0.71
0.79
0.87
0.71
0.79
0.87
0.71
0.79
0.87

Appendix 7
Income Projections

30-Mar-12

30-Jun-12

30-Sep-12

30-Dec-12

*Dollar figures in thousands

(Quarterly)

(Quarterly)

(Quarterly)

(Quarterly)

Total interest income
Total interest expense
Net interest income

101862
24848
77013

Provision for loan and lease losses
Total noninterest income
Total noninterest expense
Pre-tax net operating income
Securities gains (losses)
Applicable income taxes
Income before extraordinary items
Extraordinary gains - net
Net income attributable to bank

2909.839077
26225.39294
84300.47997
16028
0
0
16028
0
16028

135042
112622
111671
29137
28238
24959
105906
84384
86712
100.776549 1168.098043 1109.703384
38121.5478 34269.9941 35644.5951
115551.213 96005.24991 94925.94041
28577
21481
26321
0
0
0
0
0
0
28577
21481
26321
0
0
0
28577
21481
26321

Net income attributable to
noncontrolling interests
Net income attributable to bank and
noncontrolling interests
Cash dividends

0

0

0

0

16028
0

28577
0

21481
0

26321
0

Sale, conversion, retirement of
capital stock, net
Net operating income

16028

28577

21481

26321

0.26

0.46

0.35

0.42

Earnings per share
Appendix 8
Peer Group Analysis
FIRST MIDWEST BANK
UMPQUA BANK
MB FINANCIAL BANK, NA
PRIVATEBANK AND TRUST CO.
NATIONAL PENN BANK
CITIZENS BANK
BANNER BANK
COLUMBIA STATE BANK
UNITED BANKSHARES, INC

Composite Capital
Portfolio
Financials
Commercial
Size
Regional
3.81
4.83
3.54
2.55
4.52 4.29
4.60
3.72
4.33
2.75
2.77
4.93 4.04
4.75
3.70
4.59
2.73
3.03
3.79 4.74
4.62
3.60
4.50
3.04
2.58
4.3 3.80
4.81
3.58
4.81
2.55
3.23
3.43 4.58
3.74
3.52
3.70
2.45
3.14
3.48 4.97
4.44
3.50
4.74
3.44
2.75
4.15 2.17
4.64
3.36
4.91
2.9
2.55
4.26 2.34
4.14
3.48
4.55
3.01
2.99
3.43 3.84
3.91

Peer Group Analysis
FIRST MIDWEST BANK
UMPQUA BANK
MB FINANCIAL BANK, NA
PRIVATEBANK AND TRUST CO.
NATIONAL PENN BANK
CITIZENS BANK
BANNER BANK
COLUMBIA STATE BANK
UNITED BANKSHARES, INC

Weight
11.81%
11.53%
11.46%
11.17%
11.08%
10.90%
10.84%
10.41%
10.78%

P/E
10.23
13.01
12.51
13.64
14.2
9.21
36.04
17.66
15.55

B/V
0.9
1.5
1.1
0.9
1.5
0.8
0.6
1.4
2.5

Ticker
FMBI
UMPQ
MBFI
PVTB
NPBC
CRBC
BANR
COLB
UBSI

Appendix 9
Regional Outlook
Sterling
Banner
Citizens Bank
Columbia
First Midwest
Santa Barbara
Umpqua
Susquehanna
Iberia
MB Financial
National Penn
Private Bank
United Bank

GDP Growth
Unemployment
Ranking
2.06%
9.47%
2.04%
8.78%
4.64
2.76%
9.90%
4.44
2.78%
8.47%
4.14
1.90%
10.10%
4.60
1.80%
11.30%
3.95
2.48%
9.55%
4.75
2.92%
7.81%
3.74
2.23%
8.10%
4.23
1.91%
10.08%
4.62
3.00%
7.89%
3.74
1.94%
9.73%
4.81
3.34%
8.57%
3.91

State
IL
OR
IL
IL
PA
MI
WA
WA
VA

Avg. Assets
Net Income
8,033,595
50,245
11,597,279
58,125
9,884,447
20,483
12,329,198
51,821
8,575,566
71,045
9,429,809
-3,053
4,069,828
2,173
4,385,387
34,361
7,192,199
53,274
Appendix 10
Financial Comparison Ratings

Sterling/FIB

Wght

United

Score Banner Score Columbia

Score

Earnings and Profitability
Percent of Average Assets:

+ Noninterest Income

0.89

- Noninterest Expense

3.61

- Provision: Loan & Lease Losses

0.31

10%
10%
10%
10%
10%
10%

97.29

10%

Interest Income (TE)

4.51

- Interest Expense

1.07

Net Interest Income (TE)

3.44

0.23

0.91
0.62
1.00
0.96
0.64
0.75

4.65
0.73
3.93
0.32
3.23
0.95

0.97
0.69
0.88
0.36
0.90
0.33

5.53
0.36
5.18
1.21
4.70
0.15

0.82
0.34
0.66
0.73
0.77
0.49

90.34

0.93

93.66

0.96

86.14

0.89

79.88

0.96

72.05

0.93

78.16

0.99

4.11
0.66
3.46
0.85
2.32

Margin Analysis:
Avg Earning Assets to Avg Assets
Avg Int-Bearing Funds to Avg
Assets

77.07

Loan & Lease Analysis:
4.74

10%

1.36

0.29

2.51

0.53

6.00

0.79

Liquidity
Net Non Core Fund Dep New
$250M

21.60

5.64

Net Loans & Leases to Assets

61.42

10%
10%

70.03

0.26
0.88

6.27
72.54

0.29
0.85

0.31
58.43

0.01
0.95

10.01

0.91

11.60

0.95

11.21

0.98

-Total

Capitalization
Tier One Leverage Capital

11

2.99
4.55

Comparison Score
Capital Score
Financial Comparison Ratings

Sterling/FIB

Wght

PVTB

Score

2.75
4.74
Umpqua

Score

2.55
4.91
MBFI

Score

Earnings and Profitability
Percent of Average Assets:

+ Noninterest Income

0.89

- Noninterest Expense

3.61

- Provision: Loan & Lease Losses

0.31

10%
10%
10%
10%
10%
10%

97.29

10%

Interest Income (TE)

4.51

- Interest Expense

1.07

Net Interest Income (TE)

3.44

3.93
0.49
3.45
0.54
2.07
1.10

0.87
0.46
1.00
0.61
0.57
0.28

4.42
0.61
3.81
0.41
2.64
0.63

0.98
0.57
0.90
0.46
0.73
0.49

4.02
0.59
3.43
1.54
3.09
1.51

0.89
0.55
1.00
0.58
0.86
0.20

96.33

0.99

88.57

0.91

87.55

0.90

89.00

0.87

82.01

0.94

80.37

0.96

Margin Analysis:
Avg Earning Assets to Avg Assets
Avg Int-Bearing Funds to Avg
Assets

77.07

Loan & Lease Analysis:
-Total
Liquidity
Net Non Core Fund Dep New
$250M

4.74

10%

3.63

0.77

2.28

0.48

8.29

0.57

21.60

10%

13.06

0.60

9.46

0.44

13.05

0.60
Net Loans & Leases to Assets

61.42

10%

72.89

0.84

55.27

0.90

57.29

0.93

9.89

0.90

9.53

0.87

10.09

0.92

Capitalization
Tier One Leverage Capital

11

2.58
4.50

Comparison Score
Capital Score
Financial Comparison Ratings

Sterling/FIB

Wght

Citizens

Score

2.77
4.33
NPBC

Score

3.03
4.59
FMBI

Score

Earnings and Profitability
Percent of Average Assets:

+ Noninterest Income

0.89

- Noninterest Expense

3.61

- Provision: Loan & Lease Losses

0.31

10%
10%
10%
10%
10%
10%

97.29

10%

Interest Income (TE)

4.51

- Interest Expense

1.07

Net Interest Income (TE)

3.44

4.40
0.97
3.43
0.83
2.84
1.75

0.98
0.91
1.00
0.94
0.79
0.18

4.31
0.94
3.37
1.06
2.58
0.20

0.96
0.88
0.98
0.84
0.72
0.65

4.19
0.39
3.80
1.14
2.90
0.77

0.93
0.37
0.91
0.78
0.80
0.40

95.50

0.98

92.65

0.95

88.91

0.91

86.57

0.89

82.37

0.94

81.37

0.95

Margin Analysis:
Avg Earning Assets to Avg Assets
Avg Int-Bearing Funds to Avg
Assets

77.07

Loan & Lease Analysis:
4.74

10%

2.07

0.44

1.21

0.26

3.91

0.83

Liquidity
Net Non Core Fund Dep New
$250M

21.60

Net Loans & Leases to Assets

61.42

10%
10%

10.87
58.92

0.50
0.96

13.80
58.64

0.64
0.95

-5.88
63.26

-0.27
0.97

8.14

0.74

10.59

0.96

10.63

0.97

-Total

Capitalization
Tier One Leverage Capital

11

3.14
3.70

Comparison Score
Capital Score

Appendix 11
Projected EPS
Target PE Ratio
PE Weight
PE Target Price
Total Target Price

$
$

1.49
13.99
20%
20.85
19.46

Projected Book
Target PBV Ratio
Price BV Weight
BV Target Price

$

15.42
1.24
80%
19.12

3.23
4.81

2.55
4.83
Disclosures:
Ownership and material conflicts of interest:
The author(s), or a member of their household, of this report does not hold a financial interest in the securities of this company.
The author(s), or a member of their household, of this report does not know of the existence of any conflicts of interest that might bias the content or
publication of this report.
Receipt of compensation:
Compensation of the author(s) of this report is not based on investment banking revenue.
Position as a officer or director:
The author(s), or a member of their household, does not serve as an officer, director or advisory board member of the subject company.
Market making:
The author(s) does not act as a market maker in the subject company’s securities.
Ratings guide:
Banks rate companies as either a BUY, HOLD or SELL. A BUY rating is given when the security is expected to deliver absolute returns of 15% or greater
over the next twelve month period, and recommends that investors take a position above the security’s weight in the S&P 500, or any other relevant index.
A SELL rating is given when the security is expected to deliver negative returns over the next twelve months, while a HOLD rating implies flat returns over
the next twelve months.
Disclaimer:
The information set forth herein has been obtained or derived from sources generally available to the public and believed by the author(s) to be reliable, but
the author(s) does not make any representation or warranty, express or implied, as to its accuracy or completeness. The information is not intended to be used
as the basis of any investment decisions by any person or entity. This information does not constitute investment advice, nor is it an offer or a solicitation of
an offer to buy or sell any security. This report should not be considered to be a recommendation by any individual affiliated with [Society Name], CFA
Institute or the CFA Institute Research Challenge with regard to this company’s stock.

More Related Content

What's hot

Jp morgan derivative fail case
Jp morgan derivative fail caseJp morgan derivative fail case
Jp morgan derivative fail caseNoor Mohammed
 
A Decade of Credit, August 2014
A Decade of Credit, August 2014A Decade of Credit, August 2014
A Decade of Credit, August 2014Redington
 
Ocm April Commentary Final
Ocm April Commentary FinalOcm April Commentary Final
Ocm April Commentary FinalMichael J Levas
 
Stonier 1 Bank Performance Intersession_MJC
Stonier 1 Bank Performance Intersession_MJCStonier 1 Bank Performance Intersession_MJC
Stonier 1 Bank Performance Intersession_MJCMartin Cole
 
December 13 quarterly: Is this too good to be true?
December 13 quarterly: Is this too good to be true?December 13 quarterly: Is this too good to be true?
December 13 quarterly: Is this too good to be true?Mark_Krygier
 
2017 Q2 Fidelity Investment Outlook
2017 Q2 Fidelity Investment Outlook 2017 Q2 Fidelity Investment Outlook
2017 Q2 Fidelity Investment Outlook CEO Magazyn Polska
 
14 hartford funds hartford balanced income fund
14 hartford funds hartford balanced income fund14 hartford funds hartford balanced income fund
14 hartford funds hartford balanced income fund123jumpad
 
The New Normal: How to Achieve Profitable C&I Loan Growth in Today's Economy
The New Normal: How to Achieve Profitable C&I Loan Growth in Today's EconomyThe New Normal: How to Achieve Profitable C&I Loan Growth in Today's Economy
The New Normal: How to Achieve Profitable C&I Loan Growth in Today's EconomyLibby Bierman
 
2008 Financial Report
2008 Financial Report2008 Financial Report
2008 Financial Reportgrigerny
 
Capital Structure
Capital StructureCapital Structure
Capital Structurepurval
 
JPMorgan Chase 2007 Complete Annual Report
JPMorgan Chase  2007 Complete Annual ReportJPMorgan Chase  2007 Complete Annual Report
JPMorgan Chase 2007 Complete Annual Reportfinance2
 
Hyre Weekly Commentary
Hyre Weekly CommentaryHyre Weekly Commentary
Hyre Weekly Commentaryhyrejam
 
Damon Ridley – Proactive Advisor Magazine – Volume 6, Issue 7
Damon Ridley – Proactive Advisor Magazine – Volume 6, Issue 7Damon Ridley – Proactive Advisor Magazine – Volume 6, Issue 7
Damon Ridley – Proactive Advisor Magazine – Volume 6, Issue 7Proactive Advisor Magazine
 
December 2019 Investment Commentary & Performance Review
December 2019 Investment Commentary & Performance ReviewDecember 2019 Investment Commentary & Performance Review
December 2019 Investment Commentary & Performance ReviewAnthony A. Lombardi, CFA
 
case study , Executive compensation: needed incentives, justly deserved, or ...
 case study , Executive compensation: needed incentives, justly deserved, or ... case study , Executive compensation: needed incentives, justly deserved, or ...
case study , Executive compensation: needed incentives, justly deserved, or ...Fatima Aljaidi
 

What's hot (18)

Corporate failure
Corporate failureCorporate failure
Corporate failure
 
Jp morgan derivative fail case
Jp morgan derivative fail caseJp morgan derivative fail case
Jp morgan derivative fail case
 
A Decade of Credit, August 2014
A Decade of Credit, August 2014A Decade of Credit, August 2014
A Decade of Credit, August 2014
 
Ocm April Commentary Final
Ocm April Commentary FinalOcm April Commentary Final
Ocm April Commentary Final
 
Stonier 1 Bank Performance Intersession_MJC
Stonier 1 Bank Performance Intersession_MJCStonier 1 Bank Performance Intersession_MJC
Stonier 1 Bank Performance Intersession_MJC
 
December 13 quarterly: Is this too good to be true?
December 13 quarterly: Is this too good to be true?December 13 quarterly: Is this too good to be true?
December 13 quarterly: Is this too good to be true?
 
2017 Q2 Fidelity Investment Outlook
2017 Q2 Fidelity Investment Outlook 2017 Q2 Fidelity Investment Outlook
2017 Q2 Fidelity Investment Outlook
 
14 hartford funds hartford balanced income fund
14 hartford funds hartford balanced income fund14 hartford funds hartford balanced income fund
14 hartford funds hartford balanced income fund
 
federal reserve.
federal reserve.federal reserve.
federal reserve.
 
The New Normal: How to Achieve Profitable C&I Loan Growth in Today's Economy
The New Normal: How to Achieve Profitable C&I Loan Growth in Today's EconomyThe New Normal: How to Achieve Profitable C&I Loan Growth in Today's Economy
The New Normal: How to Achieve Profitable C&I Loan Growth in Today's Economy
 
2008 Financial Report
2008 Financial Report2008 Financial Report
2008 Financial Report
 
Dimensional otf rate expectations
Dimensional otf rate expectationsDimensional otf rate expectations
Dimensional otf rate expectations
 
Capital Structure
Capital StructureCapital Structure
Capital Structure
 
JPMorgan Chase 2007 Complete Annual Report
JPMorgan Chase  2007 Complete Annual ReportJPMorgan Chase  2007 Complete Annual Report
JPMorgan Chase 2007 Complete Annual Report
 
Hyre Weekly Commentary
Hyre Weekly CommentaryHyre Weekly Commentary
Hyre Weekly Commentary
 
Damon Ridley – Proactive Advisor Magazine – Volume 6, Issue 7
Damon Ridley – Proactive Advisor Magazine – Volume 6, Issue 7Damon Ridley – Proactive Advisor Magazine – Volume 6, Issue 7
Damon Ridley – Proactive Advisor Magazine – Volume 6, Issue 7
 
December 2019 Investment Commentary & Performance Review
December 2019 Investment Commentary & Performance ReviewDecember 2019 Investment Commentary & Performance Review
December 2019 Investment Commentary & Performance Review
 
case study , Executive compensation: needed incentives, justly deserved, or ...
 case study , Executive compensation: needed incentives, justly deserved, or ... case study , Executive compensation: needed incentives, justly deserved, or ...
case study , Executive compensation: needed incentives, justly deserved, or ...
 

Similar to CFA Institute Research Challenge Sterling Financial Corporation (STSA) research report Gonzaga University

CFA_Final Report_SYBT
CFA_Final Report_SYBTCFA_Final Report_SYBT
CFA_Final Report_SYBTHunter Willis
 
CFA final report SYBT
CFA final report SYBTCFA final report SYBT
CFA final report SYBTJinglin Li
 
The Case for High Yield Muni Bonds
The Case for High Yield Muni BondsThe Case for High Yield Muni Bonds
The Case for High Yield Muni BondsAnthony Tanner, CFA
 
UVU MBA Team -CFAI Research Challenge (1)
UVU MBA Team -CFAI Research Challenge (1)UVU MBA Team -CFAI Research Challenge (1)
UVU MBA Team -CFAI Research Challenge (1)Timothy Ellertson
 
LLG Market Outlook 2011
LLG Market Outlook 2011LLG Market Outlook 2011
LLG Market Outlook 2011LLG Financial
 
FIS Research - High Performance Community Banking
FIS Research - High Performance Community BankingFIS Research - High Performance Community Banking
FIS Research - High Performance Community BankingPaul McAdam
 
Polen Focus Growth Factsheet Sept 2015 (Institutional)
Polen Focus Growth Factsheet Sept 2015 (Institutional)Polen Focus Growth Factsheet Sept 2015 (Institutional)
Polen Focus Growth Factsheet Sept 2015 (Institutional)Alan Chu
 
Nonprofit Financial Analysis Exercise
Nonprofit Financial Analysis ExerciseNonprofit Financial Analysis Exercise
Nonprofit Financial Analysis ExerciseDavid Gehm
 
Mercer Capital's Atlantic Coast Bank Watch | August 2013
Mercer Capital's Atlantic Coast Bank Watch | August 2013Mercer Capital's Atlantic Coast Bank Watch | August 2013
Mercer Capital's Atlantic Coast Bank Watch | August 2013Mercer Capital
 
10 key trends changing investment management
10 key trends changing investment management10 key trends changing investment management
10 key trends changing investment managementtessat97
 
International Journal of Business and Management Invention (IJBMI)
International Journal of Business and Management Invention (IJBMI)International Journal of Business and Management Invention (IJBMI)
International Journal of Business and Management Invention (IJBMI)inventionjournals
 
ESOP Financing Webinar
ESOP Financing WebinarESOP Financing Webinar
ESOP Financing WebinarPCEcompanies
 
1 q09 earnings_press_release_final (1)
1 q09 earnings_press_release_final (1)1 q09 earnings_press_release_final (1)
1 q09 earnings_press_release_final (1)manoranjanpattanayak
 

Similar to CFA Institute Research Challenge Sterling Financial Corporation (STSA) research report Gonzaga University (20)

AFP_Sept 2015_v3
AFP_Sept 2015_v3AFP_Sept 2015_v3
AFP_Sept 2015_v3
 
CFA_Final Report_SYBT
CFA_Final Report_SYBTCFA_Final Report_SYBT
CFA_Final Report_SYBT
 
CFA final report SYBT
CFA final report SYBTCFA final report SYBT
CFA final report SYBT
 
Come Together
Come TogetherCome Together
Come Together
 
The Case for High Yield Muni Bonds
The Case for High Yield Muni BondsThe Case for High Yield Muni Bonds
The Case for High Yield Muni Bonds
 
UVU MBA Team -CFAI Research Challenge (1)
UVU MBA Team -CFAI Research Challenge (1)UVU MBA Team -CFAI Research Challenge (1)
UVU MBA Team -CFAI Research Challenge (1)
 
LLG Market Outlook 2011
LLG Market Outlook 2011LLG Market Outlook 2011
LLG Market Outlook 2011
 
2011 LPL Outlook
2011 LPL Outlook2011 LPL Outlook
2011 LPL Outlook
 
3 q11 jpm_epr_final
3 q11 jpm_epr_final3 q11 jpm_epr_final
3 q11 jpm_epr_final
 
3 q11 jpm_epr_final (1)
3 q11 jpm_epr_final (1)3 q11 jpm_epr_final (1)
3 q11 jpm_epr_final (1)
 
FIS Research - High Performance Community Banking
FIS Research - High Performance Community BankingFIS Research - High Performance Community Banking
FIS Research - High Performance Community Banking
 
Fall Insights 2013
Fall Insights 2013Fall Insights 2013
Fall Insights 2013
 
Polen Focus Growth Factsheet Sept 2015 (Institutional)
Polen Focus Growth Factsheet Sept 2015 (Institutional)Polen Focus Growth Factsheet Sept 2015 (Institutional)
Polen Focus Growth Factsheet Sept 2015 (Institutional)
 
Nonprofit Financial Analysis Exercise
Nonprofit Financial Analysis ExerciseNonprofit Financial Analysis Exercise
Nonprofit Financial Analysis Exercise
 
Mercer Capital's Atlantic Coast Bank Watch | August 2013
Mercer Capital's Atlantic Coast Bank Watch | August 2013Mercer Capital's Atlantic Coast Bank Watch | August 2013
Mercer Capital's Atlantic Coast Bank Watch | August 2013
 
10 key trends changing investment management
10 key trends changing investment management10 key trends changing investment management
10 key trends changing investment management
 
Mfs
MfsMfs
Mfs
 
International Journal of Business and Management Invention (IJBMI)
International Journal of Business and Management Invention (IJBMI)International Journal of Business and Management Invention (IJBMI)
International Journal of Business and Management Invention (IJBMI)
 
ESOP Financing Webinar
ESOP Financing WebinarESOP Financing Webinar
ESOP Financing Webinar
 
1 q09 earnings_press_release_final (1)
1 q09 earnings_press_release_final (1)1 q09 earnings_press_release_final (1)
1 q09 earnings_press_release_final (1)
 

Recently uploaded

03_Emmanuel Ndiaye_Degroof Petercam.pptx
03_Emmanuel Ndiaye_Degroof Petercam.pptx03_Emmanuel Ndiaye_Degroof Petercam.pptx
03_Emmanuel Ndiaye_Degroof Petercam.pptxFinTech Belgium
 
(DIYA) Bhumkar Chowk Call Girls Just Call 7001035870 [ Cash on Delivery ] Pun...
(DIYA) Bhumkar Chowk Call Girls Just Call 7001035870 [ Cash on Delivery ] Pun...(DIYA) Bhumkar Chowk Call Girls Just Call 7001035870 [ Cash on Delivery ] Pun...
(DIYA) Bhumkar Chowk Call Girls Just Call 7001035870 [ Cash on Delivery ] Pun...ranjana rawat
 
Solution Manual for Financial Accounting, 11th Edition by Robert Libby, Patri...
Solution Manual for Financial Accounting, 11th Edition by Robert Libby, Patri...Solution Manual for Financial Accounting, 11th Edition by Robert Libby, Patri...
Solution Manual for Financial Accounting, 11th Edition by Robert Libby, Patri...ssifa0344
 
02_Fabio Colombo_Accenture_MeetupDora&Cybersecurity.pptx
02_Fabio Colombo_Accenture_MeetupDora&Cybersecurity.pptx02_Fabio Colombo_Accenture_MeetupDora&Cybersecurity.pptx
02_Fabio Colombo_Accenture_MeetupDora&Cybersecurity.pptxFinTech Belgium
 
Andheri Call Girls In 9825968104 Mumbai Hot Models
Andheri Call Girls In 9825968104 Mumbai Hot ModelsAndheri Call Girls In 9825968104 Mumbai Hot Models
Andheri Call Girls In 9825968104 Mumbai Hot Modelshematsharma006
 
Call Girls In Yusuf Sarai Women Seeking Men 9654467111
Call Girls In Yusuf Sarai Women Seeking Men 9654467111Call Girls In Yusuf Sarai Women Seeking Men 9654467111
Call Girls In Yusuf Sarai Women Seeking Men 9654467111Sapana Sha
 
The Economic History of the U.S. Lecture 18.pdf
The Economic History of the U.S. Lecture 18.pdfThe Economic History of the U.S. Lecture 18.pdf
The Economic History of the U.S. Lecture 18.pdfGale Pooley
 
High Class Call Girls Nagpur Grishma Call 7001035870 Meet With Nagpur Escorts
High Class Call Girls Nagpur Grishma Call 7001035870 Meet With Nagpur EscortsHigh Class Call Girls Nagpur Grishma Call 7001035870 Meet With Nagpur Escorts
High Class Call Girls Nagpur Grishma Call 7001035870 Meet With Nagpur Escortsranjana rawat
 
00_Main ppt_MeetupDORA&CyberSecurity.pptx
00_Main ppt_MeetupDORA&CyberSecurity.pptx00_Main ppt_MeetupDORA&CyberSecurity.pptx
00_Main ppt_MeetupDORA&CyberSecurity.pptxFinTech Belgium
 
How Automation is Driving Efficiency Through the Last Mile of Reporting
How Automation is Driving Efficiency Through the Last Mile of ReportingHow Automation is Driving Efficiency Through the Last Mile of Reporting
How Automation is Driving Efficiency Through the Last Mile of ReportingAggregage
 
Best VIP Call Girls Noida Sector 18 Call Me: 8448380779
Best VIP Call Girls Noida Sector 18 Call Me: 8448380779Best VIP Call Girls Noida Sector 18 Call Me: 8448380779
Best VIP Call Girls Noida Sector 18 Call Me: 8448380779Delhi Call girls
 
Independent Call Girl Number in Kurla Mumbai📲 Pooja Nehwal 9892124323 💞 Full ...
Independent Call Girl Number in Kurla Mumbai📲 Pooja Nehwal 9892124323 💞 Full ...Independent Call Girl Number in Kurla Mumbai📲 Pooja Nehwal 9892124323 💞 Full ...
Independent Call Girl Number in Kurla Mumbai📲 Pooja Nehwal 9892124323 💞 Full ...Pooja Nehwal
 
Call Girls Service Nagpur Maya Call 7001035870 Meet With Nagpur Escorts
Call Girls Service Nagpur Maya Call 7001035870 Meet With Nagpur EscortsCall Girls Service Nagpur Maya Call 7001035870 Meet With Nagpur Escorts
Call Girls Service Nagpur Maya Call 7001035870 Meet With Nagpur Escortsranjana rawat
 
Bladex Earnings Call Presentation 1Q2024
Bladex Earnings Call Presentation 1Q2024Bladex Earnings Call Presentation 1Q2024
Bladex Earnings Call Presentation 1Q2024Bladex
 
Russian Call Girls In Gtb Nagar (Delhi) 9711199012 💋✔💕😘 Naughty Call Girls Se...
Russian Call Girls In Gtb Nagar (Delhi) 9711199012 💋✔💕😘 Naughty Call Girls Se...Russian Call Girls In Gtb Nagar (Delhi) 9711199012 💋✔💕😘 Naughty Call Girls Se...
Russian Call Girls In Gtb Nagar (Delhi) 9711199012 💋✔💕😘 Naughty Call Girls Se...shivangimorya083
 
06_Joeri Van Speybroek_Dell_MeetupDora&Cybersecurity.pdf
06_Joeri Van Speybroek_Dell_MeetupDora&Cybersecurity.pdf06_Joeri Van Speybroek_Dell_MeetupDora&Cybersecurity.pdf
06_Joeri Van Speybroek_Dell_MeetupDora&Cybersecurity.pdfFinTech Belgium
 
VVIP Pune Call Girls Katraj (7001035870) Pune Escorts Nearby with Complete Sa...
VVIP Pune Call Girls Katraj (7001035870) Pune Escorts Nearby with Complete Sa...VVIP Pune Call Girls Katraj (7001035870) Pune Escorts Nearby with Complete Sa...
VVIP Pune Call Girls Katraj (7001035870) Pune Escorts Nearby with Complete Sa...Call Girls in Nagpur High Profile
 
fca-bsps-decision-letter-redacted (1).pdf
fca-bsps-decision-letter-redacted (1).pdffca-bsps-decision-letter-redacted (1).pdf
fca-bsps-decision-letter-redacted (1).pdfHenry Tapper
 
VIP Call Girls Thane Sia 8617697112 Independent Escort Service Thane
VIP Call Girls Thane Sia 8617697112 Independent Escort Service ThaneVIP Call Girls Thane Sia 8617697112 Independent Escort Service Thane
VIP Call Girls Thane Sia 8617697112 Independent Escort Service ThaneCall girls in Ahmedabad High profile
 

Recently uploaded (20)

03_Emmanuel Ndiaye_Degroof Petercam.pptx
03_Emmanuel Ndiaye_Degroof Petercam.pptx03_Emmanuel Ndiaye_Degroof Petercam.pptx
03_Emmanuel Ndiaye_Degroof Petercam.pptx
 
(DIYA) Bhumkar Chowk Call Girls Just Call 7001035870 [ Cash on Delivery ] Pun...
(DIYA) Bhumkar Chowk Call Girls Just Call 7001035870 [ Cash on Delivery ] Pun...(DIYA) Bhumkar Chowk Call Girls Just Call 7001035870 [ Cash on Delivery ] Pun...
(DIYA) Bhumkar Chowk Call Girls Just Call 7001035870 [ Cash on Delivery ] Pun...
 
Solution Manual for Financial Accounting, 11th Edition by Robert Libby, Patri...
Solution Manual for Financial Accounting, 11th Edition by Robert Libby, Patri...Solution Manual for Financial Accounting, 11th Edition by Robert Libby, Patri...
Solution Manual for Financial Accounting, 11th Edition by Robert Libby, Patri...
 
02_Fabio Colombo_Accenture_MeetupDora&Cybersecurity.pptx
02_Fabio Colombo_Accenture_MeetupDora&Cybersecurity.pptx02_Fabio Colombo_Accenture_MeetupDora&Cybersecurity.pptx
02_Fabio Colombo_Accenture_MeetupDora&Cybersecurity.pptx
 
Andheri Call Girls In 9825968104 Mumbai Hot Models
Andheri Call Girls In 9825968104 Mumbai Hot ModelsAndheri Call Girls In 9825968104 Mumbai Hot Models
Andheri Call Girls In 9825968104 Mumbai Hot Models
 
Veritas Interim Report 1 January–31 March 2024
Veritas Interim Report 1 January–31 March 2024Veritas Interim Report 1 January–31 March 2024
Veritas Interim Report 1 January–31 March 2024
 
Call Girls In Yusuf Sarai Women Seeking Men 9654467111
Call Girls In Yusuf Sarai Women Seeking Men 9654467111Call Girls In Yusuf Sarai Women Seeking Men 9654467111
Call Girls In Yusuf Sarai Women Seeking Men 9654467111
 
The Economic History of the U.S. Lecture 18.pdf
The Economic History of the U.S. Lecture 18.pdfThe Economic History of the U.S. Lecture 18.pdf
The Economic History of the U.S. Lecture 18.pdf
 
High Class Call Girls Nagpur Grishma Call 7001035870 Meet With Nagpur Escorts
High Class Call Girls Nagpur Grishma Call 7001035870 Meet With Nagpur EscortsHigh Class Call Girls Nagpur Grishma Call 7001035870 Meet With Nagpur Escorts
High Class Call Girls Nagpur Grishma Call 7001035870 Meet With Nagpur Escorts
 
00_Main ppt_MeetupDORA&CyberSecurity.pptx
00_Main ppt_MeetupDORA&CyberSecurity.pptx00_Main ppt_MeetupDORA&CyberSecurity.pptx
00_Main ppt_MeetupDORA&CyberSecurity.pptx
 
How Automation is Driving Efficiency Through the Last Mile of Reporting
How Automation is Driving Efficiency Through the Last Mile of ReportingHow Automation is Driving Efficiency Through the Last Mile of Reporting
How Automation is Driving Efficiency Through the Last Mile of Reporting
 
Best VIP Call Girls Noida Sector 18 Call Me: 8448380779
Best VIP Call Girls Noida Sector 18 Call Me: 8448380779Best VIP Call Girls Noida Sector 18 Call Me: 8448380779
Best VIP Call Girls Noida Sector 18 Call Me: 8448380779
 
Independent Call Girl Number in Kurla Mumbai📲 Pooja Nehwal 9892124323 💞 Full ...
Independent Call Girl Number in Kurla Mumbai📲 Pooja Nehwal 9892124323 💞 Full ...Independent Call Girl Number in Kurla Mumbai📲 Pooja Nehwal 9892124323 💞 Full ...
Independent Call Girl Number in Kurla Mumbai📲 Pooja Nehwal 9892124323 💞 Full ...
 
Call Girls Service Nagpur Maya Call 7001035870 Meet With Nagpur Escorts
Call Girls Service Nagpur Maya Call 7001035870 Meet With Nagpur EscortsCall Girls Service Nagpur Maya Call 7001035870 Meet With Nagpur Escorts
Call Girls Service Nagpur Maya Call 7001035870 Meet With Nagpur Escorts
 
Bladex Earnings Call Presentation 1Q2024
Bladex Earnings Call Presentation 1Q2024Bladex Earnings Call Presentation 1Q2024
Bladex Earnings Call Presentation 1Q2024
 
Russian Call Girls In Gtb Nagar (Delhi) 9711199012 💋✔💕😘 Naughty Call Girls Se...
Russian Call Girls In Gtb Nagar (Delhi) 9711199012 💋✔💕😘 Naughty Call Girls Se...Russian Call Girls In Gtb Nagar (Delhi) 9711199012 💋✔💕😘 Naughty Call Girls Se...
Russian Call Girls In Gtb Nagar (Delhi) 9711199012 💋✔💕😘 Naughty Call Girls Se...
 
06_Joeri Van Speybroek_Dell_MeetupDora&Cybersecurity.pdf
06_Joeri Van Speybroek_Dell_MeetupDora&Cybersecurity.pdf06_Joeri Van Speybroek_Dell_MeetupDora&Cybersecurity.pdf
06_Joeri Van Speybroek_Dell_MeetupDora&Cybersecurity.pdf
 
VVIP Pune Call Girls Katraj (7001035870) Pune Escorts Nearby with Complete Sa...
VVIP Pune Call Girls Katraj (7001035870) Pune Escorts Nearby with Complete Sa...VVIP Pune Call Girls Katraj (7001035870) Pune Escorts Nearby with Complete Sa...
VVIP Pune Call Girls Katraj (7001035870) Pune Escorts Nearby with Complete Sa...
 
fca-bsps-decision-letter-redacted (1).pdf
fca-bsps-decision-letter-redacted (1).pdffca-bsps-decision-letter-redacted (1).pdf
fca-bsps-decision-letter-redacted (1).pdf
 
VIP Call Girls Thane Sia 8617697112 Independent Escort Service Thane
VIP Call Girls Thane Sia 8617697112 Independent Escort Service ThaneVIP Call Girls Thane Sia 8617697112 Independent Escort Service Thane
VIP Call Girls Thane Sia 8617697112 Independent Escort Service Thane
 

CFA Institute Research Challenge Sterling Financial Corporation (STSA) research report Gonzaga University

  • 1. Banking Gonzaga University Student Research This report is published for educational purposes only by students competing in the CFA Institute Research Challenge. Sterling Financial Corporation Ticker: ●STSA Price: ●$18.49 Date 01/26/2012 Recommendation: ●Hold Price Target: ●$19.46 Split-Adjusted Earnings/Share Mar. Jun. Sept. Dec. Year P/E Ratio P/B Ratio 2009A ($0.40) ($0.55) ($7.48) ($5.37) ($13.80) NA 1.51x 2010A -1.43 -0.94 0.54 -10.37 -12.2 NA 1.53x 2011A 0.09 0.12 0.18 0.24 0.63 26.51x 1.18x 2012E 0.26 0.46 0.35 0.42 1.49 13.06x 1.26x Highlights  Price Target: Our analysis indicates a one year price target of $19.46, which is a 5.25% increase over the current price of $18.49.  Market Comparison: Sterling has performed better than the SPDR S&P Regional Banking index (KRE) over the past 6 months with a 9.19% return compared to 5.35% for the index. Sterling’s volatility (beta 2.21) is higher than the index, however, which has a beta of 1.02. 11.61-19.71  107,553 2.21 NA 62,057,645 1.15B Growth Strategies: A primary organic growth strategy for Sterling is to increase loan originations. The company originated $926 million in portfolio loans in 2011, which represents a 195% increase over the previous year. We estimate that this trend will continue (although at a slower rate) throughout 2012 due to improving loan demand and low interest rates. In addition to the growth of the loan portfolio, the bank is actively pursuing a strategy of growth by acquisition. In the first quarter of 2012, they should complete a Purchase and Assumption agreement with First Independent Bank in Vancouver WA. Along with market penetration and asset growth benefits, this transaction will allow Sterling to begin offering trust and wealth management services to its existing clients. Market Profile 52 Week Price Range Average Daily Volume Beta Dividend Yield (estimated) Common Shares Outstanding Market Capitalization Institutional Holdings (shares) Insider Holdings (shares) 45.42M 6.49M Earnings per share Book Value per Share Tier 1 Capital 0.63 14.16 11.40%  Improving Trends: Net interest margin has improved since the recapitalization in August 2010, where Sterling was at 3.03%, to 3.29% as of December 31, 2011. The loan loss allowances have also decreased steadily from $335M in December, 2009 to $177M in September of 2011, giving them an average quarterly decrease of $21M over those seven quarters. Other Real Estate Owned (OREO) has also fallen from its peak of $161M at the end of 2010 to $81.9M by the end of 2011.  Valuation Risks: Continued economic uncertainty and a generally cautious market may have a negative impact on the volatility and price of Sterling in the coming year. Slow growth in the economy could also keep interest rates low, which would put continued pressure on Sterling’s interest rate margins. This could slow down loan growth rates putting pressure on earnings. This earnings pressure, however, would be partially offset by improved interest income from the existing commercial loan portfolio.  Conclusion: Sterling is a fundamentally sound company that should perform well in its business operations. At current market prices, Sterling is a hold, but they could become a buy in the event of market correction. 1
  • 2. Indexed Returns $115 $112 $109 $106 $103 $100 $97 $94 $91 $88 $85 $82 $79 $76 $73 $70 STSA KRE* *SPDR S&P Regional Banking ETF (KRE) Source:Yahoo Finance Business Description Sterling Financial Corporation is the bank holding company for Sterling Savings Bank, which began in 1983 in Spokane, Washington. Sterling Savings bank also operates a subsidiary commercial bank, Intervest Mortgage Investment Co., founded in 1987, which focuses on institutional lending. Sterling expanded rapidly, largely through aggressive acquisitions, and now has over $9.1 billion in assets, with 178 branches in five states including Washington, Oregon, Montana, Idaho and California. As a regional commercial bank Sterling offers a typical array of financial products including consumer loans, real estate mortgages, retirement and wealth management services, commercial loans, and a full range of deposit products. While they offer a broad product mix, they have a strong focus on business relationships. Moving forward, the bank seeks to strengthen this focus. During the height of the market, Sterling was heavily involved in construction lending, especially speculative development projects, with as much as 33% of their total loan portfolio concentrated in this one segment. When the real estate market collapsed, many of these loans defaulted. Many banks, including Sterling, are still liquidating OREO properties, much of which was land and speculative housing developments. OREO increased dramatically as management took foreclosure actions on non performing assets, and since their peak at the end of 2010, Sterling has been liquidating these problem loans systematically. As a necessary reaction to the current market conditions, only 4% of their loan portfolio is now concentrated in construction and development (C&D). This has helped to improve their portfolio quality, since C&D loans typically carry the highest level of default risk. Analysis of their current portfolio concentration indicates that they are much more reasonably diversified, so OREO should continue to decline. Sterling’s subsidiary, Intervest, is a small portion of the overall company, but because this company specializes in brokering loans to the secondary market (primarily insurance companies), they are able to offer terms to borrowers that most community banks or credit unions cannot offer. This allows Sterling to capture borrowers that would be forced to work with larger national banks that also offer institutional lending solutions. The loans that are sold to insurance companies are typically of high quality, but the terms would not be favorable to Sterling because they often have longer fixed-rate terms associated with them. By brokering these loans, Sterling is able to earn fee income while reserving capital for higher yielding loan products. Management has targeted their portfolio concentrations at 1/3 in consumer loans (including mortgages), 1/3 in commercial loans and 1/3 in non-owner occupied commercial real estate. With much of their loan portfolio in commercial loans, they are at the high end of the spectrum compared to their peer group. This is not necessarily a concern, but it does indicate the strategic approach that they are taking. This strategy has a unique set of benefits and risks, which we discuss throughout this analysis.
  • 3. Community Involvement One of Sterling’s strengths is their Community Involvement, which has been a focus for Sterling since its inception. They show commitment to customer relationships and their communities through multiple channels, as they hope to make a positive impact on the communities in which they operate. In 2010, Sterling employees donated more than 25,000 hours to over 400 organizations, demonstrating their dedication to the mission of being a community-focused entity. This community investment is not only good for society, but it creates name recognition and a positive image of the bank. Recapitalization Due to its heavy loan losses from 2008-2010, Sterling’s capitalization plunged until they came under heavy regulatory pressure that culminated in a Cease and Desist order in 2010. The Cease and Desist order required Sterling to improve its Tier 1 capital to 10% or better, reduce its level of classified and non-performing loans, and to restructure the management team. Sterling restructured in August 2010, receiving a net capital infusion of $730 million from two private equity funds and 30 other individual investors. Both of the private equity firms are registered as bank holding companies, with significant banking experience. Each received one non-voting board seat. Subsequent to the restructuring, Sterling’s capitalization exceeded their 10% Tier 1 capital requirements. As part of this recapitalization, the cease and desist order was lifted. A large part of Sterling’s strategy has been to reduce its levels of non-performing assets by selling or otherwise divesting themselves of distressed properties. They have been able to reduce OREO properties by $68.9 million year over year, which is a 46% decrease. Loan loss allowance has fallen by $69.6 million over the past year, which is a 28% decrease. Millions Loan Loss Allowance 400 350 300 250 200 150 100 50 0 Management Much of the success of the recapitalization of Sterling can be attributed to the current management of Sterling Financial Corporation and Sterling Savings Bank. Despite a challenging environment for the banking industry, managers were able to orchestrate the investment of two large private equity firms, who provided the large capital investment necessary for recapitalization. This success, along with consistent improvement of the financial performance of the institution, indicates the strong capabilities of management. Brad Williamson, director of the state DFI Banking Division, who headed the team that was in charge of closing banks in Washington, stated succinctly that, “Sterling survived because management did a good job getting a handle on its problems.” J. Gregory Seibly serves as the President and CEO of Sterling Financial Corporation, and has been a major part of the restructuring of Sterling. Mr. Seibly also sits on the Board of Directors, which boasts impressive resumes within the banking industry, as well as in other business endeavors. Included in the Board are former management from Wells Fargo & Company, Bank of America, U.S. Bank, Citicorp, and JPMorgan Chase, as well as presidents of Ivar’s Inc., Norwest Corporation, and Starbucks Coffee. This extensive understanding of business and banking allows Sterling to view their current situation from knowledgable positions and diverse prior experiences. Executive experience is critical to determining the direction of the organization, so it is important that Sterling’s leadership comes from diverse financial backgrounds. The presence of these
  • 4. diverse backgrounds and experiences suggests that they will have the knowledge necessary to grow Sterling into the future. One notable management change in 2011 was that Sterling’s former CFO was replaced with Patrick J. Rusnak. Before moving to Sterling, Mr. Rusnak was the CEO of AmericanWest Bank. He was promoted from CFO to CEO and tasked with the responsibility of recapitalizing to avoid bankruptcy. He was successful in recapitalizing the bank by negotiating investments from private equity investors. This experience in working through the turnaround of a troubled bank and the facilitation of a recapitalization exhibits valuable skills which will help Mr. Rusnak to facilitate Sterling’s full recovery. The private equity (PE) firms that injected capital into Sterling were Warburg Pincus and Thomas H. Lee Partners. According to Private Equity International, an industry trade publication, Warburg Pincus is the 13th largest private equity firm in the world and Thomas H. Lee Partners is the 27th largest (based on total fundraising over the preceding 5 years). Although banking regulations restrict the PE firms from exercising direct control over the management of banks, the management expertise and network of industry contacts they provide is a tremendous asset for a relatively small bank such as Sterling. Sterling also benefits from the expertise of Scott L. Jaeckel, the managing director of Thomas H Lee Partners, and David A. Coulter, the managing director and senior advisor at Warburg Pincus, who joined the Board of Directors in 2010. As a result of the bargaining power of these large investors, Sterling may be able to engage in service contracts with vendors on more favorable terms. The PE firms provide a wealth of knowledge that will be useful in benchmarking and determining best practices. Prior to the financial crisis, Sterling outgrew the expertise of their management, which led to many of the subsequent problems. Overall, our analysis of the new management at Sterling indicates that they are well equipped to direct the company towards greater profitability, in the future. Growth Strategy Sterling has strived to increase loan originations year over year. The company originated $926M million in portfolio loans in 2011, which represents a 195% increase over the previous year. We estimate that this trend will continue throughout 2012 due to improved loan demand and low interest rates. Downward pressure on interest rates is a concern, however, due to the increase in demand and increase in competition as many banks more aggressively pursue loan growth. This trend is evidenced by the decrease in loan yields of 0.13% since 3rd qtr of 2011. Loan Portfolio Concentrations Sterling 13% 4% 18% 7% 7% 25% 13% 10% 2% Residential real estate Investor CRE Multifamily Construction Total commercial real estate Owner occupied CRE C&I Total commercial Sterling has recently been increasing their percentage of assets concentrated in multi-family housing loans. This is beneficial as this is one of the strongest sectors in the commercial real estate spectrum. Management has an internal target for this sector of 22% of total loans. The average loan to value (LTV) of these loans is 66% and the debt service coverage ratio (DSCR) (net operating income divided by debt payments) is 1.30:1. Both of these ratios are better than the standard underwriting qualifications of 75% LTV and 1.20:1 DSCR at most competing commercial banks. This should help them to avoid significant defaults. Consumer Loan Portfolio Concentration First Independent 47% 6% 6% 13% 16% 12% Consumer and Other C&I CRE Multi-Family 1-4 Family C&D At projected growth rates for multi-family loans, the company will need to start selling these notes in order to maintain their target loan portfolio composition. This could be done effectively through their subsidiary, Intervest. They could also attempt to grow their other loan segments at a similar rate. In addition to loan portfolio growth, the bank is actively pursuing a strategy of growth by acquisition. In the first quarter of 2012, they should complete a Purchase and Assumption agreement with First Independent Bank in Vancouver, WA. Along with market penetration and asset growth benefits, this transaction will allow Sterling to begin offering trust and wealth management services to its existing clients. With Tier 1 capital exceeding 11%, Sterling is well-positioned for further acquisitions. First Independent Purchase and Assumption As previously noted, Sterling has historically grown their business primarily through acquisitions. Now that they have returned to profitability, they appear to be returning to that model. Sterling is in the process of finalizing a P&A Agreement with First Independent Bank. The P&A structure was chosen over an acquisition in order to allow Sterling to exclude approximately $79 million worth of undesirable assets. The transaction will add approximately $691 million in deposits, $450 million of trust and wealth management assets, and 16 additional branch and office locations. First Independent operated with a similar focus on community banking, so this acquisition should allow Sterling to expand their reach in the Vancouver/Portland market, while maintaining their community focus and feel. One of the most beneficial aspects of this transaction is that it will allow Sterling to add wealth management and trust services to its product offerings throughout the company. Our analysis indicates that there will not be significant overlap of the geographical footprint of the combined entities. Sterling’s management has stated that they expect modest operational efficiencies from the P&A as a result of the consolidation of back office personnel.
  • 5. Deposit Mix First Independent 26% 16% 35% 13% 7% 3% CDs IRA Savings Money Market Non-interest Checking The acquired assets and deposits have a product mix favorable to Sterling, and merited a $25 million premium, of which $17 million is contingent upon the quality of the loan portfolio and retention of at least 90% of pre P&A deposit levels. The conditions of the closing are reasonable and the banks are working closely with regulators throughout the process, so the transaction is likely to be completed in the first quarter of 2012. Customer Retention The McKinsey Banking Report suggests that banks will need to transition to a Customer Relationship focus in order to succeed in today’s economy. Sterling paid above industry average for time deposits in an effort to attract customers and maintain adequate liquidity prior to the restructuring. This resulted in interest expense being well above industry average. Sterling seeks to retain their core customers, but allow “floating” customers (those that change banks often in search of the best rates) to drift away. To retain their core customers, Sterling is focusing on customer service and relationship banking, positioning itself to become the premier one-stop commercial bank in their region. This builds customer loyalty, while also shifting their deposit mix more toward business checking accounts and demand deposits, instead of savings accounts and CD’s. Industry Overview and Competitive Positioning Financial markets have remained volatile as investors are still trying to determine the impact of the housing crisis going into the future, as well as determine the impact of the European debt crisis on the economy. Although loan demand is currently rising, there is still the threat that lagging loan demand due to poor economic conditions and uncertain economic outlook could slow the financial sector recovery. Although it does not directly impact regional banks, the spillover effects of the European debt crisis could adversely impact the market for financial stocks as a whole. In today’s banking environment, where interest rate risk is a significant concern, commercial lending typically offers the benefit of variable loan rates, which can reduce this risk. In general, banks prefer to have variable loan products in a rising rate environment. Following the recent Federal Reserve pronouncements, we believe that interest rates will remain fairly flat through 2013. Loan demand has increased over the past two quarters, especially for business loans. This trend is helpful for commercial banks such as Sterling. Despite concerns about commercial real estate following the pattern of extremely high foreclosures, as seen in the housing sector, commercial real estate foreclosures have not been as high as projected. In the Pacific Northwest (Sterling’s primary market), the foreclosure rate and rate of distressed properties has been manageable. Regulatory Risk On October 1, 2011 the Durbin Amendment of the Dodd-Frank Act took affect. This regulation significantly reduces the fee income generated by the use of debit cards for institutions with more than $10 billion in assets. It is anticipated that Sterling will not reach the $10 billion threshold in 2012, but likely would in 2013. At that point, the projected revenue losses per year will be approximately $7 million. These transaction fee changes do not affect credit card fees. Sterling has very low levels of credit card assets as a percentage of total loans, and could increase their marketing of credit cards in order to offset this loss of income. The Troubled Asset Relief Program (TARP) was signed into law in October 2008, as an attempt by the U.S. Government to increase liquidity and capitalization by purchasing assets and equity from financial institutions, thereby strengthening the financial sector as a whole. Sterling received funds from TARP in December of 2008. As a concession to Sterling, the preferred stock shares issued to the government were converted to common stock during their recapitalization, so they have no further special obligations as a consequence of TARP. The government’s consequential minority ownership of Sterling has no impact on its valuation. The Federal Reserve’s recent endorsement of higher capital requirements could limit the profitability potential of large institutional banks. Although these changes could impact smaller banks, it could function as an opportunity for Sterling, as these regulations are likely to affect larger banks more heavily. Further, Sterling’s Tier 1 capital is already 11.4%, and they are maintaining an 11% target rate. Any regulatory change in this area could benefit Sterling, as Sterling would likely exceed the new standard, and it would put further pressure on Sterling’s competitors.
  • 6. Competitor Analysis Banking has become a commoditized industry. In order to compete effectively, some banks try to specialize in key areas and some use a diversification strategy (all things to all people). The competitive landscape for Sterling includes a wide range of financial institutions. Large banks such as BofA, Chase and Wells Fargo, and small community banks all compete with Sterling for customers. (See Marketshare tables in Appendix 3) Within Washington, Oregon, Idaho, Montana and California, Sterling has the ability to serve the specific needs of the customer, but their lack of presence outside those states makes Sterling less appealing to depositors who need access to their funds across the country or internationally. For example, Sterling cannot compete with larger banks such as JPMorgan Chase or Bank of America in their geographical reach, because those banks each offer over 5,000 branch offices nationwide where Sterling is currently limited to 193 branches and only the Northwest region. Credit unions, which have been growing rapidly, were given an additional surge of membership and exposure as a result of Occupy Wall Street and National Bank Transfer Day initiatives which urged bank customers to move to these non-profit financial institutions. Regulations for credit unions have become less stringent over time, allowing them to have less restrictive membership requirements and to offer additional business products. They are increasingly becoming a threat to banks as they expand into commercial lending. Deposit Mix-Sterling 32% 19% 41% 8% Interest-bearing transaction Noninterest-bearing transaction Savings and MMDA Time deposits Net Interest Margin The shape of the treasury yield curve has flattened significantly over the past 6 months. Flattening of the curve is caused by a number of factors, including the Fed’s quantitative easing, but usually is indicative of bond investors’ lack of confidence in the market. Net interest margin has been impacted by this shrinking margin between short and long term interest rates. As long term interest rates decline, competition forces banks to lower the rates that they charge for loans. Savings rates are not able to fall at the same rate, so their margins shrink. This is a significant risk for Sterling as they have a higher than average cost of capital. In addition to the capital that Sterling raised through private equity firms, they needed to quickly raise capital by attracting traditional deposits. To accomplish this, they were required to offer significantly higher rates than market for deposits (primarily time deposits). This strategy was successful, but it reduced the net interest margin of the bank. With maturities between 1 and 5 years, these CDs are starting to mature and this should help reduce the average cost of capital. As of December 31st, 2011, the average cost of these deposits was 0.80%, which matched the peer average. This cost of funds for Sterling is down from 0.86% in the third quarter of 2011. The P&A will also help to reduce the cost of deposits because First Independent has an average cost of interest bearing deposits significantly below the market, at 0.41%. As with most financial institutions, a vast majority of Sterling’s fixed mortgages are immediately sold to Fannie Mae or Freddie Mac after origination. This asset management strategy reduces Sterling’s exposure to interest rate risk in the current interest rate environment since real estate loans have long term rates that are still historically low. Regulation Q, originally part of the Glass-Steagall Act of 1933, was recently repealed by the Dodd-Frank Act. As a result of the repeal of Reg Q, banks are no longer prohibited from paying interest on demand deposits (checking accounts). The impact of this change will likely be minimal in this low rate environment, but once interest rates start to climb, this will be another competitive tool that banks will use to attract deposits, and could negatively impact net interest margins. Duration Gap Analysis One tool commonly used to calculate interest rate risk is an analysis of the Duration Gap between assets and liabilities. Sterling manangment has calculated their duration of assets at 1.65 years and duration of liabilities at 2.42 years. This yields a duration gap of -1.088 years. Because of a negative duration gap, Sterling’s financial performance will actually improve as interest rates rise (all else being equal). It should be noted that in calculating durations of assets and liabilities, managers must make certain assumptions when determining the cash flow streams. If these assumptions are incorrect, then the validity of the duration gap analysis will also be incorrect. Based on Sterling’s duration numbers, the change in net worth as a percentage of assets would increase 50% if interest rates increase by 3%. This indicates that Sterling could significantly benefit from an environment of rising interest rates. Investment Summary Our analysis indicates a one year price target of $19.46, which is a 5% increase over the current price. Sterling has performed better than the SPDR S&P Regional Banking index over the past 6 months with a 9.19% return vs. 5.35% for the index. Sterling’s volatility (beta of 2.21) is higher than the index, which has a beta of 1.02.
  • 7. Currently, Sterling does not pay dividends. Competitors such as Umpqua Holdings Corporation (UMPQ) and Glacier Bancorp, Inc. (GBCI) have paid regular dividends to investors, making them appear stronger to investors who have a focus on dividend returns. Sterling stopped paying dividends during the financial crisis (after the third quarter of 2008). Very recently, one of the obstacles to paying dividends, the Memorandum of Understanding (MOU), was recinded. According to Sterling management, the Department of Financial Institutions (DFI) is reviewing Sterling’s financial condition relating to the final restrictions on dividend payments. This would indicate that Sterling may be able to start paying dividends once it has paid all of the accrued interest on its subordinated debt. Management has indicated that they do not currently have plans to issue dividends. Positive EPS Surprises: Sterling has a good track record of positive EPS surprises over the past four quarters, indicating that they have been successful in managing the firm. This recent track record of positive surprise also suggests that Sterling has been effective at managing market expectations by being very transparent in their actions. The positive track record continues in performance against the Financial sector as a whole, in which Sterling has outperformed by 3.7% in the last month and 18.9% over six months. The market has reacted well to Sterling’s performance outlook and the news of the P&A agreement with First Independent. The share price has risen over 18.5% since the purchase announcement. This also may be an indicator that the market supports management’s decision to seek out these types of acquisitions. Figure 1: Sterling Stock Price and News Last 12 Months Source: Schwab Valuation We derived the price target of Sterling using a weighted average of the Forward P/E ratio (20% weight) and the P/BV ratio (80%). Historically, the PE ratio has been a commonly used ratio for determining the current valuation of a company’s stock. One problem with this ratio in a poor economic climate is that when there are very low or negative earnings, then this valuation tool becomes less effective. As banks have started to recover from the recession, this ratio is again a relevant instrument for assessing the value of a company. The Forward PE ratio looks further into the recovery, creating more realistic valuation expectations. Because it
  • 8. relies on third-party estimates of future earnings for the comparable banks, it still merits a lower weighting than the P/BV ratio. The price to book value ratio (P/BV) is arguably the best metric for evaluating a capital intensive company such as a bank. Unlike many industries, this is a good metric because the book value of assets for banks is presumably very close to the actual market value. This assumes that problem loans have been identified and marked to market. During the real estate bubble banks had inflated asset values, but we believe that the necessary corrections have been made and book values closely match the market. Any P/BV ratio of more than 1.00 would mean either that the market thinks the company has undervalued the assets or investors believe that the current (or projected) ROA is positive. Many banks are still trading at levels which result in P/BVs which are less than 1, but our comparables yielded a weighted average that was 1.24. Because this is the stronger of the two metrics, we gave the P/BV an 80% weighting in our analysis. (See Appendix 11) As we used a comparables approach for the valuation of Sterling, our analysis depended on finding the most highly comparable companies. The FDIC identifies Sterling’s peer group as all banks above $3 billion in assets. Sterling is a pure-play bank, and most larger banks are not pure play firms. Furthermore, banks with fewer than $3 billion in assets face a different regulatory environment. For these reasons, we determined that only banks within $6 billion in assets were truly comparable. We excluded banks above $16 billion in asset size, subsidiaries of larger banks, non-commercial banks, industrial banks and non-public banks. The remaining banks were ranked by their similarity to Sterling in a number of financial categories, including interest income and expense, net interest margin, loan loss provisions, non-interest income and expenses, and loan portfolio. Commercial banks operate in a different manner than retail banks, so the remaining banks were ranked based on the level of commercial assets comparative to Sterling. Those banks not highly similar in their asset mix were excluded. The financial information we used for this analysis came from the FDIC. (See Appendix 8) A banks’ performance is strongly influenced by the economic conditions in which they operate, so we calculated an economic strength coefficient for the remaining banks in our sample. We used two variables to determine the economic strength of States in which the banks operate: GDP growth and unemployment rates. For banks that operate in multiple States, we weighted these calculations based on the percentage of branches that they have in each state. (See Appendix 9) The banks in the sample are similar in size, have strong concentrations in commercial loans, and operate in markets that are equivalent economically to those of Sterling. In addition, their financial performance metrics and ROA are similar to Sterling’s. The nine banks we determined to be the closest peers to Sterling are First Midwest Bank (FMBI), Umpqua Bank (UMPQ), MB Financial Bank (MBFI), The Privatebank and Trust Company (PVTB), National Penn Bank (NPBC), Citizen Bank (CRBC), United Bank (UBSI), Banner Bank (BANR), and Columbia State Bank (COLB). Interestingly, three of the nine banks which we identified as the closest peers to Sterling are also direct competitors (Umpqua Bank, Banner Bank, and Columbia State Bank). The composite price to book value and P/E ratios were then calculated using weights assigned by their relative rankings. This gave a slightly higher weighting for those banks that were the most similar to Sterling. The resulting weighted average Forward P/E ratio target was 28.97 and the weighted average P/BV was calculated at 1.05. (See Appendix 11) We calculated the projected balance sheet and income statement data for Sterling and used the statistical forecasting method of two factor exponential smoothing to create baseline growth projections. Income forecasts were based on financial performance for Sterling and their comparables group, and balance sheet forecasts were based on Sterling’s own balance sheet, both using data from the last ten quarters. (See Appendix 4, 5, 6) We then modified these projections where necessary, following management guidance and taking into account competitive risks, economic outlook, and regulatory environment. Using this technique, we calculated the 12/31/12 book value per share to be $15.42 and the earnings per share to be $1.49. The EPS of $1.49 was multiplied by the weighted average Forward P/E ratio of the comparables (13.99) to arrive at a Target price of $20.85. The book value per share was multiplied by the P/BV of the comparables to give a price of $19.12. Using the 20/80 weighting noted above, the final calculated YE 2012 target price for Sterling is $19.46. (See Appendix 4, 7, 11)
  • 9. Financial Analysis Sensitivity Analysis EPS 3 2.25 1.49 0.99 0 BVPS 18.42 16.18 15.42 14.92 13.93 Price 26.67 22.35 19.47 17.57 17.27 Sensitivity analysis To determine the sensitivity of the market price to variability in earnings per share, we determined a range of possible earnings per share estimates. These estimates range from no earnings to $3 per share for 2012. For each earnings estimate, we calculated book value and used our target forward PE ratio and price to book value ratio to determine a target price. For our low estimate of no earnings, forward PE ratio would be not applicable, so the price target has a 100% weighting on the price to book value ratio. This sensitivity analysis provided a range of possible stock prices, from a no earnings $17.27 per share target to a high earnings $26.67 price target. Capital Structure Sterling benefits from a capital structure with little or no debt, making it less financially risky when compared to the industry aggregate. Competitors such as Glacier Bancorp, Inc. (GBCI) operate with greater long-term liabilities and therefore greater financial risk. Sterling does, however, have over $1 billion in junior subordinated notes (forward repurchase agreements) for which they pay an average interest rate of 3.9%. These interest payments have been accruing, and are required to be paid current before dividends can be paid. The high interest rate on these notes has an adverse impact on the net interest margin of the bank. (See Appendix 5) Earnings We took Sterling’s performance ratios and forecasted earnings based on projected changes. Interest income is expected to decline somewhat over the next year, but this is partially offset by a decrease in interest expense. Net interest margin improves to 3.38%, which is only a partial improvement over the 3.30% at close of 2011. Management’s target for net interest margin is 4.00, but we do not expect Sterling to reach this target until the Federal Reserve relaxes interest rate controls. (See Appendix 6, 7) Balance Sheet An understanding of the trends in asset growth is critical to an understanding of the financial performance of the company. Our analysis of Sterling’s asset growth assumes that loan portfolio would decrease somewhat in the first quarter and then begin gradual growth as Sterling manages the portfolio to remain below the $10 billion asset level. This has a net positive effect on Sterling’s net income for 2012. We expect the securities portfolio to be managed in a similar fashion, with tapered growth and then some decline in the fourth quarter, to keep Sterling from exceeding the $10 billion asset level. (See Appendix 5) Sterling maintains a direct purchase plan for individuals to buy newly issued shares directly through their transfer agent, American Stock Transfer & Transfer Services, LLC. Increase in common shares outstanding through this program is very small, and we projected very modest increases throughout the year. Investment Risks Insufficient Capital Levels If Sterling’s current capital levels are found to be insufficient because of changing regulations, they may need to raise additional capital that may be subject to additional regulatory restrictions. For example, if the economic conditions worsen leading to additional provision for loan losses then it could force Sterling to seek additional capital. Issuing New Securities Sterling may decide to raise capital through public or private debt or equity finacing, so if the decision is made to raise funds through the issuance of securities that could dilute ownership interests of existing shareholders. Acquisition Risks Acquisitions make up a large part of Sterling’s growth strategy, leaving them susceptible to the risks associated with acquisitions. These risks include overpaying for assets as well as improper implimentation or integration of newly aquired assets. Unfavorable accounting consequences as well as increases in taxes may cause acquisitions that appeared to be beneficial to ultimately hurt Sterling overall because of unforeseen factors. Regulator Restrictions There remains some uncertainty as to when regulator restrictions will be lifted or additionally imposed. Under the terms of the Reserve Bank Agreement, Sterling cannot currently pay dividends, and there is no certainty that the restriction on dividends will be lifted in the near future. The Reserve Bank Agreement also
  • 10. prevents Sterling from appointing new board members or senior executive officers, which could prevent Sterling from making personel changes that could benefit the bank. THL and Warburg Pincus Because of the significant holdings of these investors they each have a representative on the Board of Directors. Although these board members are non-voting, they will have influence over corporate governance. This becomes a risk if the goals of THL and Warburg Pincus become substantially different Sterling, leading to a conflict of interests on the Board. Stock Volatility Sterling’s stock price has been very volatile, which may cause investors to lack confidence in the investment quality of this stock. This volitility may be a result of factors completely outside of the control of Sterling, as well as larger trends within the Financial Sector, which includes Sterling. Public perception has a significant impact on stock price so if the public continues to lack confidence in the banking industry it could negatively impact the stock price.
  • 11. Appendix 1 (Source: Sterling 10-Q 2011 3rd Quarter) Largest Institutional Holders of STSA Holder Shares % Outstanding Value* Reported KING STREET CAPITAL M ANAGEM ENT, L.L.C. 2,973,487 4.8 36,811,769 30-Sep-11 Capital World Investors 2,888,260 4.66 35,756,658 30-Sep-11 Cyrus Capital Partners, L.P. 2,390,405 3.86 29,593,213 30-Sep-11 THORNBURG INVESTM ENT M ANAGEM ENT INC. 2,272,729 3.67 28,136,385 30-Sep-11 Anchorage Capital Group, LLC 2,272,727 3.67 28,136,360 30-Sep-11 LEE PARTNERS (THOM AS H.) 12,948,112 20.89 160,297,626 30-Sep-11 WARBURG PINCUS LLC 12,948,107 20.89 160,297,564 30-Sep-11 1,359,791 2.19 16,834,212 30-Sep-11 WELLINGTON M ANAGEM ENT COM PANY, LLP 907,191 1.46 11,231,024 30-Sep-11 BlackRock Institutional Trust Company, N.A. 603,540 0.97 7,471,825 30-Sep-11 Shares % Outstanding Value* Reported SM ALLCAP WORLD FUND 1,666,668 2.69 20,633,349 30-Sep-11 AM ERICAN FDS INSURANCE SER-GROWTH FD VANGUARD GROUP, INC. (THE) Appendix 2 (Source: Sterling 10-Q 2011 3rd Quarter) Largest Mutual Fund Holders of STSA Holder 1,221,592 1.97 15,123,308 30-Sep-11 VANGUARD SM ALL-CAP INDEX FUND 467,860 0.75 5,792,106 30-Sep-11 ISHARES RUSSELL 2000 INDEX FD 391,569 0.63 5,877,450 31-Oct-11 VANGUARD TOTAL STOCK M ARKET INDEX FUND 268,327 0.43 3,321,888 30-Sep-11 VANGUARD SM ALL CAP VALUE INDEX FUND 259,273 0.42 3,209,799 30-Sep-11 VANGUARD EXTENDED M ARKET INDEX FUND 251,775 0.41 3,116,974 30-Sep-11 FBR SM ALL CAP FINANCIAL FUND 244,185 0.39 3,023,010 30-Sep-11 Fidelity Strategic Advisors Small-M id Cap Fund 186,800 0.3 2,624,540 31-Aug-11 ISHARES RUSSELL 2000 VALUE INDEX FD 175,413 0.28 2,632,949 31-Oct-11
  • 12. Appendix 3 (Source: Sterling Investor Relations presentation) Appendix 4 Balance Sheet Assumptions Assets and Liabilities Total assets Cash and due from depository institutions Securities Net loans & leases Bank premises and fixed assets Other real estate owned Goodwill and other intangibles All other assets Total liabilities and capital Total liabilities Deposits held in domestic offices Other borrowed funds All other liabilities Common stock 30-Dec-11 30-Mar-12 30-Jun-12 30-Sep-12 30-Dec-12 1.97% 4.14% -1.54% -0.43% -26.58% -9.12% 7.72% 0.99% 2.39% -0.70% -0.43% -26.58% 0.00% 0.75% 0.49% 0.80% 0.00% -0.54% -26.58% 0.00% 0.00% 0.25% 0.00% 0.62% -0.76% -26.58% 0.00% -1.25% 0.12% -2.39% 0.94% -0.97% -26.58% 0.00% -2.30% 0.10% -5.27% 13.84% 0.10% -5.27% -13.84% 0.10% -5.27% -13.84% 0.10% -5.27% -13.84% 0.10% -5.27% -13.84% 0.02% 0.02% 0.02% 0.02% 0.02%
  • 13. Appendix 5 Balance Sheet Projections (*Dollar figures in 000's) Assets and Liabilities Total assets Cash and due from depository institutions Interest-bearing balances Securities Federal funds sold & reverse repurchase agreements Net loans & leases Trading account assets Bank premises and fixed assets Other real estate owned Goodwill and other intangibles All other assets 30-Mar-12 30-Jun-12 30-Sep-12 30-Dec-12 9200202 488077 381956 2608770 0 5577565 0 83652 60137 20078 361923 9921707 540899 430271 2836582 0 5978715 0 115082 44537 23151 382742 9942706 539400 435610 2836582 0 6015872 0 114210 32698 25985 377958 9913329 537232 441016 2768788 0 6072121 0 113099 24006 28818 369265 Total liabilities and capital Total liabilities Total deposits Deposits held in domestic offices % insured Federal funds purchased & repurchase agreements Trading liabilities Other borrowed funds Subordinated debt All other liabilities 9168755 8282996 6492403 6492403 0.9008 1055763 0 384253 245290 105288 9164964 8254784 6498994 6498994 0.9008 1055763 0 364021 245290 90716 9118811 8179661 6505592 6505592 0.9008 1005763 0 344855 245290 78161 9018315 8057291 6512197 6512197 0.9008 905763 0 326698 245290 67343 Total equity capital Total bank equity capital Perpetual preferred stock Common stock Surplus Undivided profits Noncontrolling interests in consolidated subsidiaries 885759 893759 0 1964627 61115 -1131983 0 910180 910180 0 1965020 61115 -1115955 0 939150 939150 0 1965413 61115 -1087378 0 961024 961024 0 1965806 61115 -1065897 0 Book Value Per Share Tier 1 Capital Shares Outstanding Average Total Assets 14.26 11.48474823 14.64 15.09 15.42 10.94319971 11.26765992 11.56426801 62119703 62181822 62244004 62306248 9,196,719.7 9,560,954.9 9,932,206.7 9,928,017.7
  • 14. Appendix 6 Earnings and Profitability Summary Ratios Q1 2012 Percent of Average Assets: 4.43 1.15 3.28 1.14 3.67 0.33 0.43 0.16 0.58 0.58 0.58 0.58 Interest Income (TE) - Interest Expense Net Interest Income (TE) + Noninterest Income - Noninterest Expense - Provision: Loan & Lease Losses Pretax Operating Income (TE) + Realized Gains/Losses Sec Pretax Net Operating Income (TE) Net Operating Income Net Income Adjusted Sub S Net Income Q2 2012 Q3 2012 Q4 2012 Postmerger 4.56 4.53 4.51 1.14 1.13 1.12 3.42 3.40 3.38 1.32 1.38 1.44 3.89 3.86 3.83 0.13 0.12 0.12 0.71 0.79 0.87 0.00 0.00 0.00 0.71 0.79 0.87 0.71 0.79 0.87 0.71 0.79 0.87 0.71 0.79 0.87 Appendix 7 Income Projections 30-Mar-12 30-Jun-12 30-Sep-12 30-Dec-12 *Dollar figures in thousands (Quarterly) (Quarterly) (Quarterly) (Quarterly) Total interest income Total interest expense Net interest income 101862 24848 77013 Provision for loan and lease losses Total noninterest income Total noninterest expense Pre-tax net operating income Securities gains (losses) Applicable income taxes Income before extraordinary items Extraordinary gains - net Net income attributable to bank 2909.839077 26225.39294 84300.47997 16028 0 0 16028 0 16028 135042 112622 111671 29137 28238 24959 105906 84384 86712 100.776549 1168.098043 1109.703384 38121.5478 34269.9941 35644.5951 115551.213 96005.24991 94925.94041 28577 21481 26321 0 0 0 0 0 0 28577 21481 26321 0 0 0 28577 21481 26321 Net income attributable to noncontrolling interests Net income attributable to bank and noncontrolling interests Cash dividends 0 0 0 0 16028 0 28577 0 21481 0 26321 0 Sale, conversion, retirement of capital stock, net Net operating income 16028 28577 21481 26321 0.26 0.46 0.35 0.42 Earnings per share
  • 15. Appendix 8 Peer Group Analysis FIRST MIDWEST BANK UMPQUA BANK MB FINANCIAL BANK, NA PRIVATEBANK AND TRUST CO. NATIONAL PENN BANK CITIZENS BANK BANNER BANK COLUMBIA STATE BANK UNITED BANKSHARES, INC Composite Capital Portfolio Financials Commercial Size Regional 3.81 4.83 3.54 2.55 4.52 4.29 4.60 3.72 4.33 2.75 2.77 4.93 4.04 4.75 3.70 4.59 2.73 3.03 3.79 4.74 4.62 3.60 4.50 3.04 2.58 4.3 3.80 4.81 3.58 4.81 2.55 3.23 3.43 4.58 3.74 3.52 3.70 2.45 3.14 3.48 4.97 4.44 3.50 4.74 3.44 2.75 4.15 2.17 4.64 3.36 4.91 2.9 2.55 4.26 2.34 4.14 3.48 4.55 3.01 2.99 3.43 3.84 3.91 Peer Group Analysis FIRST MIDWEST BANK UMPQUA BANK MB FINANCIAL BANK, NA PRIVATEBANK AND TRUST CO. NATIONAL PENN BANK CITIZENS BANK BANNER BANK COLUMBIA STATE BANK UNITED BANKSHARES, INC Weight 11.81% 11.53% 11.46% 11.17% 11.08% 10.90% 10.84% 10.41% 10.78% P/E 10.23 13.01 12.51 13.64 14.2 9.21 36.04 17.66 15.55 B/V 0.9 1.5 1.1 0.9 1.5 0.8 0.6 1.4 2.5 Ticker FMBI UMPQ MBFI PVTB NPBC CRBC BANR COLB UBSI Appendix 9 Regional Outlook Sterling Banner Citizens Bank Columbia First Midwest Santa Barbara Umpqua Susquehanna Iberia MB Financial National Penn Private Bank United Bank GDP Growth Unemployment Ranking 2.06% 9.47% 2.04% 8.78% 4.64 2.76% 9.90% 4.44 2.78% 8.47% 4.14 1.90% 10.10% 4.60 1.80% 11.30% 3.95 2.48% 9.55% 4.75 2.92% 7.81% 3.74 2.23% 8.10% 4.23 1.91% 10.08% 4.62 3.00% 7.89% 3.74 1.94% 9.73% 4.81 3.34% 8.57% 3.91 State IL OR IL IL PA MI WA WA VA Avg. Assets Net Income 8,033,595 50,245 11,597,279 58,125 9,884,447 20,483 12,329,198 51,821 8,575,566 71,045 9,429,809 -3,053 4,069,828 2,173 4,385,387 34,361 7,192,199 53,274
  • 16. Appendix 10 Financial Comparison Ratings Sterling/FIB Wght United Score Banner Score Columbia Score Earnings and Profitability Percent of Average Assets: + Noninterest Income 0.89 - Noninterest Expense 3.61 - Provision: Loan & Lease Losses 0.31 10% 10% 10% 10% 10% 10% 97.29 10% Interest Income (TE) 4.51 - Interest Expense 1.07 Net Interest Income (TE) 3.44 0.23 0.91 0.62 1.00 0.96 0.64 0.75 4.65 0.73 3.93 0.32 3.23 0.95 0.97 0.69 0.88 0.36 0.90 0.33 5.53 0.36 5.18 1.21 4.70 0.15 0.82 0.34 0.66 0.73 0.77 0.49 90.34 0.93 93.66 0.96 86.14 0.89 79.88 0.96 72.05 0.93 78.16 0.99 4.11 0.66 3.46 0.85 2.32 Margin Analysis: Avg Earning Assets to Avg Assets Avg Int-Bearing Funds to Avg Assets 77.07 Loan & Lease Analysis: 4.74 10% 1.36 0.29 2.51 0.53 6.00 0.79 Liquidity Net Non Core Fund Dep New $250M 21.60 5.64 Net Loans & Leases to Assets 61.42 10% 10% 70.03 0.26 0.88 6.27 72.54 0.29 0.85 0.31 58.43 0.01 0.95 10.01 0.91 11.60 0.95 11.21 0.98 -Total Capitalization Tier One Leverage Capital 11 2.99 4.55 Comparison Score Capital Score Financial Comparison Ratings Sterling/FIB Wght PVTB Score 2.75 4.74 Umpqua Score 2.55 4.91 MBFI Score Earnings and Profitability Percent of Average Assets: + Noninterest Income 0.89 - Noninterest Expense 3.61 - Provision: Loan & Lease Losses 0.31 10% 10% 10% 10% 10% 10% 97.29 10% Interest Income (TE) 4.51 - Interest Expense 1.07 Net Interest Income (TE) 3.44 3.93 0.49 3.45 0.54 2.07 1.10 0.87 0.46 1.00 0.61 0.57 0.28 4.42 0.61 3.81 0.41 2.64 0.63 0.98 0.57 0.90 0.46 0.73 0.49 4.02 0.59 3.43 1.54 3.09 1.51 0.89 0.55 1.00 0.58 0.86 0.20 96.33 0.99 88.57 0.91 87.55 0.90 89.00 0.87 82.01 0.94 80.37 0.96 Margin Analysis: Avg Earning Assets to Avg Assets Avg Int-Bearing Funds to Avg Assets 77.07 Loan & Lease Analysis: -Total Liquidity Net Non Core Fund Dep New $250M 4.74 10% 3.63 0.77 2.28 0.48 8.29 0.57 21.60 10% 13.06 0.60 9.46 0.44 13.05 0.60
  • 17. Net Loans & Leases to Assets 61.42 10% 72.89 0.84 55.27 0.90 57.29 0.93 9.89 0.90 9.53 0.87 10.09 0.92 Capitalization Tier One Leverage Capital 11 2.58 4.50 Comparison Score Capital Score Financial Comparison Ratings Sterling/FIB Wght Citizens Score 2.77 4.33 NPBC Score 3.03 4.59 FMBI Score Earnings and Profitability Percent of Average Assets: + Noninterest Income 0.89 - Noninterest Expense 3.61 - Provision: Loan & Lease Losses 0.31 10% 10% 10% 10% 10% 10% 97.29 10% Interest Income (TE) 4.51 - Interest Expense 1.07 Net Interest Income (TE) 3.44 4.40 0.97 3.43 0.83 2.84 1.75 0.98 0.91 1.00 0.94 0.79 0.18 4.31 0.94 3.37 1.06 2.58 0.20 0.96 0.88 0.98 0.84 0.72 0.65 4.19 0.39 3.80 1.14 2.90 0.77 0.93 0.37 0.91 0.78 0.80 0.40 95.50 0.98 92.65 0.95 88.91 0.91 86.57 0.89 82.37 0.94 81.37 0.95 Margin Analysis: Avg Earning Assets to Avg Assets Avg Int-Bearing Funds to Avg Assets 77.07 Loan & Lease Analysis: 4.74 10% 2.07 0.44 1.21 0.26 3.91 0.83 Liquidity Net Non Core Fund Dep New $250M 21.60 Net Loans & Leases to Assets 61.42 10% 10% 10.87 58.92 0.50 0.96 13.80 58.64 0.64 0.95 -5.88 63.26 -0.27 0.97 8.14 0.74 10.59 0.96 10.63 0.97 -Total Capitalization Tier One Leverage Capital 11 3.14 3.70 Comparison Score Capital Score Appendix 11 Projected EPS Target PE Ratio PE Weight PE Target Price Total Target Price $ $ 1.49 13.99 20% 20.85 19.46 Projected Book Target PBV Ratio Price BV Weight BV Target Price $ 15.42 1.24 80% 19.12 3.23 4.81 2.55 4.83
  • 18. Disclosures: Ownership and material conflicts of interest: The author(s), or a member of their household, of this report does not hold a financial interest in the securities of this company. The author(s), or a member of their household, of this report does not know of the existence of any conflicts of interest that might bias the content or publication of this report. Receipt of compensation: Compensation of the author(s) of this report is not based on investment banking revenue. Position as a officer or director: The author(s), or a member of their household, does not serve as an officer, director or advisory board member of the subject company. Market making: The author(s) does not act as a market maker in the subject company’s securities. Ratings guide: Banks rate companies as either a BUY, HOLD or SELL. A BUY rating is given when the security is expected to deliver absolute returns of 15% or greater over the next twelve month period, and recommends that investors take a position above the security’s weight in the S&P 500, or any other relevant index. A SELL rating is given when the security is expected to deliver negative returns over the next twelve months, while a HOLD rating implies flat returns over the next twelve months. Disclaimer: The information set forth herein has been obtained or derived from sources generally available to the public and believed by the author(s) to be reliable, but the author(s) does not make any representation or warranty, express or implied, as to its accuracy or completeness. The information is not intended to be used as the basis of any investment decisions by any person or entity. This information does not constitute investment advice, nor is it an offer or a solicitation of an offer to buy or sell any security. This report should not be considered to be a recommendation by any individual affiliated with [Society Name], CFA Institute or the CFA Institute Research Challenge with regard to this company’s stock.