1. Education for All 2004-09
Formative Research Project
Study Report
Longitudinal Study on System Indicators
Tribhuvan University
Research Centre for Educational Innovation and Development
2006
2. i
Study Team
Dr. Roshan Chitrakar Researcher
Mr. Raju Manandhar Associate Researcher
Mr. Rom Prasad Bhattarai Associate Researcher
Dr. Shreeram Prasad Lamichhane Resource Person
Mr. Shankar Thapa Resource Person
Mr. Sugam Bajracharya Resource Person
Mr. Yogendra Prasad Lekhak Research Assistant
Mr. Prabhakar Dhungel Research Assistant
Mr. Kamal Adhikari Research Assistant
Mr. Arjun Kumar Pandey Research Assistant
Mrs. Prativa Pradhan Research Assistant
Mrs. Anjana Rajbhandari Research Assistant
Mr. Amul Raj Uprety Research Assistant
Mr. Kashilal Chaudhari Research Assistant
Mr. Himal Kumar Uprety Research Assistant
Mrs. Chandra Badana Rai Research Assistant
Formative Research Project, CERID Project Advisors:
Project Coordinator: Dr. Kishore Shrestha Prof. Dr. Hridaya R. Bajracharya
Associate Researcher: Mr. Rom Prasad Bhattarai Dr. Shreeram P. Lamichhane
3. ii
Acronyms and Abbreviations
ADA Average Daily Attendance
BPEP Basic and Primary Education Programme
BS Bikram Sambat
CDC Curriculum Development Centre
CERID Research Centre for Educational Innovation and Development
DDC District Development Committee
DEO District Education Office(r)
DEP District Education Plan
DOE Department of Education
ECD Early Childhood Development
EFA Education For All
EMIS Education Management Information System
ETC Education Training Centre
FRP Formative Research Project
GER Gross Enrolment Rate
GIR Gross Intake Rate
ID Identity
INGO International Non-Governmental Organization
MOES Ministry of Education and Sports
NCED National Centre for Education Development
NER Net Enrolment Rate
NGO Non-Governmental Organization
NIR Net Intake Rate
PRD Promotion, Repetition and Dropout
PTA Parent Teacher Association
RED Regional Education Directorate
RP Resource Person
SIP School Improvement Plan
SLC School Leaving Certificate
SMC School Management Committee
SS School Supervisor
STR Student Teacher Ratio
TG Teacher’s Guide
TMIS Teacher Management Information System
VDC Village Development Committee
VEP Village Education Plan
6. v
TABLE OF CONTENT
Executive Summary..........................................................................................................iii
Acknowledgements ..........................................................................................................iv
CHAPTER I INTRODUCTION........................................................................................1
Context.............................................................................................................................1
Objectives ........................................................................................................................1
CHAPTER II STATUS OF INDICATORS......................................................................2
Primary School Completion Rate...............................Error! Bookmark not defined.
Transition Rate (from Primary to Lower Secondary) ............Error! Bookmark not
defined.
Number of school with ECD or Pre-School Program...............................................2
Percentage of New Entrants with ECD in Grade 1 ...................................................2
Student-Teacher Ratio ...................................................................................................3
Promotion, Repetition and Dropout Rates...............Error! Bookmark not defined.
Promotion Rates ...........................................................Error! Bookmark not defined.
Repetition Rates............................................................Error! Bookmark not defined.
Dropout Rates...............................................................Error! Bookmark not defined.
Internal Efficiency ........................................................Error! Bookmark not defined.
Per Student Classroom Space.....................................Error! Bookmark not defined.
Incentive Program and Beneficiaries...........................................................................3
Student Enrolment .........................................................................................................4
Enrolment Growth Pattern (1999-2005) ......................................................................5
Gender Parity..................................................................................................................5
Representation of teachers by Caste/ethnicity..........................................................6
Details of Grade 1 Cohort—Student Tracking...........................................................7
Learning and Achievement ..........................................................................................7
Teachers’ Qualification..................................................................................................8
Teachers’ Training Status..............................................................................................9
Teachers’ Attendance of Recurrent Teacher Training Program(s) .......................11
Temporary and Permanent License of Teaching.....................................................12
Per Student Expenditure.............................................................................................12
Expenditure on Major Headings................................................................................12
Schools’ Income and Sources......................................................................................13
Textbooks Availability.................................................................................................14
Availability of Teaching Resources ...........................................................................14
Availability of Library.................................................................................................15
Books and the Library .................................................................................................15
Preparation of SIP ........................................................................................................15
Classroom Conditions .................................................................................................15
Teachers’ Attendance...................................................................................................16
Daily Attendance of Students.....................................................................................18
Retention of Staff in Key Positions—Head Teacher................................................19
Formation and Training of SMC................................................................................20
School Visit by RPs, SSs and DEOs............................................................................20
Appendix 1 Additional Tables .......................................................................................22
7. vi
List of Tables
Table 1: Primary school completion rate ......................Error! Bookmark not defined.
Table 2: Transition Rate (from Primary to Lower Secondary)..Error! Bookmark not
defined.
Table 3: Student Teacher Ratio.........................................................................................3
Table 4: Promotion rates by grade, year and gender..Error! Bookmark not defined.
Table 5: Repetition rates by grade, year and gender...Error! Bookmark not defined.
Table 6: Dropout Rates by Grade, Year and Sex..........Error! Bookmark not defined.
Table 7: Internal Efficiency of Primary Education System.......Error! Bookmark not
defined.
Table 8: Per Student Classroom Space (in Square Feet) ............Error! Bookmark not
defined.
Table 9: Total number of students by incentive program (2001- 2005) ......................3
Table 10: Enrolment of Dalit and Muslim students (2002-2005)..................................4
Table 11: Enrolment Growth trends of Dalit and Muslim students (2002-2005).......4
Table 12: Gender parity index of teachers ......................................................................6
Table 13: Ethnic/caste representation in teaching profession (%)..............................6
Table 14: Representation of caste/ethnicity of head teachers (in %)..........................6
Table 15: Percentage of achievement score in various primary subjects by grade
and gender...................................................................................................................7
Table 16: Percentage of teachers with qualification ......................................................8
Table 17: Percentage of teachers with qualification in education (in %)....................9
Table 18: Percentage of teachers with teacher training certificate ..............................9
Table 19: Teachers with full training (in %)..................................................................10
Table 20: Female teachers in various training programs............................................10
Table 21: Teachers attending refresher training ..........................................................11
Table 22: Teachers with permanent license..................................................................12
Table 23: Proportion of expenditure on major headings............................................13
Table 24: Proportion of income by different sources ..................................................13
Table 25: Availability of different teaching aids (% of schools) ................................14
Table 26: Availability of library and reading space ....................................................15
Table 27: Types of books available in the library (%) .................................................15
Table 28: Construction and rehabilitation of classrooms ...........................................15
Table 29: Average Number of Teachers’ Attendant Days by Academic Year ........17
Table 30: Average daily attendance of teachers by month and academic year (in
%)................................................................................................................................17
Table 31: Average of Yearly Attendance of Students .................................................18
Table 32: Head teacher turnover in 5 years (2000-2004).............................................20
Table 33: SMC formed and trained................................................................................20
Table 34: Frequency of visits...........................................................................................20
Table 35: Learning Achievement by subject and grade in 2001 ................................22
Table 36: Learning Achievement by subject and grade in 2002 ................................22
Table 37: Learning Achievement by subject and grade in 2003 ................................22
Table 38: Learning Achievement by subject and grade in 2004 ................................22
Table 39: Percentage of Daily Attendance of Students in 2001..................................23
Table 40: Percentage of Daily Attendance of Students in 2002..................................23
8. vii
Table 41: Percentage of Daily Attendance of Students in 2003..................................23
Table 42: Percentage of Daily Attendance of Students in 2004..................................23
Table 43: Percentage of Daily Attendance of Students in 2005..................................23
List of Figures
Figure 1: Percentage of new entrants with ECD in Grade 1 ........................................2
Figure 2: Enrolment growth pattern................................................................................5
Figure 3: Gender parity index of students of primary grade.......................................5
Figure 4: Percentage of teachers with teacher training certificate.............................10
Figure 5: Percentage of daily attendance of Teachers.................................................16
Figure 6: Percentage of Annual Attendance of Teachers ...........................................17
Figure 7: Student attendance by grade .........................................................................19
9. 1
CHAPTER I
INTRODUCTION
Context
One of the two key components of the Formative Research Project on Education for All
2004-09 (FRP II) is Longitudinal Study on System Indicators and the other component
being the case studies. The longitudinal study has been designed to supplement the
project with statistical information on periodic progress of, as the title suggests, specific
indicators of EFA programs. It is an important component of FRP II which aims to bring
forth information relevant to the Ministry of Education and Sports (MOES), Nepal on
planning, implementation, monitoring and management of EFA 2004-09.
The information generated through the overall project activities of FRP II has provided
reference for regular monitoring of the planning and policy implementation as well as
provide insights/details regarding the issues and problems faced in the implementation
process. It is important for FRP II to provide MOES with two distinct kinds of research-
based information—(i) key issues and questions pertaining to planning, implementation
and management of EFA 2004-09 and (ii) regular periodic information on system
indicators.
It is in this context that the Longitudinal Study on System Indicators plays specific role, as
the other in-depth qualitative studies do. The system indicators study basically seeks
information that focuses on the “WHAT” aspects of program activities by using the
selected indicators, where as the in-depth studies focus on the “WHY”. In this sense, the
former, by and large, generates key research questions for the latter.
As in the first phase of FRP for BPEP II, the Longitudinal Study on System Indicators has
continued providing MOES periodic information on attainment of targets pertaining to
EFA 2004-09. The in-depth studies, on the other hand, have continued providing
qualitative information to support the findings of the System Indicators Study. The
system indicator information also serves the purpose of monitoring progress of EFA
programs.
Objectives
The specific objectives for this study are as follows:
1. To review and determine basic system indicators related to basic and primary
education II and EFA 2004-09.
2. To collect data on the basic system indicators as well as related information
periodically.
3. To make progress analysis on six major areas and related indicators of EFA 2004-
09.
4. To provide research-based information on Basic Indicators of EFA 2004-09 and
others which are necessary on a periodic basis to MOES for attainment of targets
pertaining to EFA 2004 -09
5. To help evolve improved data keeping system in schools and local level by
building capacity for the improvement of EMIS at school/local level
6. To suggest on reviewing program implementation strategies,
10. 2
0 .0
5 .0
1 0 .0
1 5 .0
2 0 .0
2 5 .0
1 9 9 9 2 0 0 0 2 0 0 1 2 0 0 2 2 0 0 3 2 0 0 4 2 0 0 5
B o y s G irls To ta l
CHAPTER II
STATUS OF INDICATORS
The necessary information has been gathered from 62 study schools of 16 sample districts
of Nepal. The analysis of the data is presented in this chapter.
Number of school with ECD or Pre-School Program
The government has a policy to increase participation of children in ECD education. In
this regard the school based and community-based early childhood development
programs would be continued and expanded during EFA Program 2004-2009. The policy
makes it clear that the responsibility to manage and operationalize ECD centers rests on
the local bodies whereas the pre-primary classes are the responsibility of the schools with
extensive community support and participation.
There are 24 schools (38.7%) out of 62 schools are running pre-primary program, 11 of
which are fully supported by the government, 11 are partially supported by the
government and 2 are running on the school’s own sources. As the policy of the
government on the ECD program, the expectation that such programs are managed by
the cooperation and participation of local communities is yet to become the reality.
Percentage of New Entrants with ECD in Grade 1
The government has set the target of expanding the ECD centres in the country to
provide pre-primary education to all the children. Basic and Primary Education Project
(BPEP) had given due recognition to the importance of and need for providing
opportunities of ECD program to children. There are several efforts have been made
through NGOs and INGOs for advocacy, to convey the message and persuade parents to
bring their children to ECD programs running either within the schools or separately in
the communities. The trend shows that the efforts have worked but only until 2003.
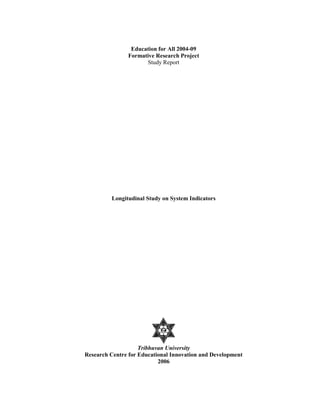
Figure 1: Percentage of new entrants with ECD in Grade 1
The rate of new entrants with ECD must show steady growth to ensure the participation
of ECD aged children. The growth is steady till 2001 from 1999 and a steep growth from
2001 t0 2003. The percentage declined in 2004 and further declined in 2005. The analysis
of the trend from 1999 to 2005 has raised some questions. The reasons behind the growth
11. 3
and downfall in different periods of the past seven years should be analysed for the
development of ECD.
Student-Teacher Ratio
The student teacher ratio has always been a burning issue for the government. In this
study the analysis has been done by considering only those teachers who are deputed
under the government quota. There are also teachers in the schools, who are hired by the
SMC from other sources, have not been accounted for analysis. There is no significant
pattern observed in student teacher ratio trend in the past four years. The ratio is
consistently lowest in mountain belt and highest in Tarai belt. The average student
teacher ratio is 40.3 in the year 2005 which is higher by 1.7 compared to the year 2004.
Table 1: Student Teacher Ratio
Student teacher ratio trends are analyzed
for year 2002 to 2005 by ecological belt and
in total. It was found that the student
teacher ratio is fluctuated among the
ecological belt in that period. The ratio
trends are seen very high in Terai about
(1:53) as per the National Plan of Action (NPA) of EFA has envisioned (1:30) student
teacher ratio as ideal for primary education. The scenario shows that the ratio is
manageable in Hill however there is a need careful intervention in mountain belt for
adequate ratio in primary level. Students' teacher ratio trends are analysed consistent in
valley although there is also slightly fluctuation in the trends. In this scenario national
trends for student teacher ratio is also not exist in EFA goal as national student teacher
ratio is consistent above (1:30) and variation about (1:40) in year 2005.
Incentive Program and Beneficiaries
The number of scholarship recipients has substantially increased in the year 2004 and
which has further increased in the year 2005 (Table 2). The increase in the number of
Dalits and girls receiving the scholarship is more encouraging in this year.
Table 2: Total number of students by incentive program (2001- 2005)
Scholarship
type
Dalit Girls Martyr's
Children
Primary Learning
Materials
Dress Poor and
Intellige
nt
Disabled Special
focus
group
Total Incentives
Distribution(Others)
Primary
LevelYear
Boy
Girl
Boy
Girl
Boy
Girl
Boy
Girl
Boy
Girl
Boy
Girl
Boy
Girl
Boy
Girl
Boy
Girl
Total
2001 205 160 178 - - 6 31 0 1 0 1 5 26 0 3 0 0 216 400 616
2002 249 278 101 - - 17 47 10 9 16 21 7 25 0 0 0 20 299 501 800
2003 76 73 3 - - 0 3 0 0 0 0 1 12 0 0 0 0 77 91 168
2004 776 715 894 - - 0 0 39 58 132 145 61 134 14 42 1 134 1023 2122 3145
2005 788 826 1255 11 37 1 32 0 1 76 38 58 84 95 87 28 55 1057 2415 3472
Total incentives 8153
Percent (%)
2001 94.9 40.0 44.5 2.8 7.8 0.0 0.3 0.0 0.3 2.3 6.5 0.0 0.8 0.0 0.0 35.1 64.9 7.6
2002 83.3 55.5 20.2 5.7 9.4 3.3 1.8 5.4 4.2 2.3 5.0 0.0 0.0 0.0 4.0 37.4 62.6 9.8
2003 98.7 80.2 3.3 0.0 3.3 0.0 0.0 0.0 0.0 1.3 13.2 0.0 0.0 0.0 0.0 45.8 54.2 2.1
2004 75.9 33.7 42.1 0.0 0.0 3.8 2.7 12.9 6.8 6.0 6.3 1.4 2.0 0.1 6.3 32.5 67.5 38.6
2005 75.3 34.7 52.8 1.0 1.5 0.1 1.3 0.0 0.0 7.3 1.6 5.5 3.5 9.1 3.7 2.7 2.3 30.5 69.5 42.0
100.0
Region /Year 2002 2003 2004 2005
Mountain 19.1 18.4 20.5 19.7
Hill 29.4 28.2 35.2 37.7
Tarai 42.5 42.9 53.2 53.0
Valley 24.7 22.8 31.4 26.6
Total 31.7 31.0 38.4 40.3
12. 4
Incentive program is positively taken through out the year 2001 to 2005 as the total
incentive distribution numbers and percent column clearly described the current
scenario. Overall 34.4 percent increment in incentive program implies a good
implementation in the incentive policy and program. Although the number of Dalit boys
receiving the incentives is higher than the base year scenario but the incentive receiving
percent for Dalit number has gradually decreased by 19.6 from the year 2001 to 2005. The
incentive program is much focused on girls as it can be seen in Table 2, that girls are
receiving the facility about 80 percent from the year 2001 and 2004 where as it crossed
about 85 percent in year 2005. Incentive distribution in other title is not interesting except
‘Disabled’ where the distribution rate is seen higher in the current year. It is interesting to
note that the percent of girls receiving such incentive is gradually increasing about 69.5
percent in previous years where as it is about 30.5 percent for boys.
Student Enrolment
The enrolment of dalit students in different grades has remarkably increased in the year
2005. Table 3 depict the number of enrolment of Dalit and Muslim students in year 2002
to 2005. The enrolment of Muslim students is higher in all grades and the number of girls
is encouraging in grade one. The enrolment pattern for boys and girls’ for Dalit and
Muslim shows that it is comparably high in grade 1 and 2 than other grade. There is very
much uniformity between the boys and girls enrolment pattern for Dalit where as girls
enrolment is high for Muslim.
Table 3: Enrolment of Dalit and Muslim students (2002-2005)
Grade 1 Grade 2 Grade 3 Grade 4 Grade 5 Total
Boy Girl Boy Girl Boy Girl Boy Girl Boy Girl Boy Girl Total
Dalit
2002 373 389 257 218 209 184 208 181 160 155 1207 1127 2334
2003 468 358 272 259 225 195 219 193 203 182 1367 1187 2554
2004 380 396 240 222 186 200 199 180 146 151 1151 1149 2300
2005 416 449 433 446 303 264 228 236 - - 1380 1395 2775
Muslim
2002 22 23 29 14 13 9 23 7 8 4 95 57 152
2003 56 38 40 31 39 30 28 18 31 28 194 145 339
2004 78 48 35 23 27 21 24 19 20 10 184 121 305
2005 184 237 80 43 45 33 33 23 - - 342 336 678
Dalit students’ enrolment growth trends analysis is done as considering the year 2002 as
base year. It indicates that the enrolment growth trend is about 18.9 percent through the
year 2002 to 2005. In this scenario Muslim students’ enrolment growth trends analysis is
also done as considering the same year 2002 as base year. It indicates that the enrolment
growth trend is about 346.1 percent through out the year 2002 to 2005. Girls' enrolment
growth trends is seen low about 17.5 percent for Dalit than 229.5 percent for Muslims. It is
due to high enrolment ratio 2334:152 between Dalit and Muslim in the base year trends.
Table 4: Enrolment Growth trends of Dalit and Muslim students (2002-2005)
Total Total
Boy Girl Total Boy Girl Total
Dalit Dalit
2002 1207 1127 2334 2002 100 100 100
2003 1367 1187 2554 2003 113.3 105.3 109.4
2004 1151 1149 2300 2004 95.36 102 98.54
2005 1380 1395 2775 2005 114.3 123.8 118.9
Muslim Muslim
13. 5
2002 95 57 152 2002 100 100 100
2003 194 145 339 2003 204.2 254.4 223
2004 184 121 305 2004 193.7 212.3 200.7
2005 342 336 678 2005 360 589.5 446.1
Enrolment Growth Pattern (1999-2005)
The student enrolment growth pattern shows a steep decline in all grades except in grade
one in 2005. Figure 2 shows that the enrolment has declined, however the declination is
not less than the base year 1999 for all grades except for grade 2.
Figure 2: Enrolment growth pattern
70.00
80.00
90.00
100.00
110.00
120.00
130.00
140.00
150.00
160.00
1999 2000 2001 2002 2003 2004 2005
Grade 1 Grade 2 Grade 3 Grade 4 Grade 5 Total
The enrolment had reached up to 150% in grade 5 in the year 2004 showing a continuous
growth since the base year. The trend of total students’ shows that there was increment
of student enrolment till the year 2001 and it was almost constant till the year 2004 and
dropped to almost equal to the base year in 2005.
Gender Parity
The participation of female teachers and girls in teaching learning has always been an
issue. The government have provided various incentives to increase the girls in school
system.
The gender parity of the students of primary grade has shown a positive growth in the
year 2004 and 2005 compared to previous years (Figure 3).
Figure 3: Gender parity index of students of primary grade
Gender Parity
0.80
0.85
0.90
0.95
1.00
1.05
1999 2000 2001 2002 2003 2004 2005
14. 6
The gender parity of teachers shows that there are more than 40% schools with GP index
more than 1.0.
The number female teachers are more than male teachers in the 62 sampled schools,
however the distribution across the schools is quite uneven and the gender parity index is
widely deviated (Table 5).
Table 5: Gender parity index of teachers
There are 5 schools without female teachers
in 2005. Similarly, the GP is less than 0.5 in
16 schools and 0.5 to 1 in same number of
schools.
Representation of teachers by Caste/ethnicity
The
Table 6: Ethnic/caste representation in teaching profession (%)
Caste/ 2002 2003 2004 2005
Ethnicity Male Female Total Male Female Total Male Female Total Male Female Total
N=211 N=195 N=406 N=211 N=204 N=415 N=210 N=216 N=426 N=212 N=219 N=431
Muslim 1.8 0.0 0.9 0.6 0.5 0.6 3.0 0.5 1.6 2.9 1.4 2.1
Dalit 6.6 2.8 4.7 7.3 3.2 5.1 2.4 2.0 2.2 2.4 0.0 1.2
Janjati 24.1 25.3 24.7 25 23.8 24.4 26.8 21.0 23.6 27.8 24.7 26.2
Other 67.5 71.9 69.8 67.1 72.5 70.0 67.7 76.5 72.5 67.0 74.0 70.6
The Muslim and Dalit representation in the teaching profession has remained extremely
low let alone its comparison with the compositions and proportion of these caste groups
in the national population (5% Muslim and 20% Dalits). Janajatis have been represented
by almost one-quarter of the teachers. However it should not be forgotten that
population of Janajaties constitutes almost as much proportion as that of the Brahmins
and Chhetries (39.2% compared to 39.4% Brahmin/Chhetries) (Census 2001). Therefore,
the teaching profession, as seen in the 2004 data of the 62 sampled schools (Table 6), is
still predominantly represented by Brahmins and Chhetries (73%).
Ethnic representation in teaching profession trend is analyzed by given four major ethnic
variables such as Muslim, Dalit, Janjati and others. Muslim teacher trends through out the
year 2002 to 2005 are very low in comparable to other ethnic variables. Where as Dalit
teacher trends is seen decreasing in that period but Janajati teacher trends is consistent
and to some extent increasing. In this scenario brahimin and chettri which belongs to
other variable is highly dominated in teaching profession trends.
The case of head teachers is as disappointing as that of the teachers. The representation
of Dalit which used to be almost 9% in 2002 has reduced to less than 2% in 2004 ( Table
7). Moreover, no Muslim has ever become a head teacher in the 62 sampled schools in
the three years between 2002 and 2004.
Table 7: Representation of caste/ethnicity of head teachers (in %)
Ethnicity/ 2002 2003 2004 2005
caste Male Female Total Male Female Total Male Female Total Male Female Total
Gender parity
index
2004 2005
N % N %
Less than 0.5 22 35.48 16 25.8
0.5 to 1.0 15 24.19 16 25.8
More than 1.0 21 33.87 25 40.3
Only female teacher 4 6.45 5 8.1
Total 62 100.00 62 100.0
15. 7
Dalit 8.9 0.0 6.5 2.2 0.0 1.6 2.2 0.0 1.6 2.1 0.0 1.6
Janjati 13.3 41.2 21 17.4 37.5 22.6 17.4 43.8 24.2 16.7 30.8 19.7
Others 77.8 58.8 72.6 80.4 62.5 75.8 80.4 56.3 74.2 81.7 69.2 78.7
Total 75.8 24.2 100 74.2 25.8 100 74.2 25.8 100 78.6 21.4 100
The percentage of Janajati as the head teacher has decreased over the years 2005. Women
who constitute more than half of the national population are represented in the
leadership role at the primary level are about 21.4 percent over the years. This proportion
remained almost stagnant in the years 2002 through to 2004 and varied in the year 2005.
On the whole, Table 7 clearly reveals that the representations of women, Dalit,
Muslim and Janajati in the primary school leadership are far too short from being
proportionate to the population composition of the nation.
Details of Grade 1 Cohort—Student Tracking
The 3-year cohort analysis by tracking individual children of the 62 sampled schools is
on-going—100% coverage is not possible as systematic official identification number of
primary school children is not available that has caused tracking difficulty in the
successive academic years. The DOE has been working on assigning such number to
every primary school child which the study is supposed to use. Since the process has
taken longer time than expected, we have now assigned a 10-digit ID number to each
student. Because of the absence of such ID in the previous years, there has been difficulty
tracking more than 50% children listed in the base year. It is expected that with the
establishment of the school based EMIS this problem will be resolved in the coming
years.
The other problem encountered in analyzing the cohort data is that crucial data e.g. of
promotion, repetition, dropout, and learning achievement of more than 50% students are
left unreported in the questionnaire forms. As already mentioned in the earlier section,
more than 20% PRD data of students in the 2004 individual child-data record forms
(Long SIS form no. 2) are missing in 35 of the 62 sampled schools. It is a clear indication
of the lack of schools’ ownership of the school data. Research assistants’ visit to schools
for the purpose of collecting the data does not prove effective, especially when they are
required to make regular and frequent visits.
This raises a serious question of reliability and validity of the data provided by the
schools. In view of this, it is agreed among the key stakeholders of the FRP, that a more
institutionalized approach to data generation, analysis and reporting should be initiated
by the Longitudinal Study. This led the study to plan and organize data collection and
capacity building workshops on school-base EMIS for school representatives and other
local stakeholders. This new strategy that the study has taken as of 2004 is expected to
address the problem of data quality.
Learning and Achievement
As usual the examination score in key primary subjects have been analyzed to make a
sense about the extent to which children’s learning achievements have progressed over
the years. The achievement scores of Nepali and Mathematics of Grade 1 and 3 and also
English and Environment and Health of Grade 5 is analysed in the study.
Table 8: Percentage of achievement score in various primary subjects by grade and gender
Year
Grade 1 Grade 3 Grade 5
Nepali Math Nepali Math Nepali Math English Env.&
16. 8
Health
Boys Girls Boys Girls Boys Girls Boys Girls Boys Girls Boys Girls Boys Girls Boys Girls
2001 35.0 34.6 38.4 36.1 38.2 37.4 38.4 35.3 26.9 28.0 23.1 22.5 25.6 25.8 28.4 29.3
2002 39.6 41.2 39.2 39.1 43.1 42.7 38.9 37.4 30.6 31.1 26.8 24.9 28.7 27.9 32.6 30.9
2003 34.8 35.5 35.9 35.1 39.8 40.8 37.4 36.0 30.6 31.6 27.1 25.7 30.2 29.8 32.8 32.6
2004 32.3 33.0 33.7 32.8 38.5 40.7 36.5 35.4 31.5 32.7 28.3 26.9 32.1 31.7 33.9 34.3
2005 45.7 45.8 49 48.3 48.92 51.53 48.25 45.64 100 77.27 55.4 59.5 50.9 70.2 88.8 54.5
Table 8 depicts that achievement scores across all the subjects have not shown tangible
progress over the years. Similarly scores of boys and girls also do not show any
interesting gender-wise variation in all the subjects in the past 4 years. The scores
suggest that the average boys and girls tend to maintain the required marks for them to
pass all subjects, except in Grade 5 Math, but in none they have demonstrated any
outstanding achievement (the scores are mostly below 40% achievement level). The
below pass mark average score in Grade 5 Math has persisted for both boys and girls
since 2001, while that in English has shown slight improvement.
Teachers’ Qualification
Under-qualification of primary school teacher is no longer an issue as the data of 2004
clearly show more than 85% primary school teachers in the 62 sampled schools have
academic qualification higher than SLC. More pertinent issue to explore now is whether
SLC alone is sufficient for a person to be qualified and eligible to take up the position of
primary school teacher. Interestingly 5% of primary teachers (2004 data) in the 62 schools
have BEd degree. If a BEd degree is an unrealistic expectation of the qualification of
primary school teachers when should this be expected realistically? What implications
are there if this “ambitious” qualification requirement is to be operationalized? Again
these are the issues that are outside the scope of the Longitudinal Study on System
Indicators.
Table 9: Percentage of teachers with qualification
Year Under SLC SLC Intermediate Bachelor
M F T M F T M F T M F T
2002 1.9 6.7 4.2 52.1 54.9 53.6 31.8 26.2 29.1 9.5 2.6 6.2
2003 1.0 8.0 4.5 54.6 51.8 53.2 30.2 23.6 27.0 8.8 3.0 5.9
2004 2.0 4.8 3.4 53.2 51.7 52.4 30.2 26.3 28.3 6.8 2.4 4.6
2005 1.9 3.3 2.6 50.2 50.5 50.4 31.6 28.5 30.0 7.7 3.3 5.4
Qualification of primary school teachers has remained a key issue that, to a large extent,
determines the quality of teaching. The official minimum qualification is SLC, which in
itself is far too low from the point of view of promoting quality teaching. The
government’s initiative is yet to be seen in terms of formulating policy of increasing the
minimum qualification and coming up with the strategy and target to realize such policy.
The reality on the ground is that even in 2004 more than 3% teachers are still under-SLC.
It is also equally disappointing that majority of teachers who were only SLC in the
previous years have not updated their qualification. Percentages of teachers with
qualification of Intermediate or Bachelor’s degree have remained small and stagnant over
the years, which is another disappointing scenario (see Table 9). These percentages
would not increase significantly without a progressive policy support—higher academic
qualification (at least higher secondary, preferably graduate degree) complemented by
raised status and recognition of primary school teachers.
Teachers' qualification is analyzed through out the year 2002 to 2005. It is reveal in the
table 5 that still 50 percent of staff belongs to SLC certificate. It is also noticeable that
17. 9
under SLC qualified and SLC qualified teachers' are gradually decreasing through out
year where as the decreasing trends for under SLC and SLC are about 0.8 percent and 2.0
percent in the year 2005. In this scenario intermediate and Bachelor level is slightly
increased about 1.7 percent and 0.8 percent.
Table 10: Percentage of teachers with qualification in education (in %)
Year I. Ed. B. Ed. M. Ed.
M F T M F T M F T
2002 1.0 5.6 3.2 3.8 3.6 3.7 0.0 0.5 0.2
2003 1.5 7.5 4.5 3.9 5.5 4.7 0.0 0.5 0.2
2004 1.5 9.1 5.3 6.3 3.8 5.1 0.0 0.5 0.2
2005 2.4 8.4 5.4 5.7 4.7 5.2 0.5 0.5 0.5
It is interesting to note the number of teachers with MEd Degree has not increased in the
past three years. There is only on female teacher and no male teacher in 62 sample
schools who has this degree. However, teachers with BEd Degree have increased from
3.7% in 2002 to 5.1% in 2004. The increase in female percent which had been drastic in
2003 has been out numbered by male in 2004 (see Table 10).
Teachers with qualification in Education are seen very low. Table 6 reveals that the
percentage of teachers with I.Ed qualification represents only 5.7 percent in the total 62
sample school. The percentage of B.Ed qualification represents only 5.2 percent and 0.5
percent for M .Ed qualified teachers. Among that females’ trends are seen high than male
in I.Ed and M.Ed where as for both group their trends are fluctuated in case of B.Ed.
Teachers’ Training Status
The National Centre for Education Development (NCED) is the responsible government
department to ensure that all the primary school teachers are fully trained. Training
plays critical role in all professions. In the case of the Nepalese primary school teachers,
majority of whom have a maximum of SLC level of academic qualification, it is all the
more important for them to invest adequate time to learn how to teach. NCED offers a
10-month training program packaged into 3 phased multiple modes modules— 1st phase
of 2.5 months through face-to-face mode, 2nd phase of 5 months through distance mode
and 3rd phase of 2.5 months through face-to-face mode. Teachers are certified after the
completion of each phase of the training program.
Table 11: Percentage of teachers with teacher training certificate
Year Male Female Total
2002 41.6 44.4 43.0
2003 60.0 56.1 58.1
2004 90.6 91.0 91.0
2005 88.5 95.1 91.4
A clear progress is depicted in the number of primary teachers in the 62 sampled schools
who have been through part or all of the 10-month training program offered by NCED.
The change in the percentage of primary school teachers with teaching certificate is very
drastic in the year 2004 with a jump of more than 30% point within one year (see Figure
4).
The percent of this category of teachers had reached 58% in 2003 from 43% in 2002 and
91% in 2004 (see Table 11). The 2004 data reveal that the difference in the proportions of
male and female teachers having the certificate is extremely low compared to the former
18. 10
years. The rapid rise in the trend of teacher-percentage having the certificate in the three
years since 2002 could be due to the government policy of mandatory teaching certificate
for primary school teachers. The rapidly increasing trend of certified primary school
teacher suggests that the government plan of achieving 99% licensed teachers by the end
of 2009 would be fulfilled conveniently.
Table 12: Teachers with full training (in %)
Table 20 depict the increasing trends of teachers with full training percent over the years.
It can be seen that almost 27.7 percent increased of teachers with full training percent
during 4 years period. In this scenario female teachers are seen more empowered about
57.2 percent.
Figure 4: Percentage of teachers with teacher training certificate
Percentage of Teachers with Teacher Training Certificate
43.0
58.1
91.0
0.0
10.0
20.0
30.0
40.0
50.0
60.0
70.0
80.0
90.0
100.0
2002 2003 2004
The number of female teachers who have been offered training opportunities of different
modalities in 2002 and 2003 has increased by almost one-third in 2004 (Table 13). The
apparent encouragement that women have received in teaching job and training can be
expected to have the impact needed to bring more girls to primary schools.
Table 13: Female teachers in various training programs
Training type 2002 2003 2004 2005
N % N % N % N %
I.Ed 10 5.2 15 7.7 19 8.8 23 5.5
B.Ed. 7 3.6 11 5.6 8 3.7 22 5.3
M.Ed 2 1.0 1 0.5 1 0.5 2 0.5
150 Hrs Training 66 33.7 31 15.1 26 12.0 36 8.4
First Package Training 10 5.1 14 6.8 14 6.5 53 12.4
Second Package Training 15 7.7 6 2.9 12 5.6 52 12.1
Third Package Training 25 12.8 33 16.1 113 52.3 29 6.8
Complete Training 52 26.5 61 29.8 132 61.1 238 55.6
Total 187 172 325 428
Year Male Female Total
2002 22.8 35.9 29.1
2003 35.7 42.9 39.3
2004 41.9 52.3 47.2
2005 42.8 57.2 56.8
19. 11
Training type
2002 2003 2004
N % N % N %
IEd 10 7.3 15 12.6 19 10.2
BEd 7 5.1 11 9.2 8 4.3
MEd 2 1.5 1 0.8 1 0.5
150 Hrs Training 66 48.2 31 26.1 26 14.0
Training packages I, II & III 52 38.0 61 51.3 132 71.0
Total 137 100.0 119 100.0 186 100.0
It is very interesting to analyze the situation for female teachers’ scenario in various
training programs. The number of female teachers are increasing very positively where as
the percentage of female teachers is low in compare to the numbers for various
qualifications. The number of female participation in 150 hrs training is decreasing
through out the year 2002 to 2005. Female participation in first and second package
training is impressively high about 53 and 52. Where as female participation is fall down
in third package training about 45.5percent. In this scenario female participation trends
in complete training is high in numbers and decrease about 4.5 percent in the current
year.
The percentages of teachers with full training have risen from 29.1 (35.9% female) in 2002
to 39.3 (42.9% female) in 2003 and 47.2 (52.3% female) in 2004. The proportion of fully
trained female teachers remained higher than male teachers (Table 12). According to the
NCED database, in July 2006 there are 78,078 teachers (23% female) in all the primary
schools across the nation (NCED TMIS 2006). NCED has set a target of imparting full
training to 34,432 (44%) teachers by 2005/06. In the context of this target, the progress
observed in the training status of the teachers of the 62 sampled schools of the
Longitudinal Study in 2004 is up to the mark and indicative of the possibility that the
government target would be met without any problem.
The question now should be directed towards assessing the effectiveness of the training.
In other words, the impact should be reflected in the learning achievements of the
students which unfortunately do not show the progress (see Table 8) that is anywhere
near at par with that of the percentage increase in the number of trained teachers.
Quality and appropriateness of training, therefore, has remained to be a serious issue that
seeks further exploration.
Teachers’ Attendance of Recurrent Teacher Training Program(s)
There is a clear decline of the number of teachers attending the recurrent training in 2004
(Table 14). Only 86 (21%) of the over 400 teachers from the 62 sampled schools attending
such training in 2004. The percentage of female teachers attending the refresher training
in the same year is even smaller (19%). This scenario suggests that recurrent training is
not a priority for NCED compared to the packaged modules of 10-month (2.5+5+2.5)
training.
Table 14: Teachers attending refresher training
Year Male Female Total
N % N % N %
2001 45 21.5 48 24.5 93 23.0
2002 55 26.2 58 28.3 113 27.2
2003 52 24.8 53 25.9 105 25.3
2004 45 21.7 41 19.4 86 20.6
2005 33 21.3 37 27.2 70 24.1
20. 12
Temporary and Permanent License of Teaching
The government has provided temporary teaching license to all the teachers of the
country. It was found that all the teachers except those appointed by the schools with
their own resources or the teachers paying voluntary service were holding temporary
license.
The government has the provision in 2002 to provide permanent teaching license to the
teachers who fulfil certain criteria. In this context, an increasing trend is revealed in the
number of teachers with permanent teaching license since 2002. It has increased to 108
(26%) in 2003 from 6 (1.5%) in 2002. In 2004 a total of 283 (66%) teachers out of 415 from
the 62 sample schools have been holding the permanent teaching license (Table 15).
Table 15: Teachers with permanent license
Year Male Female Total
N % N % N %
2002 1 0.5 5 2.55 6 1.5
2003 54 25.7 54 26.3 108 26.0
2004 139 66.2 144 66.7 283 66.4
2005 169 84.9 167 83.1 336 84.0
Per Student Expenditure
The expenditure per student in primary education shows an increasing trend. Although
the increases are not very drastic, the trend at least proves that primary education has
remained government’s priority sub-sector. There has been an increase of Rs. 11.19 (from
Rs. 2390.95 to Rs. 2402.14) in the per student expenditure within one year between 2002
and 2003. The figure stands at Rs. 2260.2 in 2004 which is a decrease of Rs. 141.9 from the
expenditure in 2003.
Years Per Student Expenditure Per Student
Expenditure Trends
2002 2390.95 100.0
2003 2402.14 100.5
2004 2260.20 95.0
2005 2486.00 104.0
The expenditure per student in primary education shows a little increasing trend.
Although the increases are not very drastic, the trend at least proves that primary
education has remained government’s priority sub-sector. There has been an increase of
0.5 percent expenditure in year 2003 where as it is decreased by 5 percent in year 2004.
Altogether the fluctuation is removed and improved by 4 percent in year 2005. In total 4
percent increment over the period can not be satisfactory for development process.
Expenditure on Major Headings
The positive sign revealed by the increase in the non-salary recurrent cost in 2003 could
not be retained in 2004. Teachers’ salary absorbed 74.2% of the expenditure leaving only
16.4% in non-salary recurrent cost and 9.1% in capital from the total expenditure of the
school (Table 16). Unless the allocation and expenditure for creative pedagogical purpose
is increased appropriately, quality of primary education is bound to suffer.
21. 13
It is also revealed that the average total expenditure per school also shows a decreasing
trend. It has decreased significantly in the fiscal year 2003/04 by almost 21% compared to
the expenditure in the fiscal year 2001/02 (Table 16).
Table 16: Proportion of expenditure on major headings
Year
Teachers’
Salary(%)
NonSalary
Recurrent
costStaff
Salary(%)
Capital(%)
Average
Expenditur
eTotalper
school
2001/02 79.5 17.3 3.2 Rs. 507797.4
2002/03 71.9 18.3 9.8 Rs. 501889.2
2003/04 74.5 16.4 9.1 Rs. 401891.2
2004/05 70.9 21.6 7.4 Rs. 433600.2
Note: only 42 pure primary schools are included for the analysis. Like wise 2 primary school’s is missing in 2005 in Teachers Salary
title.
Table.6 shows that the recurrent cost is in increasing trends except there is declined in
year 2003/04. Even the average expenditure total per school is less in year 2003/04 where
as it is again improving in year 2004/05. Teacher’s salary is also declined near by 3.5
percents. It indicates that the improvement in recurrent cost and decrement in teacher’s
salary would help in quality of primary education.
The non-salary recurrent costs are spent on administrative, stationary, maintenance,
scholarships, sports and others purposes. There are high variation analyzed among the
total primary school responded and their expenditures.
The non-salary recurrent costs are spent on administrative, stationery, maintenance,
scholarships, sports and other incidentals purposes. According to 2004 data 51% schools
spend less than rupees 1700 annually for stationery and almost 53% spend Rs. 800 to
11,000 for administrative purposes. There are also 10 schools (15%) that spend Rs. 13,000
to 31,000 on stationery alone. The expense on maintenance ranges from Rs. 840 to 18,757
for 52% schools. Similarly 50% schools spend less than Rs. 10,000 (ranging from 250) per
annum for scholarships, which is an increase from Rs. 1900 only in 2002, and the same
proportion of school spend less than Rs. 1800 in the entire year on sports.
Schools’ Income and Sources
The sources of income for the schools have not changed drastically in 2004, except that
the government has taken increased financial responsibility—an increase of almost 11%
point increase from the previous year. The share of income from local bodies
(VDC/DDC/Municipalities) has reduced to 0.5% from 2.8% in 2003 and 5.8 in 2002,
which is not a good sign in terms of the widely accepted view that management and
ownership of primary schools be localized. With the growing expectation that the village
education plan forms the main basis for funds allocation to primary schools, the
DDC/VDC or municipality should have been the proper channel of fund flow to school,
meaning that the share of income from the local body should have been the major source.
Table 17: Proportion of income by different sources
Year
Nepal
GovernmentAid
DDC/VDC/Mun
icipality
AidbyOther
Organisation
OwnSourceof
School
Contributionby
Local
Community
ParentalSupport
(StudentFees)
Others
2002 67.1 5.8 1.2 3.2 4.1 13.0 5.8
22. 14
2003 78.9 2.8 1.0 1.5 1.3 6.7 7.7
2004 89.8 2.3 2.2 1.2 1.6 0.5 2.4
2005 85.4 0.7 1.4 2.4 1.0 5.5 3.6
The percentage of income as aid by other non-governmental organisations has however
increased to 2.2% in 2004 from 1.2 in 2002 and the contributions from individuals has
decreased from 7.7% in 2003 to 2.4% in 2004. It is also interesting to note that student’s
fee contributed 13% of total income of a school in 2002 which has a significant decline in
the preceding years to 0.5% in 2004 (Table 17).
The contribution of Local community towards school and school’s own source in the
income of the schools has also has a significant declination in the years.
The source of income for the schools is mainly depending upon the government aid to
them. There is reduced of government aid in year 2005 by 4.4 percent. There is gradually
decrease in income contributed by local bodies such as DDC/VDC/Municipality. Which
is not a good sign in terms of the widely accepted view that management and ownership
of primary schools be localized? With the growing expectation that the village education
plan forms the main basis for funds allocation to primary schools, the DDC/VDC or
municipality should have been the proper channel of fund flow to school, meaning that
the contribution of income from the local body have been the major one.
The contribution of non-governmental organizations is almost consistent in the respective
year 2002/05 except in year 2004. The contribution of schools own sources are gradually
picking up the increasing trends after wards year 2003 to 2005.
The contribution of local community towards school income has a significant declination
in the years.
It is interesting to note that contribution from students’ fees and individuals’ are
positively seen as it increased by 5.0 percent and 1.2 percent in the year 2005.
Textbooks Availability
It has been revealed that the problem of weak textbook delivery mechanism in 2002 and
2003 has persisted in 2004 as only 37.8% of students received the textbooks in 2 weeks
after the academic session began. The government’s policy of involving the private sector
in the production and distribution of textbooks is yet to be effectively implemented.
The availability of textbook in primary level varies for all level. It is indicated by year
2005 data that at least 25 percent grade 1 students received the textbook on time where
other grades gradually lacking in availability of textbook on time. Grade 2 textbook
responded by 11.7, grade 3 responded by 12 percent and grade 4 textbook responded by
9.2 percent.
Availability of Teaching Resources
Table 18: Availability of different teaching aids (% of schools)
Year
Curriculum
Subject
Elaboration
Curriculum
Directives
Teacher's
Guide
Reference
Books
2002 98.3 96.7 95.0 98.3 95.0
2003 96.6 94.8 94.8 94.8 93.1
2004 96.8 91.0 80.6 90.2 91.9
2005 95.2 90.3 83.9 95.2 87.1
23. 15
The trend observed in respective year is still continued in the year 2005. More than 90
percent schools have not experienced any problem of availability of the various teaching
aids in the school, except the curriculum directives and reference books.
The remarkable trend observed in 2002 and 2003 in terms of the availability of various
teaching aids has continued in 2004. More than 90% schools have not experienced any
problem of availability of the various teaching aids in the school, except the curriculum
directives.
Availability of Library
More and more schools are setting up libraries and reading rooms available for students.
As a result, in 2004, 56.5% of the 62 sampled schools have the library facility, a rise from
51.6% in 2003 and 35.5% in 2002. Over the years, more schools are also making effort to
provide separate rooms either for the purpose of library or reading room for students.
Table 19: Availability of library and reading space
Facilities
2002 2003 2004 2005
N % N % N % N %
Total Number of Schools 62 100.0 62 100.0 62 100.0 62 100.0
Number of Libraries 22 35.5 32 51.6 35 56.5 35 56.5
Library Rooms 8 12.9 11 17.7 13 21.0 14 22.6
Reading Space 8 12.9 11 17.7 10 16.1 10 16.1
Books and the Library
It is important to notice that the textbook materials have been added about 3.2 percent in
current year 2005. The school libraries are found to have different types of books for the
students as well as for teachers including textbooks and reference materials (Table 20).
Table 20: Types of books available in the library (%)
Type 2002 2003 2004 2005
Textbooks 23.3 34.2 29.7 32.9
Reference Books 55.3 31.5 22.5 21.3
Others 13.0 28.4 47.8 45.8
Materials for Teachers 8.4 6.2 - -
Total 100.0 100.0 100.0 100.0
Preparation of SIP
In 2004, out of the 62 sampled schools 60 have responded to the question whether they
have prepared the SIP. Of the 60 schools 56 (93%) reported to have prepared SIPs and 4
did not. 52 (92%) schools claimed that the SIPs were implemented as planned.
SIP Prepared SIP Implemented
Yes 55 88.7 24 38.7
No 3 4.8 11 17.7
Total 58 93.5 35 56.5
Missing 4 6.5 27 43.5
Total 62 100.0 62 100.0
Classroom Conditions
Table 21: Construction and rehabilitation of classrooms
Year Plans for classroom No. of schools No. of rooms
24. 16
(Ref. SIP) Planned Progress
2002
Construction 12 37 21 (56.8)
Rehabilitation 13 36 19 (52.8)
2003
Construction 9 24 5 (20.8)
Rehabilitation 15 40 38 (95.0)
2004
Construction 17 36 28 (77.8)
Rehabilitation 20 58 34 (58.6)
2005
Construction
Rehabilitation
Figures within the parentheses are percentages
According to the school improvement plans prepared by the schools about 20 to 32% of
the sampled schools wanted to construct and/or rehabilitate classrooms for 2002, 2003
and 2004. As Table 21 clearly presents, the progress against the planned numbers of
construction and rehabilitation of classrooms ranges from 28% to 78% in the case of new
construction and 53% to 95% in the case of rehabilitation. The average discrepancy
between the plans and actual progress in regards to the new construction and/or
rehabilitation of classrooms for the period 2002-2004 is 39.7% which is a serious issue of
poor performance.
Teachers’ Attendance
The overall trend of the attendance of teachers is not very encouraging. The attendance
percentage dipped to its lowest point of 82.4% in 2003 when compared with the data of
the four successive years since 2001. Although the average percentage of teacher
attendance is quite high in all the years there raises a question; why do teachers remain
absent and who should be held accountable? This can be an interesting question for
further exploration.
Figure 5: Percentage of daily attendance of Teachers
93.03
86.27
82.36
87.81
76.00
78.00
80.00
82.00
84.00
86.00
88.00
90.00
92.00
94.00
2001 2002 2003 2004
25. 17
Figure 6: Percentage of Annual Attendance of Teachers
Annual Attendance of Teachers
93.03
86.27
82.36
87.81
80.00
70
75
80
85
90
95
2001 2002 2003 2004 2005
Year
AttaindencePercentage
According to Figure 5, the average number of days that teachers have attended the
school, which had gone down in 2003, has been regained in 2004, but not in the case of
those from municipality schools.
The decreasing trends of annual attendance of teachers in percent is not interesting one
for such quality primary education system. Although the annual attendance percent is
about at least 80 percent cut off points it should be decreased gradually if such absentee is
not control.
The average numbers of teachers’ attendant days is fluctuated through out the year 2003
to 2005. Where as it gradually increased in year 2001 to 2002. ?????
The attendance rates of teachers from schools in the VDCs, which used to be lower than
in schools in the municipalities, have out numbered that of the schools in the
municipalities.
Table 22: Average Number of Teachers’ Attendant Days by Academic Year
Location 2001 2002 2003 2004 2005
Municipality 215 217 205 198 182
VDC 216 205 188 208 192
Total 216 212 197 202 189
Teachers’ average monthly attendance percentages are also analyzed and presented in.
The figures in the table reveal, among other things, teachers regularity and their
availability at the school more than 80% of the total number of school days per month.
The monthly averages in the 4 years between 2001 and 2004 do not actually depict any
consistent pattern. The lowest attendance in 2001 and 2002 is in Ashadh. In 2003 it is in
Falgoon and in 2004, it is Baishakh. The percentage does not take into account teachers’
absence in the school in lieu of e.g. their participation in training programs.
Table 23: Average daily attendance of teachers by month and academic year (in %)
Year
Baishakh
Jestha
Ashadh
Shrawan
Bhadra
Ashwin
Kartik
Mangsir
Poush
Magh
Falgoon
Chaitra
Total
2001 93.4 91.5 77.4 97.4 92.1 95.9 84.2 94.3 91.2 96.1 92.5 97.3 93.0
2002 83.7 85.0 80.4 91.8 86.7 84.6 87.3 88.9 86.7 85.8 85.3 88.3 86.3
2003 76.3 83.5 79.0 88.8 84.9 83.9 79.7 82.9 87.6 80.7 72.1 84.6 82.4
26. 18
2004 82.4 84.5 85.2 83.1 90.3 88.5 85.8 87.8 89.6 87.8 87.8 85.7 88.5
2005 83.9 79.7 87.7 71.9 85.8 89.3 78.6 77.2 82 78.6 70.3 74.2 79.9
Daily Attendance of Students
Student’s monthly attendance remained almost unchanged in the four years between
2001 and 2004 (see tables in the Appendix). The problem of absenteeism which appears
to fluctuate around 30% on the monthly basis needs be addressed if the pupils are to
optimize the benefit of schooling. The average yearly attendance days of students has a
significant fall from 156 days in 2001 to around 128.9days in 2005 (Table 24).
Table 24: Average of Yearly Attendance of Students
The decreasing trend of student attendance persisted in 2004. The attendance rate of
schools of Municipalities has not improved too.
Table12 Grade wise Growth trends of Students attendance by year 2001 to 2005
2001 2002 2003 2004 2005 Changes
Grade 1 100 102.0 100.2 104.4 96.6 -3.4
Grade 2 100 99.3 107.3 95.0 125.1 25.1
Grade 3 100 98.8 113.9 94.7 120.7 20.7
Grade 4 100 93.7 108.5 94.0 89.3 -10.7
Grade 5 100 108.2 118.4 100.8 105.1 5.1
Considering the year 2001 as base year attendance by all grades 1 to 5, the growth trends
of students’ attendance are analyzed up to year 2005. It is clearly indicated that grade 1
and 4 are seen decreasing in the current year. The trends for grade 1 is slightly increasing
up to year 2004 but it was fall down about 3.4 percent in year 2005 where as in grade 4
the trends are fluctuated through out the year 2001 to 2005 and fall down about 10.7
percent in the current year. In this scenario grade 5 trends are slightly increasing where as
grade 2 and 3 trends’ are increasing about 25.1 percent and 20.7 percent although the
trends are fluctuated in year 2002 and 2004.
Table3: Percentage of Daily Attendance of Students in 2005
Month
Baishakh
Jestha
Ashadh
Srawan
Bhadra
Aswin
Kartik
Mangshir
Poush
Magh
Falgun
Chaitra
Total
Grade 1 61.6 74.1 77.7 75.8 74.6 67.8 75.3 86.9 86.8 66.7 74.1 70.8 63.4
Grade 2 76.2 82.0 76.9 84.2 82.6 76.3 85.6 93.5 96.7 74.2 81.7 70.7 89.2
Grade 3 78.6 82.5 83.6 87.8 83.8 74.4 83.8 96.3 97.9 70.9 82.0 72.1 90.3
Grade 4 60.4 70.0 57.6 45.7 67.9 61.2 67.7 75.8 75.5 53.9 64.5 52.0 68.4
Grade 5 77.2 80.4 69.5 59.8 81.8 84.3 75.1 81.8 81.4 72.1 79.4 68.9 76.0
Year Municipality VDC Total
2001 150.0 162.9 156.1
2002 146.4 152.9 149.5
2003 124.9 155.9 139.7
2004 126.8 141.0 132.9
2005 133 124 128.9
27. 19
Figure 7: Student attendance by grade
40.0
45.0
50.0
55.0
60.0
65.0
70.0
75.0
80.0
85.0
90.0
2001 2002 2003 2004
Grade1 Grade2 Grade3 Grade4 Grade5
A pattern of increase in the average daily attendance of the 1st, 2nd, 3rd and 5th students is
observed between the years 2001 and 2003. The figure of the 4th grade student shows a
different pattern with a rather erratic fluctuation over the years (
Month
Baishakh
Jestha
Ashadh
Srawan
Bhadra
Aswin
Kartik
Mangshir
Poush
Magh
Falgun
Chaitra
Total
Grade 1 61.6 74.1 77.7 75.8 74.6 67.8 75.3 86.9 86.8 66.7 74.1 70.8 63.4
Grade 2 76.2 82.0 76.9 84.2 82.6 76.3 85.6 93.5 96.7 74.2 81.7 70.7 89.2
Grade 3 78.6 82.5 83.6 87.8 83.8 74.4 83.8 96.3 97.9 70.9 82.0 72.1 90.3
Grade 4 60.4 70.0 57.6 45.7 67.9 61.2 67.7 75.8 75.5 53.9 64.5 52.0 68.4
Grade 5 77.2 80.4 69.5 59.8 81.8 84.3 75.1 81.8 81.4 72.1 79.4 68.9 76.0
Figure 7).
Month
Baishakh
Jestha
Ashadh
Srawan
Bhadra
Aswin
Kartik
Mangshir
Poush
Magh
Falgun
Chaitra
Total
Grade 1 61.6 74.1 77.7 75.8 74.6 67.8 75.3 86.9 86.8 66.7 74.1 70.8 63.4
Grade 2 76.2 82.0 76.9 84.2 82.6 76.3 85.6 93.5 96.7 74.2 81.7 70.7 89.2
Grade 3 78.6 82.5 83.6 87.8 83.8 74.4 83.8 96.3 97.9 70.9 82.0 72.1 90.3
Grade 4 60.4 70.0 57.6 45.7 67.9 61.2 67.7 75.8 75.5 53.9 64.5 52.0 68.4
Grade 5 77.2 80.4 69.5 59.8 81.8 84.3 75.1 81.8 81.4 72.1 79.4 68.9 76.0
The interesting scenario, however, is that the average attendances of the students of all
grades except 1st grade have decreased in 2004. This raises the question if there could be
any reasons for this apparently declining trend.
Retention of Staff in Key Positions—Head Teacher
The retention of head teacher is one of the issues of key concerns in the education sector
of the country. Head teacher turnover is considered as a serious problem for the
improvement of the school administration. In the case of the 62 sampled schools, most
i.e. 46 (74.2%) have the same head teacher since 2000. However there are also schools
where the turnover of head teachers is evident with 5 schools where the head teachers
have been replaced 3 times and one school where the number of replacement has been
four times in the period of 5 years between 2000 and 2004 (Table 25).
28. 20
Table 25: Head teacher turnover in 5 years (2000-2004)
Turnover
Once Twice Thrice Four times
Number of schools 46 10 5 1
% 74.2 16.1 8.1 1.6
Formation and Training of SMC
The composition of the members of School Management Committees viewed from
gender perspective reveals that efforts are being made to increase the number of female
members—the number has risen from 110 in 2002 to 131 in 2004 (Table 26). However
number of male members is yet almost 4 time that of female members. Therefore more
needs to be done to bring the female members at par with male. As far as training of the
members is concerned, the number is too low. In the context of increased responsibility
of the SMC, the members’ training should be considered to be a critical issue.
Table 26: SMC formed and trained
SMC status 2002 2003 2004 2005
N % N % N % N %
SMC Formed 62 100 62 100 62 100 62 100
Male 411 411 401 372
Male Trained 21 5.1 27 6.6 21 5.2 26 6.98
Female 110 104 131 115
Female Trained 5 4.6 7 6.7 12 9.2 15 13.04
Total Members 521 515 532 487
Total Trained 26 5.0 34 6.6 33 6.2 41 8.41
It is reveal in the table 22 that almost all sample school has formed SMC. The training
program for SMC is positively taken for female rather than male.
School Visit by RPs, SSs and DEOs
The number of RP’s visit to schools has decreased substantially in 2004 whereas that of
the school supervisor has increased. The SMC is rightly taking increased initiative to visit
the schools.
Table 27: Frequency of visits
Personnel
2001 2002 2003 2004 2005
No. of
Visit Mean
No. of
Visit Mean
No. of
Visit Mean
No. of
Visit Mean
No. of
Visit Mean
RP 142 2.3 139 2.2 123 2.0 61 2.7 83 1.3
SS 74 1.2 65 1.1 53 1.0 116 2.9 40 0.6
DEO 37 0.6 18 0.3 20 0.3 30 1.7 19 0.3
SMC 59 1.0 262 4.2 179 3.0 135 7.1 113 1.8
Others 37 0.6 19 0.3 28 0.5 43 2.3 131 2.1
Total 349 503 403 385 386
According to Table 27, the total frequency of the visits by different personnel in 2002 is
the highest among the four consecutive years. The mean number of visits by Resource
Persons, School Supervisors has increased significantly. The visits by SMC members has
increased up to the average of 7 times in an academic year, this could be because of
school handing over to the community.
Frequencies of school visits by responsible personnel are fluctuated through out the year
2001 to 2005. The year 2002 is recorded as mode value of the school visits where it is
gradually decreasing in the coming years. The important expectation from SMC visits to
school ratio is drastically reduced in current year is about average times of 2 in an
academic year, this could be hamper the policy of school handing over to the community.