subir wed.pptx
•Download as PPTX, PDF•
0 likes•2 views

A line graph showing molecular speed distribution. Figure 6.7 “Stylized Molecular Speed Distribution.” When analyzing a diagram of the distribution of molecular speeds, there are se

Recommended
Recommended
More Related Content
Recently uploaded
Recently uploaded (20)
Featured
Featured (20)
subir wed.pptx
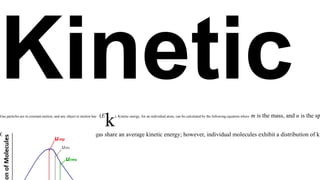
- 1. Gas particles are in constant motion, and any object in motion has (E k). Kinetic energy, for an individual atom, can be calculated by the following equation where m is the mass, and u is the sp Overall, the molecules in a sample of a gas share an average kinetic energy; however, individual molecules exhibit a distribution of ki
- 2. A line graph showing molecular speed distribution. Figure 6.7 “Stylized Molecular Speed Distribution.” When analyzing a diagram of the distribution of molecular speeds, there are se
- 3. A line graph showing molecular speed distribution. Figure 6.7 “Stylized Molecular Speed Distribution.” When analyzing a diagram of the distribution of molecular speeds, there are se
- 4. A line graph showing molecular speed distribution. Figure 6.7 “Stylized Molecular Speed Distribution.” When analyzing a diagram of the distribution of molecular speeds, there are se A line graph showing molecular speed distribution. Figure 6.7 “Stylized Molecular Speed Distribution.” When analyzing a diagram of the distribution of molecular speeds, there are se