1. Strategies for Reducing Red Blood Cell Usage
Robin Larson1
, Colleen A. Aronson2
, Nicole Roggeman1
1.Transfusion Service, Advocate Lutheran General Hospital, Park Ridge, IL, United States
2.ACL Laboratories, Rosemont, IL, United States
Abstract:
Introduction: This poster outlines two methods used by a Level 1
trauma center transfusion service to reduce the number of red cell
transfusions: on-demand crossmatching (ODXM) and 3 specific patient
blood management (PBM) strategies.
Method: Red cell inventory numbers and red cell wastage numbers
from 2009-2015 were compared year over year.
Result: From 2009 to 2015, the transfusion service saw a nearly 49%
decrease in red cell inventory.
Conclusion: The two strategies implemented by the transfusion
service were effective, either separately or together, in reducing red
cell transfusions over the period studied.
Introduction:
Faced with a growing body of evidence regarding the safety and
efficacy of transfusions, a decreased donor pool, and pressure to
reduce costs, transfusion services are looking to reduce the number of
red cell (RBC) transfusions.
This poster outlines two of the methods used by a Level 1 trauma
center transfusion service to accomplish this goal: on-demand
crossmatching (ODXM), and a set of three specific patient blood
management (PBM) strategies: lowering the hemoglobin threshold for
transfusion, lowering the default RBC order from 2 units to 1 unit, and
adding decision support regarding red cell transfusion to the
computerized physician order entry (CPOE) system.
Methods:
Red cell inventory numbers from 2009-2015, obtained by adding the
number of transfused units to the number of wasted units, were
compared year over year.
ODXM was initiated in 2008.
Earliest available data was from 2009.
The PBM strategies outlined above were implemented in 2012.
Inventory numbers reflect a combination of both methods.
Product wastage percentages were also compared year over year
for the same period, 2009-2015.
Inventory numbers were also calculated including and excluding
autologous units.
Conclusions:
1. The transfusion service saw a significant decrease in RBC
inventory of nearly 50% in the seven-year period studied. Although
it is not possible to attribute the portion of reduction in inventory
due to ODXM and PBM separately, the data shows that either or
both of the methods were effective in reducing red cell inventory.
2. The difference in wastage percentages when including and
excluding autologous units suggests that autologous inventory has
a bigger effect on RBC wastage than ODXM or PBM. More
investigation is needed as to why wastage has increased since
2009 when excluding autologous units. It is possible that there is a
baseline “wastage” number that will always be present, and that
the decrease in inventory is causing the percentage to increase.
3. It is expected that the reducing effect of both ODXM and PBM will
plateau as they become the norm for this hospital.
References:
1.Goodnough, LT, Shieh L, Hadhazy E, Cheng N, Khari P, Maggio P. Improved blood utilization using real-time clinical decision support.
Transfusion. 2014 May (54) 1358-65
2.Department of Health and Human Services. The 2011 National Blood Collection and Utilization Survey Report. 2011.
3.Ten Facts about Blood Transfusions (2013). Retrieved from https://advocatehealth.sharepoint.com/sites/AO/Initiatives/transfusion-
safety/Documents/Bloody%20Truth%20Flyer.pdf
4.Transfusion Safety Starts Here (2012). Retrieved from https://advocatehealth.sharepoint.com/sites/AO/Initiatives/transfusion-
safety/Documents/Blood%20Poster.pdf
Results:
Total red cell inventory, including autologous units decreased 48.6%
from 2009-2015: from 13,722 units per year to 7057 units per year.
Total red cell inventory, excluding autologous units, decreased
46.9%: from 13149 units per year to 6981 units per year.
Total autologous inventory decreased from 573 units in 2009 to 76
units in 2015, a decrease of nearly 87%.
The decrease in inventory resulted in an estimated cost savings of
over $1.2 million for the transfusion service.
Wastage, including autologous units, decreased from 2.43% in 2009
to 2.14% in 2015. Wastage, excluding autologous units, increased
from 0.69% in 2009 to 1.25% in 2015. Total number of autologous
units decreased from 573 in 2009 to 76 in 2015.
Figure 4.RBC units transfused through the period 2009-2015, both including and excluding autologous units.
Including autologous units there was a 48.6% decrease in inventory. Excluding autologous units there was a
46.9% decrease.
Figure 1. Mediware flyer which was distributed to medical staff throughout the Advocate system.
Figure 6. Reduction in total cost per year of RBCs over the studied period, assuming $200/unit.
Figure 5. Badges and poster images used to promote the change in hemoglobin threshold and minimum blood
order in the Advocate System.
Figure 3. Four graphs showing the reduction in RBC inventory in the period 2009-2015, as well as breakout
graphs showing the percent and number of wasted RBCs and the autologous inventory alone.
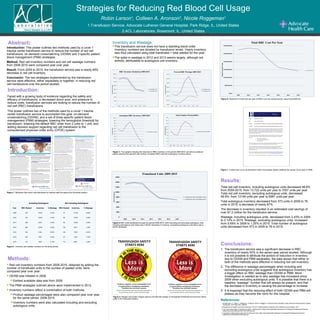
Figure 2. Inventory and wasted numbers for the study period.
This transfusion service does not have a standing blood order.
Inventory numbers are dictated by transfusion levels. Yearly inventory
was thus calculated using total transfused + total wasted for the year.
The spike in wastage in 2012 and 2013 seems largely, although not
entirely, attributable to autologous unit inventory.
Figure 7. A letter sent out to all physicians within the hospital system detailing the results of one year of PBM.
Inventory and Wastage
Including Autologous Not including Autologous
Year RBC Wasted Inventory % Wastage RBC Wasted Inventory % Wastage
2009 334 13722 2.43% 91 13149 0.69%
2010 307 14240 2.16% 66 13750 0.48%
2011 389 13971 2.78% 63 13253 0.48%
2012 585 10780 5.43% 125 9917 1.26%
2013 534 8194 6.52% 155 7636 2.03%
2014 336 7661 4.39% 141 7403 1.44%
2015 151 7057 2.14% 113 6981 1.25%
Editor's Notes
2014: $1.6 million below budget system-wide for RBCs
Comparative percent reduction system-wide among all 8 hospitals in 2012.
$5.5 million saved in year 1, $3.8 million saved in year 2.