SlideShare a Scribd company logo
1 of 7
Download to read offline
Charlottesville Area 2nd Quarter 2013 Highlights: 
 Overall sales in Greater Charlottesville were up 11.2% over the same quarter last year, the seventh 
consecutive quarter with year-over-year gains. 
 The median sales price of $273,200 in the 2nd Quarter was up 20.1% from last quarter and 6.3% from one 
year ago. 
 Half of the homes sold in Q2-2013 were on the market 40 days or less, representing a 20-day improvement 
over the median days on market (DOM) in the same quarter last year. 
Copyright (c) 2013 RealEstate Business Intelligence, LLC. All Rights Reserved 
Data Source: CAAR MLS. Statistics calculated July 3, 2013. 
2nd Quarter 2013 Sales Activity 
There were 815 homes sold in the Charlottesville area in the second quarter, which was up 11.2% (+82 sales) from the 
second quarter last year and the highest Q2 sales rate since 2010. This increase in sales volume, coupled with a 7% 
increase in the average sales price compared to Q2-2012, resulted in an 18.9% jump in sold dollar volume (+$42.9M) to 
The voice of real estate in Central Virginia 
2013 2nd Quarter and 
Mid-Year Market Report 
2011 Year End Market Report Market 
ReportReport 
CAAR Member Copy – Expanded Edition
$269,423,585. Compared to the 635 sales in Q2-2009, the lowest second quarter sales on record, there were 28.3% more sales (+180) and an increase of 37.7% in sold dollar volume (+73.7M). 
Four of the six jurisdictions in the Charlottesville area experienced double-digit percent increases in the number of sales compared to Q2-2012. Louisa County (+59% or 23 more sales), Nelson (+20% or seven more sales), Albemarle (+14% or 54 more sales) and Greene (+14% or six more sales) each showed the strongest year-over-year gains. After experiencing a 22% year-over-year decrease in sales in the first quarter, Charlottesville rebounded in the second quarter with 164 sales, representing a 7% increase over Q2-2012 (+11 sales). Fluvanna was the only county to post a decline in sales, with 19 fewer closed sales than Q2-2012 representing a 22% dip. 
Copyright (c) 2013 RealEstate Business Intelligence, LLC. All Rights Reserved Data Source: CAAR MLS. Statistics calculated July 3, 2013. 
Prices Climbing 
The $273,200 median sales price in the 2nd Quarter is the highest level since 2008 and is 6.3% above the Q2-2012 median of $257,000. Not surprisingly, the average amount of original list price received at time of sale also has increased to 94.2% from 92.5% in Q2- 2012. This is the highest average sale-to-original-list- price ratio since the 4th Quarter of 2007. 
Louisa ($200,250) and Nelson ($243,500) both saw double-digit year-over-year gains in median sales price, up 30% and 21.8% respectively. Both Charlottesville ($262,750) and Albemarle ($325,000) reached their highest median sales price levels since 2008. The Charlottesville median sales price was 6.2% above the Q2-2012 level while Albemarle was up 8.4%. “Seeing the steady rise in pricing in most of the localities across Greater Charlottesville is exactly what drives the confidence of both buyers and sellers in achieving their individual property ownership goals,” reports CAAR 2013 President Denise Ramey, GRI. Fluvanna pricing ($185,000) was essentially unchanged with a 0.7% year-over- year decrease. At $198,000, Greene was the only county with significant declines in median sales price, down 16.4% from last year’s level.
New Contracts and Inventory Movement 
The 1,031 new pending sales in the Greater Charlottesville area this quarter represented a 16.7% increase over the 883 in Q2-2012. This is only the fifth time on record that new pending sales reached the 4- digit level, so obviously buyer demand heated up over the first half of 2013. This was the ninth consecutive quarter with year-over-year gains in new contract activity. “In analyzing the results of this quarter, all indicators point to a healthy housing market in our region. The local market has consistently gained momentum over the past few quarters,” adds Denise Ramey. 
There were 1,420 new listings added in the quarter, 3.7% more than Q2-2012, the third consecutive quarter with increased listing activity. This signifies that potential sellers are coming off the sidelines of late, but the fact that the growth in new contracts is outpacing the growth in new listings could bode well for the health of the market as inventory levels continue to decline. With 11 months of active inventory at the end of June, Greater Charlottesville remains a buyer’s market, but this is down substantially from the 14.5 months of supply level in June 2011. There were 15.6% fewer distressed properties listed throughout the quarter compared to Q2-2012, while the 1,323 non-distressed new listings represented a 5.5% increase. “The heightened activity surrounding high-end purchases is more evidence of a strengthening market. We’ve seen the sales over $1 million nearly double, to 19 sales in Q2-2013 from 10 this same timeframe last year,” says CAAR 2013 President-Elect John Ince. 
Where do these shifts in new listing and contract activity leave the active inventory level heading into the second half of the year? The 2,179 active listings at the end of the quarter are down 4.8% from the same period last year. This is 14.1% lower than the five-year June 30th average. Nine of every 10 active listings (95.3%) are non-distressed properties. Of active listings, 103 are foreclosures or short sales, 29 fewer than this time last year and 71 fewer than at the end of Q2- 2011 (-40.8%). The 51 active foreclosure listings at the end of Q2 represent a 27.1% decrease from this time last year, and the 52 active short sales are 16.1% lower than Q2-2011. 
Copyright (c) 2013 RealEstate Business Intelligence, LLC. All Rights Reserved Data Source: CAAR MLS. Statistics calculated July 3, 2013.
Days on Market (DOM) 
As detailed in the 1st Quarter report, homes typically sell faster in the 2nd Quarter than the 1st Quarter, and this year was no exception. In fact, the median DOM of 40 days represents a 57% decrease from the 94-day median DOM of the previous quarter (that’s nearly two months faster). This is the lowest quarterly level for the region in six years and is 20 days lower than the same period last year. The average DOM is down to 117 days, a 33-day improvement over Q2-2012 and 53-day improvement over last quarter. 
Homes sold fastest in Charlottesville, where the 16-day median DOM for the quarter matched the previous record low back in 2005. This was a 33-day improvement over the 49-day level in Q2-2012. Remarkably, the median DOM for Charlottesville homes sold in June was only eight days, which is actually a day lower than the median DOM in Washington, DC (one of the hottest markets in the county). Albemarle (31 days) experienced a 20-day drop in median DOM compared to Q2-2012. Fluvanna’s median DOM improved slightly (-4 days) to 67 days. Louisa (74 days), Greene (83 days) and Nelson (186 days) each had higher median DOM levels versus Q2-2012. 
Distressed Sales and Pricing 
Only 58 of the 815 sales in the 2nd Quarter, or 7.7%, were foreclosures. This represents 11 fewer foreclosure sales versus Q2-2012, when foreclosures accounted for 9.4% of sales. The 31 short sales were two fewer than the same quarter last year and represent an identical share of the sold market at 4.5%. Non-distressed properties accounted for 87.9% of all homes sold, up from 86.1% in Q2-2012. 
The median sale price for non-distressed sales was up 4.8% from Q2-2012 to $285,000 while the foreclosure median level was up 1.7% to $137,500. The median price for the short sale segment was up 5.6%, to $190,000. 
Market Share by Bank-Mediated Status 
Three-Year June Snapshot
Detached vs. Attached Homes in Greater Charlottesville 
Sales of attached homes (condos and townhomes) in the region during Q2-2013 were up 25.5% (+41) to 202 from Q2- 
2012. The 613 detached homes sold represented a 7.2% increase from the 572 sold in Q2-2012. At $220,500, the median 
sales price for attached homes had the largest year-over-year increase, +16.7%, since Q1-2008. Detached homes showed 
a 4.4% increase in median sales price, up $12,710 to $300,000. 
Copyright (c) 2013 RealEstate Business Intelligence, LLC. All Rights Reserved 
Data Source: CAAR MLS. Statistics calculated July 3, 2013. 
If you plan to sell a home in 2013, be sure to have a REALTOR® prepare a comparative market analysis (CMA) so that you 
can price it to sell. And, if you are looking to buy, a REALTOR® can help you understand the current market and evaluate 
your options. 
This 2013 2nd Quarter Market Report is produced by the Charlottesville Area Association of REALTORS® using data from 
the CAAR MLS. For more information on this report or the real estate market, pick up a copy of the CAAR Real Estate 
Weekly, visit www.caar.com, or contact your REALTOR®. 
All Residential Q2-13 % Q-O-Q Q1-13 % Y-O-Y Q2-12 % Y-O-2Y Q2-11 % Y-O-3Y Q2-10 
Average Sales Price (Closed) $330,581 19.4% $276,795 7.0% $309,070 8.2% $305,606 5.0% $314,888 
Median Sales Price (Closed) $273,200 20.1% $227,500 6.3% $257,000 6.7% $256,000 3.9% $262,838 
Units Sold (Closed) 815 65.7% 492 11.2% 733 20.7% 675 -4.8% 856 
Average DOM (Closed) 117 -31.2% 170 -22.0% 150 -19.3% 145 -11.4% 132 
Listing Discount (Average) 5.8% 9.1% 7.5% 8.3% 6.1% 
Ratio Avg SP/Avg OLP 94.2% 91.0% 92.5% 91.7% 93.9% 
Avg SP/Sq Ft 143 10.9% 129 2.1% 140 3.6% 138 -1.4% 145 
Detached Q2-13 % Q-O-Q Q1-13 % Y-O-Y Q2-12 % Y-O-2Y Q2-11 % Y-O-3Y Q2-10 
Average Sales Price (Closed) $358,768 20.3% $298,318 6.6% $336,600 7.3% $334,370 3.9% $345,252 
Median Sales Price (Closed) $300,000 22.7% $244,500 4.4% $287,290 7.9% $277,950 2.4% $293,000 
Units Sold (Closed) 613 58.0% 388 7.2% 572 16.1% 528 -3.5% 635 
Average DOM (Closed) 124 -24.8% 165 -19.5% 154 -19.0% 153 -11.4% 140 
Listing Discount (Average) 6.4% 9.4% 8.0% 9.1% 7.3% 
Ratio Avg SP/Avg OLP 93.6% 90.6% 92.0% 91.0% 92.7% 
Avg SP/Sq Ft 141 11.0% 127 0.7% 140 3.7% 136 -3.4% 146 
Attached Q2-13 % Q-O-Q Q1-13 % Y-O-Y Q2-12 % Y-O-2Y Q2-11 % Y-O-3Y Q2-10 
Average Sales Price (Closed) $245,045 24.7% $196,498 16.0% $211,263 21.1% $202,289 7.6% $227,642 
Median Sales Price (Closed) $220,500 20.2% $183,520 16.7% $189,000 13.7% $194,000 0.2% $220,000 
Units Sold (Closed) 202 94.2% 104 25.5% 161 37.4% 147 -8.6% 221 
Average DOM (Closed) 98 -48.4% 190 -27.9% 136 -15.5% 116 -10.9% 110 
Listing Discount (Average) 4.0% 7.8% 5.6% 5.5% 2.6% 
Ratio Avg SP/Avg OLP 96.0% 92.2% 94.5% 94.5% 97.4% 
Avg SP/Sq Ft 149 8.8% 137 4.9% 142 2.1% 146 4.9% 142 
RBI Key Housing Trend Metrics [Charlottesville Area Association of REALTORS® (CAAR)]

More Related Content

Recently uploaded

9990771857 Call Girls in Dwarka Sector 2 Delhi (Call Girls) Delhi
9990771857 Call Girls in Dwarka Sector 2 Delhi (Call Girls) Delhi9990771857 Call Girls in Dwarka Sector 2 Delhi (Call Girls) Delhi
9990771857 Call Girls in Dwarka Sector 2 Delhi (Call Girls) Delhidelhimodel235
 
Magarpatta Nova Elegance Mundhwa Pune E-Brochure.pdf
Magarpatta Nova Elegance Mundhwa Pune  E-Brochure.pdfMagarpatta Nova Elegance Mundhwa Pune  E-Brochure.pdf
Magarpatta Nova Elegance Mundhwa Pune E-Brochure.pdfManishSaxena95
 
Kolte Patil Kharadi Pune E Brochure.pdf
Kolte Patil Kharadi Pune E  Brochure.pdfKolte Patil Kharadi Pune E  Brochure.pdf
Kolte Patil Kharadi Pune E Brochure.pdfabbu831446
 
9990771857 Call Girls in Dwarka Sector 137 Noida (Call Girls) Delhi
9990771857 Call Girls in Dwarka Sector 137 Noida (Call Girls) Delhi9990771857 Call Girls in Dwarka Sector 137 Noida (Call Girls) Delhi
9990771857 Call Girls in Dwarka Sector 137 Noida (Call Girls) Delhidelhimodel235
 
9990771857 Call Girls in Dwarka Sector 6 Delhi (Call Girls) Delhi
9990771857 Call Girls in Dwarka Sector 6 Delhi (Call Girls) Delhi9990771857 Call Girls in Dwarka Sector 6 Delhi (Call Girls) Delhi
9990771857 Call Girls in Dwarka Sector 6 Delhi (Call Girls) Delhidelhimodel235
 
Mahindra Happinest Tathawade Pune Brochure.pdf
Mahindra Happinest Tathawade Pune Brochure.pdfMahindra Happinest Tathawade Pune Brochure.pdf
Mahindra Happinest Tathawade Pune Brochure.pdfBabyrudram
 
Premium Villa Projects in Sarjapur Road Bengaluru
Premium Villa Projects in Sarjapur Road BengaluruPremium Villa Projects in Sarjapur Road Bengaluru
Premium Villa Projects in Sarjapur Road BengaluruShivaSeo3
 
Properties for Sale in Istanbul with Schools and Parks | Antalya Development
Properties for Sale in Istanbul with Schools and Parks | Antalya DevelopmentProperties for Sale in Istanbul with Schools and Parks | Antalya Development
Properties for Sale in Istanbul with Schools and Parks | Antalya DevelopmentAntalya Development
 
Purva Soukhyam in Guduvancheri Chennai.pdf
Purva Soukhyam in Guduvancheri Chennai.pdfPurva Soukhyam in Guduvancheri Chennai.pdf
Purva Soukhyam in Guduvancheri Chennai.pdfpritika141199
 
Call Girls In Laxmi Nagar Delhi +91-8447779280! !Best Woman Seeking Man Escor...
Call Girls In Laxmi Nagar Delhi +91-8447779280! !Best Woman Seeking Man Escor...Call Girls In Laxmi Nagar Delhi +91-8447779280! !Best Woman Seeking Man Escor...
Call Girls In Laxmi Nagar Delhi +91-8447779280! !Best Woman Seeking Man Escor...asmaqueen5
 
9990771857 Call Girls in Dwarka Sector 3 Delhi (Call Girls) Delhi
9990771857 Call Girls in Dwarka Sector 3 Delhi (Call Girls) Delhi9990771857 Call Girls in Dwarka Sector 3 Delhi (Call Girls) Delhi
9990771857 Call Girls in Dwarka Sector 3 Delhi (Call Girls) Delhidelhimodel235
 
Best Deal Virtual Space in Satya The Hive Tata Zudio 750 Sqft 1.89 Cr All inc...
Best Deal Virtual Space in Satya The Hive Tata Zudio 750 Sqft 1.89 Cr All inc...Best Deal Virtual Space in Satya The Hive Tata Zudio 750 Sqft 1.89 Cr All inc...
Best Deal Virtual Space in Satya The Hive Tata Zudio 750 Sqft 1.89 Cr All inc...ApartmentWala1
 
call girls in ganesh nagar Delhi 8264348440 ✅ call girls ❤️
call girls in ganesh nagar Delhi 8264348440 ✅ call girls ❤️call girls in ganesh nagar Delhi 8264348440 ✅ call girls ❤️
call girls in ganesh nagar Delhi 8264348440 ✅ call girls ❤️soniya singh
 
SVN Live 5.6.24 Weekly Property Broadcast
SVN Live 5.6.24 Weekly Property BroadcastSVN Live 5.6.24 Weekly Property Broadcast
SVN Live 5.6.24 Weekly Property BroadcastSVN International Corp.
 
Low Rate ↬Call Girls in Trilokpuri Delhi ↫8447779280}Escorts Service In Delhi
Low Rate ↬Call Girls in Trilokpuri Delhi ↫8447779280}Escorts Service In DelhiLow Rate ↬Call Girls in Trilokpuri Delhi ↫8447779280}Escorts Service In Delhi
Low Rate ↬Call Girls in Trilokpuri Delhi ↫8447779280}Escorts Service In Delhiasmaqueen5
 
Kohinoor Flats In Hinjewadi Phase 2 | Homes Built To Suit Your Needs
Kohinoor Flats In Hinjewadi Phase 2 | Homes Built To Suit Your NeedsKohinoor Flats In Hinjewadi Phase 2 | Homes Built To Suit Your Needs
Kohinoor Flats In Hinjewadi Phase 2 | Homes Built To Suit Your Needsaidasheikh47
 
TENANT SCREENING REPORT SERVICES​ How Tenant Screening Reports Work
TENANT SCREENING REPORT SERVICES​ How Tenant Screening Reports WorkTENANT SCREENING REPORT SERVICES​ How Tenant Screening Reports Work
TENANT SCREENING REPORT SERVICES​ How Tenant Screening Reports WorkTurbo Tenant
 
Call girls in new Ashok NagarDelhi꧁ 8447779280꧂ Escort Service Women Seeking ...
Call girls in new Ashok NagarDelhi꧁ 8447779280꧂ Escort Service Women Seeking ...Call girls in new Ashok NagarDelhi꧁ 8447779280꧂ Escort Service Women Seeking ...
Call girls in new Ashok NagarDelhi꧁ 8447779280꧂ Escort Service Women Seeking ...asmaqueen5
 
M3M 129 E Brochure Noida Expressway, Sector 129, Noida
M3M 129 E Brochure Noida Expressway, Sector 129, NoidaM3M 129 E Brochure Noida Expressway, Sector 129, Noida
M3M 129 E Brochure Noida Expressway, Sector 129, Noidasarak0han45400
 
M3M The Line Brochure - Premium Investment Opportunity for Commercial Ventures
M3M The Line Brochure - Premium Investment Opportunity for Commercial VenturesM3M The Line Brochure - Premium Investment Opportunity for Commercial Ventures
M3M The Line Brochure - Premium Investment Opportunity for Commercial Venturessheltercareglobal
 

Recently uploaded (20)

9990771857 Call Girls in Dwarka Sector 2 Delhi (Call Girls) Delhi
9990771857 Call Girls in Dwarka Sector 2 Delhi (Call Girls) Delhi9990771857 Call Girls in Dwarka Sector 2 Delhi (Call Girls) Delhi
9990771857 Call Girls in Dwarka Sector 2 Delhi (Call Girls) Delhi
 
Magarpatta Nova Elegance Mundhwa Pune E-Brochure.pdf
Magarpatta Nova Elegance Mundhwa Pune  E-Brochure.pdfMagarpatta Nova Elegance Mundhwa Pune  E-Brochure.pdf
Magarpatta Nova Elegance Mundhwa Pune E-Brochure.pdf
 
Kolte Patil Kharadi Pune E Brochure.pdf
Kolte Patil Kharadi Pune E  Brochure.pdfKolte Patil Kharadi Pune E  Brochure.pdf
Kolte Patil Kharadi Pune E Brochure.pdf
 
9990771857 Call Girls in Dwarka Sector 137 Noida (Call Girls) Delhi
9990771857 Call Girls in Dwarka Sector 137 Noida (Call Girls) Delhi9990771857 Call Girls in Dwarka Sector 137 Noida (Call Girls) Delhi
9990771857 Call Girls in Dwarka Sector 137 Noida (Call Girls) Delhi
 
9990771857 Call Girls in Dwarka Sector 6 Delhi (Call Girls) Delhi
9990771857 Call Girls in Dwarka Sector 6 Delhi (Call Girls) Delhi9990771857 Call Girls in Dwarka Sector 6 Delhi (Call Girls) Delhi
9990771857 Call Girls in Dwarka Sector 6 Delhi (Call Girls) Delhi
 
Mahindra Happinest Tathawade Pune Brochure.pdf
Mahindra Happinest Tathawade Pune Brochure.pdfMahindra Happinest Tathawade Pune Brochure.pdf
Mahindra Happinest Tathawade Pune Brochure.pdf
 
Premium Villa Projects in Sarjapur Road Bengaluru
Premium Villa Projects in Sarjapur Road BengaluruPremium Villa Projects in Sarjapur Road Bengaluru
Premium Villa Projects in Sarjapur Road Bengaluru
 
Properties for Sale in Istanbul with Schools and Parks | Antalya Development
Properties for Sale in Istanbul with Schools and Parks | Antalya DevelopmentProperties for Sale in Istanbul with Schools and Parks | Antalya Development
Properties for Sale in Istanbul with Schools and Parks | Antalya Development
 
Purva Soukhyam in Guduvancheri Chennai.pdf
Purva Soukhyam in Guduvancheri Chennai.pdfPurva Soukhyam in Guduvancheri Chennai.pdf
Purva Soukhyam in Guduvancheri Chennai.pdf
 
Call Girls In Laxmi Nagar Delhi +91-8447779280! !Best Woman Seeking Man Escor...
Call Girls In Laxmi Nagar Delhi +91-8447779280! !Best Woman Seeking Man Escor...Call Girls In Laxmi Nagar Delhi +91-8447779280! !Best Woman Seeking Man Escor...
Call Girls In Laxmi Nagar Delhi +91-8447779280! !Best Woman Seeking Man Escor...
 
9990771857 Call Girls in Dwarka Sector 3 Delhi (Call Girls) Delhi
9990771857 Call Girls in Dwarka Sector 3 Delhi (Call Girls) Delhi9990771857 Call Girls in Dwarka Sector 3 Delhi (Call Girls) Delhi
9990771857 Call Girls in Dwarka Sector 3 Delhi (Call Girls) Delhi
 
Best Deal Virtual Space in Satya The Hive Tata Zudio 750 Sqft 1.89 Cr All inc...
Best Deal Virtual Space in Satya The Hive Tata Zudio 750 Sqft 1.89 Cr All inc...Best Deal Virtual Space in Satya The Hive Tata Zudio 750 Sqft 1.89 Cr All inc...
Best Deal Virtual Space in Satya The Hive Tata Zudio 750 Sqft 1.89 Cr All inc...
 
call girls in ganesh nagar Delhi 8264348440 ✅ call girls ❤️
call girls in ganesh nagar Delhi 8264348440 ✅ call girls ❤️call girls in ganesh nagar Delhi 8264348440 ✅ call girls ❤️
call girls in ganesh nagar Delhi 8264348440 ✅ call girls ❤️
 
SVN Live 5.6.24 Weekly Property Broadcast
SVN Live 5.6.24 Weekly Property BroadcastSVN Live 5.6.24 Weekly Property Broadcast
SVN Live 5.6.24 Weekly Property Broadcast
 
Low Rate ↬Call Girls in Trilokpuri Delhi ↫8447779280}Escorts Service In Delhi
Low Rate ↬Call Girls in Trilokpuri Delhi ↫8447779280}Escorts Service In DelhiLow Rate ↬Call Girls in Trilokpuri Delhi ↫8447779280}Escorts Service In Delhi
Low Rate ↬Call Girls in Trilokpuri Delhi ↫8447779280}Escorts Service In Delhi
 
Kohinoor Flats In Hinjewadi Phase 2 | Homes Built To Suit Your Needs
Kohinoor Flats In Hinjewadi Phase 2 | Homes Built To Suit Your NeedsKohinoor Flats In Hinjewadi Phase 2 | Homes Built To Suit Your Needs
Kohinoor Flats In Hinjewadi Phase 2 | Homes Built To Suit Your Needs
 
TENANT SCREENING REPORT SERVICES​ How Tenant Screening Reports Work
TENANT SCREENING REPORT SERVICES​ How Tenant Screening Reports WorkTENANT SCREENING REPORT SERVICES​ How Tenant Screening Reports Work
TENANT SCREENING REPORT SERVICES​ How Tenant Screening Reports Work
 
Call girls in new Ashok NagarDelhi꧁ 8447779280꧂ Escort Service Women Seeking ...
Call girls in new Ashok NagarDelhi꧁ 8447779280꧂ Escort Service Women Seeking ...Call girls in new Ashok NagarDelhi꧁ 8447779280꧂ Escort Service Women Seeking ...
Call girls in new Ashok NagarDelhi꧁ 8447779280꧂ Escort Service Women Seeking ...
 
M3M 129 E Brochure Noida Expressway, Sector 129, Noida
M3M 129 E Brochure Noida Expressway, Sector 129, NoidaM3M 129 E Brochure Noida Expressway, Sector 129, Noida
M3M 129 E Brochure Noida Expressway, Sector 129, Noida
 
M3M The Line Brochure - Premium Investment Opportunity for Commercial Ventures
M3M The Line Brochure - Premium Investment Opportunity for Commercial VenturesM3M The Line Brochure - Premium Investment Opportunity for Commercial Ventures
M3M The Line Brochure - Premium Investment Opportunity for Commercial Ventures
 

Featured

2024 State of Marketing Report – by Hubspot
2024 State of Marketing Report – by Hubspot2024 State of Marketing Report – by Hubspot
2024 State of Marketing Report – by HubspotMarius Sescu
 
Everything You Need To Know About ChatGPT
Everything You Need To Know About ChatGPTEverything You Need To Know About ChatGPT
Everything You Need To Know About ChatGPTExpeed Software
 
Product Design Trends in 2024 | Teenage Engineerings
Product Design Trends in 2024 | Teenage EngineeringsProduct Design Trends in 2024 | Teenage Engineerings
Product Design Trends in 2024 | Teenage EngineeringsPixeldarts
 
How Race, Age and Gender Shape Attitudes Towards Mental Health
How Race, Age and Gender Shape Attitudes Towards Mental HealthHow Race, Age and Gender Shape Attitudes Towards Mental Health
How Race, Age and Gender Shape Attitudes Towards Mental HealthThinkNow
 
AI Trends in Creative Operations 2024 by Artwork Flow.pdf
AI Trends in Creative Operations 2024 by Artwork Flow.pdfAI Trends in Creative Operations 2024 by Artwork Flow.pdf
AI Trends in Creative Operations 2024 by Artwork Flow.pdfmarketingartwork
 
PEPSICO Presentation to CAGNY Conference Feb 2024
PEPSICO Presentation to CAGNY Conference Feb 2024PEPSICO Presentation to CAGNY Conference Feb 2024
PEPSICO Presentation to CAGNY Conference Feb 2024Neil Kimberley
 
Content Methodology: A Best Practices Report (Webinar)
Content Methodology: A Best Practices Report (Webinar)Content Methodology: A Best Practices Report (Webinar)
Content Methodology: A Best Practices Report (Webinar)contently
 
How to Prepare For a Successful Job Search for 2024
How to Prepare For a Successful Job Search for 2024How to Prepare For a Successful Job Search for 2024
How to Prepare For a Successful Job Search for 2024Albert Qian
 
Social Media Marketing Trends 2024 // The Global Indie Insights
Social Media Marketing Trends 2024 // The Global Indie InsightsSocial Media Marketing Trends 2024 // The Global Indie Insights
Social Media Marketing Trends 2024 // The Global Indie InsightsKurio // The Social Media Age(ncy)
 
Trends In Paid Search: Navigating The Digital Landscape In 2024
Trends In Paid Search: Navigating The Digital Landscape In 2024Trends In Paid Search: Navigating The Digital Landscape In 2024
Trends In Paid Search: Navigating The Digital Landscape In 2024Search Engine Journal
 
5 Public speaking tips from TED - Visualized summary
5 Public speaking tips from TED - Visualized summary5 Public speaking tips from TED - Visualized summary
5 Public speaking tips from TED - Visualized summarySpeakerHub
 
ChatGPT and the Future of Work - Clark Boyd
ChatGPT and the Future of Work - Clark Boyd ChatGPT and the Future of Work - Clark Boyd
ChatGPT and the Future of Work - Clark Boyd Clark Boyd
 
Getting into the tech field. what next
Getting into the tech field. what next Getting into the tech field. what next
Getting into the tech field. what next Tessa Mero
 
Google's Just Not That Into You: Understanding Core Updates & Search Intent
Google's Just Not That Into You: Understanding Core Updates & Search IntentGoogle's Just Not That Into You: Understanding Core Updates & Search Intent
Google's Just Not That Into You: Understanding Core Updates & Search IntentLily Ray
 
Time Management & Productivity - Best Practices
Time Management & Productivity -  Best PracticesTime Management & Productivity -  Best Practices
Time Management & Productivity - Best PracticesVit Horky
 
The six step guide to practical project management
The six step guide to practical project managementThe six step guide to practical project management
The six step guide to practical project managementMindGenius
 
Beginners Guide to TikTok for Search - Rachel Pearson - We are Tilt __ Bright...
Beginners Guide to TikTok for Search - Rachel Pearson - We are Tilt __ Bright...Beginners Guide to TikTok for Search - Rachel Pearson - We are Tilt __ Bright...
Beginners Guide to TikTok for Search - Rachel Pearson - We are Tilt __ Bright...RachelPearson36
 

Featured (20)

2024 State of Marketing Report – by Hubspot
2024 State of Marketing Report – by Hubspot2024 State of Marketing Report – by Hubspot
2024 State of Marketing Report – by Hubspot
 
Everything You Need To Know About ChatGPT
Everything You Need To Know About ChatGPTEverything You Need To Know About ChatGPT
Everything You Need To Know About ChatGPT
 
Product Design Trends in 2024 | Teenage Engineerings
Product Design Trends in 2024 | Teenage EngineeringsProduct Design Trends in 2024 | Teenage Engineerings
Product Design Trends in 2024 | Teenage Engineerings
 
How Race, Age and Gender Shape Attitudes Towards Mental Health
How Race, Age and Gender Shape Attitudes Towards Mental HealthHow Race, Age and Gender Shape Attitudes Towards Mental Health
How Race, Age and Gender Shape Attitudes Towards Mental Health
 
AI Trends in Creative Operations 2024 by Artwork Flow.pdf
AI Trends in Creative Operations 2024 by Artwork Flow.pdfAI Trends in Creative Operations 2024 by Artwork Flow.pdf
AI Trends in Creative Operations 2024 by Artwork Flow.pdf
 
Skeleton Culture Code
Skeleton Culture CodeSkeleton Culture Code
Skeleton Culture Code
 
PEPSICO Presentation to CAGNY Conference Feb 2024
PEPSICO Presentation to CAGNY Conference Feb 2024PEPSICO Presentation to CAGNY Conference Feb 2024
PEPSICO Presentation to CAGNY Conference Feb 2024
 
Content Methodology: A Best Practices Report (Webinar)
Content Methodology: A Best Practices Report (Webinar)Content Methodology: A Best Practices Report (Webinar)
Content Methodology: A Best Practices Report (Webinar)
 
How to Prepare For a Successful Job Search for 2024
How to Prepare For a Successful Job Search for 2024How to Prepare For a Successful Job Search for 2024
How to Prepare For a Successful Job Search for 2024
 
Social Media Marketing Trends 2024 // The Global Indie Insights
Social Media Marketing Trends 2024 // The Global Indie InsightsSocial Media Marketing Trends 2024 // The Global Indie Insights
Social Media Marketing Trends 2024 // The Global Indie Insights
 
Trends In Paid Search: Navigating The Digital Landscape In 2024
Trends In Paid Search: Navigating The Digital Landscape In 2024Trends In Paid Search: Navigating The Digital Landscape In 2024
Trends In Paid Search: Navigating The Digital Landscape In 2024
 
5 Public speaking tips from TED - Visualized summary
5 Public speaking tips from TED - Visualized summary5 Public speaking tips from TED - Visualized summary
5 Public speaking tips from TED - Visualized summary
 
ChatGPT and the Future of Work - Clark Boyd
ChatGPT and the Future of Work - Clark Boyd ChatGPT and the Future of Work - Clark Boyd
ChatGPT and the Future of Work - Clark Boyd
 
Getting into the tech field. what next
Getting into the tech field. what next Getting into the tech field. what next
Getting into the tech field. what next
 
Google's Just Not That Into You: Understanding Core Updates & Search Intent
Google's Just Not That Into You: Understanding Core Updates & Search IntentGoogle's Just Not That Into You: Understanding Core Updates & Search Intent
Google's Just Not That Into You: Understanding Core Updates & Search Intent
 
How to have difficult conversations
How to have difficult conversations How to have difficult conversations
How to have difficult conversations
 
Introduction to Data Science
Introduction to Data ScienceIntroduction to Data Science
Introduction to Data Science
 
Time Management & Productivity - Best Practices
Time Management & Productivity -  Best PracticesTime Management & Productivity -  Best Practices
Time Management & Productivity - Best Practices
 
The six step guide to practical project management
The six step guide to practical project managementThe six step guide to practical project management
The six step guide to practical project management
 
Beginners Guide to TikTok for Search - Rachel Pearson - We are Tilt __ Bright...
Beginners Guide to TikTok for Search - Rachel Pearson - We are Tilt __ Bright...Beginners Guide to TikTok for Search - Rachel Pearson - We are Tilt __ Bright...
Beginners Guide to TikTok for Search - Rachel Pearson - We are Tilt __ Bright...
 

Charlottesville Area 2nd Qtr 2013 Real Estate Market Data

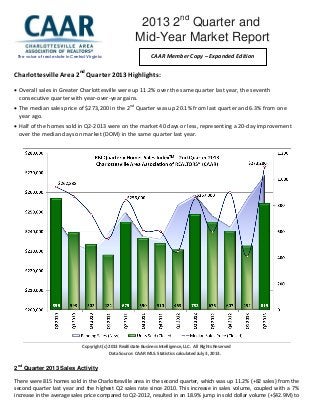
  • 1. Charlottesville Area 2nd Quarter 2013 Highlights:  Overall sales in Greater Charlottesville were up 11.2% over the same quarter last year, the seventh consecutive quarter with year-over-year gains.  The median sales price of $273,200 in the 2nd Quarter was up 20.1% from last quarter and 6.3% from one year ago.  Half of the homes sold in Q2-2013 were on the market 40 days or less, representing a 20-day improvement over the median days on market (DOM) in the same quarter last year. Copyright (c) 2013 RealEstate Business Intelligence, LLC. All Rights Reserved Data Source: CAAR MLS. Statistics calculated July 3, 2013. 2nd Quarter 2013 Sales Activity There were 815 homes sold in the Charlottesville area in the second quarter, which was up 11.2% (+82 sales) from the second quarter last year and the highest Q2 sales rate since 2010. This increase in sales volume, coupled with a 7% increase in the average sales price compared to Q2-2012, resulted in an 18.9% jump in sold dollar volume (+$42.9M) to The voice of real estate in Central Virginia 2013 2nd Quarter and Mid-Year Market Report 2011 Year End Market Report Market ReportReport CAAR Member Copy – Expanded Edition
  • 2. $269,423,585. Compared to the 635 sales in Q2-2009, the lowest second quarter sales on record, there were 28.3% more sales (+180) and an increase of 37.7% in sold dollar volume (+73.7M). Four of the six jurisdictions in the Charlottesville area experienced double-digit percent increases in the number of sales compared to Q2-2012. Louisa County (+59% or 23 more sales), Nelson (+20% or seven more sales), Albemarle (+14% or 54 more sales) and Greene (+14% or six more sales) each showed the strongest year-over-year gains. After experiencing a 22% year-over-year decrease in sales in the first quarter, Charlottesville rebounded in the second quarter with 164 sales, representing a 7% increase over Q2-2012 (+11 sales). Fluvanna was the only county to post a decline in sales, with 19 fewer closed sales than Q2-2012 representing a 22% dip. Copyright (c) 2013 RealEstate Business Intelligence, LLC. All Rights Reserved Data Source: CAAR MLS. Statistics calculated July 3, 2013. Prices Climbing The $273,200 median sales price in the 2nd Quarter is the highest level since 2008 and is 6.3% above the Q2-2012 median of $257,000. Not surprisingly, the average amount of original list price received at time of sale also has increased to 94.2% from 92.5% in Q2- 2012. This is the highest average sale-to-original-list- price ratio since the 4th Quarter of 2007. Louisa ($200,250) and Nelson ($243,500) both saw double-digit year-over-year gains in median sales price, up 30% and 21.8% respectively. Both Charlottesville ($262,750) and Albemarle ($325,000) reached their highest median sales price levels since 2008. The Charlottesville median sales price was 6.2% above the Q2-2012 level while Albemarle was up 8.4%. “Seeing the steady rise in pricing in most of the localities across Greater Charlottesville is exactly what drives the confidence of both buyers and sellers in achieving their individual property ownership goals,” reports CAAR 2013 President Denise Ramey, GRI. Fluvanna pricing ($185,000) was essentially unchanged with a 0.7% year-over- year decrease. At $198,000, Greene was the only county with significant declines in median sales price, down 16.4% from last year’s level.
  • 3.
  • 4.
  • 5. New Contracts and Inventory Movement The 1,031 new pending sales in the Greater Charlottesville area this quarter represented a 16.7% increase over the 883 in Q2-2012. This is only the fifth time on record that new pending sales reached the 4- digit level, so obviously buyer demand heated up over the first half of 2013. This was the ninth consecutive quarter with year-over-year gains in new contract activity. “In analyzing the results of this quarter, all indicators point to a healthy housing market in our region. The local market has consistently gained momentum over the past few quarters,” adds Denise Ramey. There were 1,420 new listings added in the quarter, 3.7% more than Q2-2012, the third consecutive quarter with increased listing activity. This signifies that potential sellers are coming off the sidelines of late, but the fact that the growth in new contracts is outpacing the growth in new listings could bode well for the health of the market as inventory levels continue to decline. With 11 months of active inventory at the end of June, Greater Charlottesville remains a buyer’s market, but this is down substantially from the 14.5 months of supply level in June 2011. There were 15.6% fewer distressed properties listed throughout the quarter compared to Q2-2012, while the 1,323 non-distressed new listings represented a 5.5% increase. “The heightened activity surrounding high-end purchases is more evidence of a strengthening market. We’ve seen the sales over $1 million nearly double, to 19 sales in Q2-2013 from 10 this same timeframe last year,” says CAAR 2013 President-Elect John Ince. Where do these shifts in new listing and contract activity leave the active inventory level heading into the second half of the year? The 2,179 active listings at the end of the quarter are down 4.8% from the same period last year. This is 14.1% lower than the five-year June 30th average. Nine of every 10 active listings (95.3%) are non-distressed properties. Of active listings, 103 are foreclosures or short sales, 29 fewer than this time last year and 71 fewer than at the end of Q2- 2011 (-40.8%). The 51 active foreclosure listings at the end of Q2 represent a 27.1% decrease from this time last year, and the 52 active short sales are 16.1% lower than Q2-2011. Copyright (c) 2013 RealEstate Business Intelligence, LLC. All Rights Reserved Data Source: CAAR MLS. Statistics calculated July 3, 2013.
  • 6. Days on Market (DOM) As detailed in the 1st Quarter report, homes typically sell faster in the 2nd Quarter than the 1st Quarter, and this year was no exception. In fact, the median DOM of 40 days represents a 57% decrease from the 94-day median DOM of the previous quarter (that’s nearly two months faster). This is the lowest quarterly level for the region in six years and is 20 days lower than the same period last year. The average DOM is down to 117 days, a 33-day improvement over Q2-2012 and 53-day improvement over last quarter. Homes sold fastest in Charlottesville, where the 16-day median DOM for the quarter matched the previous record low back in 2005. This was a 33-day improvement over the 49-day level in Q2-2012. Remarkably, the median DOM for Charlottesville homes sold in June was only eight days, which is actually a day lower than the median DOM in Washington, DC (one of the hottest markets in the county). Albemarle (31 days) experienced a 20-day drop in median DOM compared to Q2-2012. Fluvanna’s median DOM improved slightly (-4 days) to 67 days. Louisa (74 days), Greene (83 days) and Nelson (186 days) each had higher median DOM levels versus Q2-2012. Distressed Sales and Pricing Only 58 of the 815 sales in the 2nd Quarter, or 7.7%, were foreclosures. This represents 11 fewer foreclosure sales versus Q2-2012, when foreclosures accounted for 9.4% of sales. The 31 short sales were two fewer than the same quarter last year and represent an identical share of the sold market at 4.5%. Non-distressed properties accounted for 87.9% of all homes sold, up from 86.1% in Q2-2012. The median sale price for non-distressed sales was up 4.8% from Q2-2012 to $285,000 while the foreclosure median level was up 1.7% to $137,500. The median price for the short sale segment was up 5.6%, to $190,000. Market Share by Bank-Mediated Status Three-Year June Snapshot
  • 7. Detached vs. Attached Homes in Greater Charlottesville Sales of attached homes (condos and townhomes) in the region during Q2-2013 were up 25.5% (+41) to 202 from Q2- 2012. The 613 detached homes sold represented a 7.2% increase from the 572 sold in Q2-2012. At $220,500, the median sales price for attached homes had the largest year-over-year increase, +16.7%, since Q1-2008. Detached homes showed a 4.4% increase in median sales price, up $12,710 to $300,000. Copyright (c) 2013 RealEstate Business Intelligence, LLC. All Rights Reserved Data Source: CAAR MLS. Statistics calculated July 3, 2013. If you plan to sell a home in 2013, be sure to have a REALTOR® prepare a comparative market analysis (CMA) so that you can price it to sell. And, if you are looking to buy, a REALTOR® can help you understand the current market and evaluate your options. This 2013 2nd Quarter Market Report is produced by the Charlottesville Area Association of REALTORS® using data from the CAAR MLS. For more information on this report or the real estate market, pick up a copy of the CAAR Real Estate Weekly, visit www.caar.com, or contact your REALTOR®. All Residential Q2-13 % Q-O-Q Q1-13 % Y-O-Y Q2-12 % Y-O-2Y Q2-11 % Y-O-3Y Q2-10 Average Sales Price (Closed) $330,581 19.4% $276,795 7.0% $309,070 8.2% $305,606 5.0% $314,888 Median Sales Price (Closed) $273,200 20.1% $227,500 6.3% $257,000 6.7% $256,000 3.9% $262,838 Units Sold (Closed) 815 65.7% 492 11.2% 733 20.7% 675 -4.8% 856 Average DOM (Closed) 117 -31.2% 170 -22.0% 150 -19.3% 145 -11.4% 132 Listing Discount (Average) 5.8% 9.1% 7.5% 8.3% 6.1% Ratio Avg SP/Avg OLP 94.2% 91.0% 92.5% 91.7% 93.9% Avg SP/Sq Ft 143 10.9% 129 2.1% 140 3.6% 138 -1.4% 145 Detached Q2-13 % Q-O-Q Q1-13 % Y-O-Y Q2-12 % Y-O-2Y Q2-11 % Y-O-3Y Q2-10 Average Sales Price (Closed) $358,768 20.3% $298,318 6.6% $336,600 7.3% $334,370 3.9% $345,252 Median Sales Price (Closed) $300,000 22.7% $244,500 4.4% $287,290 7.9% $277,950 2.4% $293,000 Units Sold (Closed) 613 58.0% 388 7.2% 572 16.1% 528 -3.5% 635 Average DOM (Closed) 124 -24.8% 165 -19.5% 154 -19.0% 153 -11.4% 140 Listing Discount (Average) 6.4% 9.4% 8.0% 9.1% 7.3% Ratio Avg SP/Avg OLP 93.6% 90.6% 92.0% 91.0% 92.7% Avg SP/Sq Ft 141 11.0% 127 0.7% 140 3.7% 136 -3.4% 146 Attached Q2-13 % Q-O-Q Q1-13 % Y-O-Y Q2-12 % Y-O-2Y Q2-11 % Y-O-3Y Q2-10 Average Sales Price (Closed) $245,045 24.7% $196,498 16.0% $211,263 21.1% $202,289 7.6% $227,642 Median Sales Price (Closed) $220,500 20.2% $183,520 16.7% $189,000 13.7% $194,000 0.2% $220,000 Units Sold (Closed) 202 94.2% 104 25.5% 161 37.4% 147 -8.6% 221 Average DOM (Closed) 98 -48.4% 190 -27.9% 136 -15.5% 116 -10.9% 110 Listing Discount (Average) 4.0% 7.8% 5.6% 5.5% 2.6% Ratio Avg SP/Avg OLP 96.0% 92.2% 94.5% 94.5% 97.4% Avg SP/Sq Ft 149 8.8% 137 4.9% 142 2.1% 146 4.9% 142 RBI Key Housing Trend Metrics [Charlottesville Area Association of REALTORS® (CAAR)]