1. Page | i
Guadalupe Landfill’s
Impacts on the Almaden
Valley Community,
San Jose, California
Guadalupe Landfill’s Impact on Property Values
and Traffic Safety in the Almaden Valley
Community
Richard Su
May, 2011
0
100,000
200,000
300,000
400,000
500,000
600,000
700,000
800,000
900,000
Property Values
5. Page | v
Guadalupe Landfill’s Impacts on the Almaden Valley Community, San Jose, California:
Guadalupe Landfill’s Impacts on Property Values and Traffic Safety in the Almaden Valley
Community
A Planning Report
Presented to
The Faculty of the Department of
Urban and Regional Planning
San Jose State University
In Partial Fulfillment
Of the Requirements for the Degree
Master of Urban Planning
By
Richard C. Su
May, 2011
7. Page | vii
Acknowledgements
First and foremost, I would like to acknowledge my wife Nicole and dedicate this report to her.
Without her encouragement and unwavering support, I would not have been able to complete the
project.
I would also like to acknowledge Dr. Shishir Mathur and Dr. Roxanne Ezzet-Lofstrom. As my
faculty advisors for this project, they provided support, guidance and encouragement as I
navigated through this process.
9. Page | ix
Table of Contents
List of Figures and Tables...................................................................................xi
1 Introduction..................................................................................................1
1.1 Guadalupe Landfill San Jose, CA ...................................................................................................2
1.2 Almaden Valley San Jose, CA ........................................................................................................2
1.3 Relevance of Research..................................................................................................................2
1.4 Determinants of Property Values .................................................................................................4
1.5 Research Question........................................................................................................................4
1.6 Hypothesis.....................................................................................................................................5
1.7 Research Methods ........................................................................................................................5
2 Findings from Related Case Studies...............................................................7
2.1 Landfill Characteristics and Property Values ................................................................................8
2.2 Not in My Backyard (NIMBY) ......................................................................................................11
3 Overview of Landfill Operations..................................................................15
3.1 Daily Landfill Operation ..............................................................................................................15
3.2 Environmental Impacts of Landfills.............................................................................................17
3.3 Social Impacts of Landfills...........................................................................................................18
3.4 Economic Impacts of Landfills.....................................................................................................21
4 Guadalupe Landfill, San Jose, CA.................................................................25
4.1 Guadalupe Landfill: Operation....................................................................................................26
4.2 Guadalupe Landfill: Disposal Tonnages ......................................................................................26
5 Almaden Valley, San Jose, California...........................................................29
5.1 Almaden Valley Neighborhood: Demographics..........................................................................29
5.2 Almaden Valley Neighborhood: Education and Income.............................................................30
5.3 Almaden Valley Neighborhood: Property Values .......................................................................34
6 Resident Survey: Perception on Landfill’s Impacts on Property Values and
Traffic Safety.....................................................................................................37
6.1 Data Source.................................................................................................................................38
6.2 Data Distribution and Collection.................................................................................................38
6.3 Survey: General Demographic and Answers from Respondents................................................38
10. Page | x
6.4 Survey: Neighborhood Evaluation ..............................................................................................39
6.5 Survey: Awareness of Landfill Existence.....................................................................................39
7 Survey Analysis: Two-Factor Chi Square Analysis ........................................41
7.1 Years of Residency and Landfill’s Impact on Property Value......................................................41
7.2 Years of Residency and Landfill’s Impact on Traffic Safety.........................................................42
7.3 Age and Landfill’s Impact on Property Values ............................................................................44
7.4 Age and Landfill’s Impact on Traffic Safety.................................................................................45
7.5 Race and Landfill’s Impact on Property Values and Traffic Safety..............................................46
7.6 Number of Children and Landfill’s Impact on Property Values and Traffic Safety .....................48
7.7 Aware of Landfill Existence and Landfill’s Impact on Property Values and Traffic Safety..........50
8 Conclusion ..................................................................................................53
Bibliography .....................................................................................................59
Appendix ..........................................................................................................63
11. Page | xi
List of Figures and Tables
List of Figures
Figure 2.1 Residents’ Perceptions on Landfill Impacts Based on Distance……………….........7
Figure 4.1 Guadalupe Landfill Location…………………………………………………………25
Figure 4.2 Guadalupe Landfill Accepted Waste Tonnage 2006-2007…………………………..27
Figure 4.3 Top Seven Jurisdictions Sending Waste to Guadalupe Landfill …………………….28
Figure 5.1 Age Groups in Almaden Valley in Year 2000 Census…….…………………………29
Figure 5.2 Locations of Almaden Valley and Three Surrounding Neighborhoods…………..…30
Figure 5.3 Income Levels in Almaden Valley in Year 2000 Census…………………………….32
Figure 5.4 Median Income Comparisons in Year 2000 Census………………………………....33
Figure 5.5 Occupation Types Held by Almaden Valley Residents…...........................................33
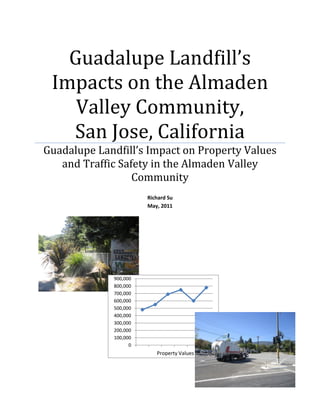
Figure 5.6 Selling Price Comparison of Houses Near and Away from the Landfill………..…34
Figure 6.1 Map of Guadalupe Landfill and Areas Covered by the Survey……………………...37
Figure 7.1 Years of Residency and Landfill’s Impact on Property Values……..……………….42
Figure 7.2 Years of Residency and Landfill’s Impact on Traffic Safety……...…………………43
Figure 7.3 Ages and Landfill’s Impact on Property Values……..………………………………44
Figure 7.4 Ages and Landfill’s Impact on Traffic Safety.....…..………………………………...45
Figure 7.5 Races and Landfill’s Impact on Property Values……...……………………………..46
Figure 7.6 Races and Landfill’s Impact on Traffic Safety……...………………………………..47
Figure 7.7 Number of Children and Landfill’s Impact on Property Values……..………………48
Figure 7.8 Number of Children and Landfill’s Impact on Traffic Safety……...………………...49
Figure 7.9 Informed of Landfill Existence and Landfill’s Impact on Property Values……...…..50
Figure 7.10 Informed of Landfill Existence and Landfill’s Impact on Traffic Safety……..……51
List of Tables
Table 5.1 Population and Education Comparisons with Surrounding Neighborhoods………….31
Table 5.2 Poverty Levels Comparisons with Surrounding Neighborhoods……………………..31
Table 5.3 Selling Price Comparison of Houses Near and Away from the Landfill…………..…35
13. Page | 1
1 Introduction
A landfill is an undesirable facility within a community, and generally residents will avoid
living near an active landfill. In the past, landfills were often located in rural areas far away
from residential developments. However, urban sprawl and the need for additional living
space have forced some residential neighborhoods closer to undesirable amenities such as
landfills, highways, and power plants. A local landfill has many tangible and intangible
impacts on a community. Generally, people associate landfill operations with unsanitary
conditions, filthy equipment, and poorly maintained buildings. A landfill can generate
unpleasant odors, excessive noise, and contribute to air and water pollution. A landfill can
also be a traffic safety hazard due to its use of heavy equipment operation and to the high
traffic volume entering and leaving the facility. A landfill is not a desirable amenity for
creating or maintaining a quality living environment. It is a challenge for city planners to
propose and develop facilities, such as landfills, and highways without facing community
opposition. It is also a difficult task to balance between implementing undesirable facilities
that must meet social needs and maintaining a desirable quality of living standard for
residents.
The impacts of landfills on surrounding communities have been studied by many scholars
and researchers. The focus of the research varies depending on each researcher’s expertise.
The focus can be environmental, sociological, or economical. Understanding the various
environmental impacts helps researchers understand the short-term and long-term effects of
landfills on the environment, as well as understand whether alternatives and improvements
may be developed and implemented to address them. Identified environmental impacts often
require long-term research on the biological and chemical changes affecting the physical
environment and natural resources. Identification of social impacts helps researchers
understand the role that landfills play in urban planning and community development. In
Alabama, local residents organized activities to oppose landfill operation, because waste
trucks were driving by community centers and daycares where families and young children
were constantly present.1
Generally, researchers focus on the local population’s perceptions
of landfill development and the impacts on surrounding communities. Understanding the
economic impacts helps researchers to estimate the economic advantages and disadvantages
of including a landfill as part of the selected residential neighborhoods. These economic
advantages and disadvantages cover many areas, such as revenue generation from landfill
operation, insurance cost, property taxes, and property values. These economic effects are
often evaluated based on results from economic models and formulas.
1
Catherin A. Solheim, Charles E. Faupel, Connor Bailey, “Solid Waste Management and the Need for Effective
Public Participation,” Southern Rural Sociology 13, no. 1 (1997): 65-88.
14. Page | 2
1.1 Guadalupe Landfill San Jose, CA
The proposed research examines certain economic and social impacts of Guadalupe Landfill
located in San Jose, California. Specifically, the research focuses on the landfill’s effects on
local property values and on traffic safety. This research focuses primarily on the residents’
perceptions of the impacts that Guadalupe Landfill has on their property values and the
impacts on local traffic. Three landfills operate within the City of San Jose jurisdiction:
Newby Island Landfill, Zanker Landfill, and Guadalupe Landfill. Newby Island Landfill and
Zanker Landfill are located in the northern part of San Jose, near Alviso and the city of
Milpitas. These two landfills are located far away from surrounding neighborhoods and are
accessible from Interstate 880 and State Route 237. Guadalupe Landfill, however, is located
near Almaden Valley, with landfill traffic (garbage trucks) using the surface streets:
Guadalupe Mines Road, Coleman Road, and Camden Avenue. Guadalupe Landfill probably
causes more traffic safety concerns than the other two landfills because trucks have to drive
through residential communities to reach the landfill.
1.2 Almaden Valley San Jose, CA
The Almaden Valley neighborhood is considered one of the more affluent neighborhoods in
the city of San Jose. The residents are likely to be concerned about the traffic safety and
property values within the neighborhood because of the location and operations of Guadalupe
Landfill. The residents’ opinions concerning Guadalupe Landfill should interest planners
and potential homeowners. The proposed research includes a survey that was mailed to each
residence within one mile of the Guadalupe Landfill. The survey questions focus on
residents’ perceptions of the landfill’s impacts on property values and traffic safety. The
results of the proposed research provide insight for metropolitan city planners considering
developing residential communities near an undesirable amenity such as a landfill. The
research can also be a valuable reference for potential homebuyers considering the purchase
of a home in one of the communities with such an undesirable amenity nearby.
1.3 Relevance of Research
Landfill site selection and operation often generate cumulative community opposition
because the public perceives landfill as an undesirable amenity for a community. Having a
landfill near a neighborhood is often unattractive to potential residents and businesses
because of the negative impacts on traffic safety and property values. Local communities
also do not like to absorb the cost to maintain a landfill. Although a landfill is an undesirable
facility, a community’s perceptions concerning the impact that its local landfill has on the
surrounding area are often inaccurate or over-estimated. In the study led by McClelland,
residents usually overestimated their own health and environmental risk involved in living
15. Page | 3
near an undesirable facility.2
In the study, it was found that simple measures such as odor
prevention could significantly prevent or minimize property value losses. Individuals’
feelings and perceptions toward an “undesirable facility” near their property are likely to be
influenced by their expectations, experiences, and social or family status. Landfill site
selection and operation affects many social and environmental categories. As a result, the
perceptions are often varied among residents, as one group of residents may feel strongly
about social impacts while another group of residents is more concerned about environmental
impacts. The number and variety of objections often prolongs the landfill selection and
implementation process.
Many motivate communities to oppose landfill developments or are reluctant to live near a
landfill. In the social realm, the attitude and reaction motivated by negative perceptions
among the local population toward an unwanted development, such as a landfill, are often
referred to as NIMBYism (Not in My Back Yard). NIMBY movements often interrupt or
prolong the decision and implementation process for developments perceived as a disamenity
by NIMBYs. Other social considerations in the landfill planning process include the
potential impacts on property values and traffic safety. Environmentally, communities are
concerned with the potential degradation of air and water quality because of the emissions
from landfills. In order to avoid or minimize community opposition, the government and
involved industries tend to site undesirable facilities in communities that have minimal
political or economic clout.3
As a result, undesirable facilities, including landfills, often end
up in less privileged communities. In North Carolina, many landfills are located in
communities of color and low-wealth neighborhoods.4
However, Guadalupe Landfill is a
unique case because it is located in an affluent neighborhood, where waste collection trucks
only have access through a narrow and winding two-way surface street. The proposed
research examines the community’s perceptions of Guadalupe Landfill’s effect on traffic
safety and property values.
Guadalupe Landfill has some geographic characteristics that generate high traffic volumes
and potential traffic safety concerns. Guadalupe Landfill sits near the Almaden Valley
community where many residential and light commercial developments occupy the area.
Guadalupe Mines Road is a narrow and winding two-way street. Every day many waste
collection trucks drive through the community to go to or from the landfill. Living near a
landfill with high truck traffic volume could create traffic safety concerns among residents
2
Gary H. McClelland, William D. Schulze, Brian Hurd, “The Effect of Risk Beliefs on Property Value: A Case
Study of a Hazardous Waste Site,” Society of Risk Analysis 10, no. 4 (1990): 485-497.
3
L. Gallagher, S. Ferreira, F. Convert, “Host Community Attitude Toward Solid Waste Landfill Infrastructure:
Comprehension Before Compensation,” Journal of Environmental Planning and Management 51, no. 2 (March
2008): 233-257.
4
Jennifer M. Norton, Steve Wang, Hester J. Lipscomb, Jay S. Kaufam, Stephen W. Marshall, Altha J. Cravey,
“Race, Wealth and Solid Waste Facilities in North Carolina,” Environmental Health Perspective 115, no. 9
(September 2007): 1344-1350.
16. Page | 4
who must share the road. High traffic volume, along with the presence of many, large waste
collection trucks, often generates a perception of degraded or reduced traffic safety, or of
degraded road quality. Traffic safety near and around landfills is a concern for the
community and the waste industry as accidents and fatalities due to careless operation could
result.
1.4 Determinants of Property Values
Property values are often determined by nearby facilities and services. In general, a
property’s value will increase or hold firm if there are desirable facilities and services, such
as green spaces and good public schools, nearby. Desirable facilities and services include
green space located within the community or public services, such as library, accessible
public transit, and schools. Other intangible factors, such as privacy and safety, also
influence property values. By contrast, undesirable facilities and services sited near a
community usually undermine property values in that community. Undesirable facilities
include landfills, electrical lines, electrical towers, and highways. Landfills create problems
such as water contaminations, air and noise pollution, degraded traffic safety, unpleasant
odors, and pest infestation. Therefore, residents often view landfills as negatively
influencing their living standards and property values. In addition, residents’ perceptions are
heavily influenced by the size of landfill; many residents believing that larger landfills have
greater and longer impacts on their community compared to smaller landfills.5
The impact
that a local landfill has on property values cannot be generalized. Landfills may not have the
same magnitude of impact on all home prices within the same neighborhood.6
The actual
price is also affected by a home’s type and square footage. The houses near Guadalupe
Landfill are mostly single-family homes and possibly built after the landfill’s existence.
Nearby residents may view the Guadalupe Landfill as having a negative impact on their
property values.
1.5 Research Question
Despite California having the most aggressive environmental regulations to divert most
waste away from landfills, the state’s increasing population and housing demands are forcing
the need to allocate new landfills. The increased demand for new homes along with
unavailability of good and buildable land, is forcing more housing developments to be built
near landfills. If residents view Guadalupe Landfill as negatively impacting their traffic
safety and property values, then how could planners avoid similar issues in new development
5
Jong S. Lim, Paul Missios, “Does Size Really Matter? Landfill Scale Impacts on Property Values,” Applied
Science Letter 14 (2007): 719-723.
6
Arthur C. Nelson, John Genereux, Michelle M. Generux, “Price Effects of Landfills on Different House Value
Strata,” Journal of Urban Planning and Development 123, no. 3 (September 1997): 59-67.
17. Page | 5
as the population grows? Conversely, if residents do not perceive Guadalupe Landfill as
negatively impacting their lives, could planners use this case as an example to site other
residential neighborhoods near landfills or other undesirable amenities?
How does the Almaden Valley community view Guadalupe Landfill’s impacts on traffic
safety and property values? Do demographic differences contribute to the residents’
perceptions on Guadalupe Landfill’s impacts on traffic safety and property values? The goal
of the research is to identify the residents’ perceptions of the impacts that the Guadalupe
Landfill has on property values and traffic safety. The targeted residents are those who live
within one mile of the Guadalupe Landfill. The research examines whether residents feel
that living near Guadalupe Landfill has an adverse effect on their property values that may
place homeowners at a disadvantage should they decide to sell their properties. The research
outcomes provide planners and potential homeowners insight into the relationships between
undesirable facilities and the perception of these facilities’ effects on surrounding
communities.
1.6 Hypothesis
Guadalupe Landfill is located on a hill with a two-lane, winding street as the only access to
the landfill. Residents may have strong opinions concerning traffic safety, since the
neighborhood has a high volume of large waste collection trucks driving through it. It is
highly possible that residents could have a strong negative feeling toward Guadalupe Landfill.
However, it is also possible that residents do not feel Guadalupe Landfill has an adverse
effect on property values and traffic safety. Guadalupe Landfill is located on a hill, which is
not highly visible from nearby communities. Therefore, it is possible that residents are not
even aware of the existence of Guadalupe Landfill. Regardless of the residents’ perceptions
or acceptance of Guadalupe Landfill, the outcome of the research should provide insight for
city planners and government when considering issues regarding residential communities
coexisting with undesirable facilities.
1.7 Research Methods
The research examines the residents’ perception of Guadalupe Landfill’s impacts on property
values and traffic safety in the surrounding community. Other reliable and accountable
scholarly publications are included that examine potential factors, such as landfill
characteristics and NIMBYism, that can influence residents’ perceptions of Guadalupe
Landfill. The research reviews the general landfill operations including environmental,
social, and economic impacts. In addition, the research reviews the operational
characteristics of Guadalupe Landfill and the demographic characteristics of the Almaden
Valley community. A survey was mailed to selected residential properties that lie within the
1-mile distance from the landfill to conduct the analysis on residents’ perceptions of living
18. Page | 6
near Guadalupe Landfill. Approximately 525 surveys were mailed and 107 surveys were
returned. Responses from the surveys were compared and studied. The conclusions are
presented here.
19. Page | 7
2 Findings from Related Case Studies
Many researchers and scholars have published their findings concerning the impacts of
landfills on surrounding communities. Researchers have used surveys, or quantitative
models such as hedonic regression, to estimate the impact of a landfill on property values.
Surveys used to study residents’ perceptions of the impacts of landfills have focused
primarily on local residents’ experiences with and perceptions of landfill operations and how
the operations appear to affect their local communities.
Several challenges confront the researcher studying the impacts of landfills on surrounding
communities. Limited data availability is the primary issue. Although landfills have
significant impacts on the environmental, social, and public health quality of surrounding
communities, residents who live farther away from a landfill might not feel as strongly about
the landfill as those who live closer to the facility. Therefore, the study area for the research
rarely extends beyond two miles from the selected landfill. If given a scale of 1 to 5 and
assuming 5 means the strongest and 1 means the weakest feeling of perceptions on landfill
impacts, Figure 2.1 reflects a study led by Reichert on the residents perception of landfill
impacts based on the distance of their property to the local landfill.7
Figure 2.1 Residents’ Perception of Landfill Impacts.
Source: Chart prepared by author based on Reichert’s article “The Impact of Landfills on Residential Property
Values” published in The Journal of Real Estate Research.
7
Alan Reichert, Michael Small, Sunil Mohanty, “The Impact of Landfills on Residential Property Values,” The
Journal of Real Estate Research 7, no. 3 (1992): 297-314.
0
1
2
3
4
5
6
0.5 miles 1 miles 1.5 miles 2 miles 2+ miles
Residents'Perceptions
5=Strongestand1=Weakest
Distances from the Landfill
Residents' Perception On Landfill Impacts
Based on Distance of Landfill to Property
Residents' Perception On
Landfill Impacts
20. Page | 8
As the resident lives further away from the local landfill their perceptions on landfill impacts
diminish, because there could be other tangible factors, such as other undesirable facilities
for instance, highways, and electrical towers that may influence residents’ perception on the
quality of their neighborhood. It may also be a simple “Out of sight out of mind” mentality
that since residents’ cannot see the landfill, they do not feel a landfill has any impact on their
neighborhood. So residents’ feelings and perceptions concerning the local landfill’s impact
diminishes as the distance between the landfill and their property increases.
Another challenge is determining the magnitude and legitimacy of landfill impacts. If the
selected community has other undesirable facilities, such as highways or electrical towers, in
addition to a landfill, then it is difficult to determine whether any property value depression
or decline in traffic safety is directly linked to the presence of the landfill. Therefore,
researchers including Arthur Nelson et al., argue that a landfill’s impact on property values
cannot be generalized. The magnitude of impact on any given property value also depends
on housing type and the value of the house. Nelson argues that higher-priced homes decline
quicker by comparison to lower- or medium-priced homes in the same neighborhood.8
The
magnitude and legitimacy of landfill impacts can be difficult to determine, especially if it is
based on perceptions instead of legitimate data and quantitative models.
The related case studies found for this research have shown that there is still a disparity
between actual landfill operation and the general public perceptions. A landfill can generate
unpleasant odors, as well as excessive noise, air, and water pollution. A landfill can also be a
traffic safety hazard because of heavy equipment operation and high traffic volume. In
Taylor’s study on the public perception of landfill operation, Taylor cites that the State of
Virginia successfully improved its landfill operation and maintenance over the years by
installing pipes to extract methane, training workers to be more responsive to hazardous
situations and restricting landfill sites to avoid environmental and public health issues.
However, despite these improvements the study has shown that there is still a gap between
residents’ perceptions and the actual health and economic risk of the newly improved
landfills.9
The related case studies have identified landfill characteristics such as size and
distance and NIMBYism as factors that influence residents’ perceptions on landfill impacts
on nearby communities.
2.1 Landfill Characteristics and Property Values
Research and case studies have been published focusing on landfills’ impacts on property
values. The studies’ methodology varies, depending on the researchers’ expertise. It could
8
Arthur C. Nelson, John Genereux, Michelle M. Generux, “Price Effects of Landfills on Different House Value
Strata,” Journal of Urban Planning and Development 123, no. 3 (September 1997): 59-67.
9
David Taylor, “The Economic and Environmental Issues of Landfills,” Environmental Health Perspectives
107, no. 8 (August 1999): 404-409.
21. Page | 9
be an economic analysis, in which the researcher examines property values using quantitative
data. It could also be a social analysis, in which the researcher looks for links between public
health impacts and property values. The published research and case studies lead to the
following range of conclusions as to whether landfills have any impacts on surrounding
property values: No Impact, Negative Impact, and Positive Impact. In addition, these
conclusions are affected by the following landfill characteristics:
Landfill size: The size of the landfill has a significant influence on residents’
perceptions of that landfill’s impacts on their community. Residents feel that larger
landfills have more adverse and longer lasting impacts on their community.
Research led by Lim and Missios used a regression model to compare two landfills
in Toronto, Canada, in which the landfill that accepts more waste has greater effects
on surrounding property values because residents perceive larger landfills have
greater nuisances. In addition, Lim and Missios argue that larger landfills have a
greater impact on property values because of greater social, operational, and other
external costs.10
Larger landfills accept more waste, run more trucks and equipment
vehicles, and generate more pollutants. Therefore, residents feel that larger landfills
have greater impact on local property values and traffic safety. For smaller landfills,
residents may feel the impacts resulting from the presence of a landfill are minimal
or nonexistent.
Landfill distance: The distance between the landfill and the community also has a
significant influence on residents’ perceptions of the landfill’s effects on their
community. Residents who live closer to the landfill are likely to see more waste
collection trucks and equipment driving through their neighborhood. Residents are
also likely to detect changes in air quality in the forms of odor and dust emanating
from the landfill. A study led by Gallagher finds that distance is a key factor in
residents’ perception of effect on property value and health risks. The author
suggests that environmental concerns motivate residents who are closer to the
undesirable facilities to perceive that facility as having a negative impact.11
Therefore, residents who live within the two miles radiuses to the landfill are likely
to feel very strongly about the negative impacts of that landfill compared to residents
who live farther from the landfill. Usually, residents who live farther from a local
landfill do not share the same level of concerns with residents who live closer to the
landfill.
10
Jong S. Lim, Paul Missios, “Does Size Really Matter? Landfill Scale Impacts on Property Values,” Applied
Science Letter 14 (2007): 719-723.
11
L. Gallagher, S. Ferreira, F. Convert, “Host Community Attitude Toward Solid Waste Landfill Infrastructure:
Comprehension Before Compensation,” Journal of Environmental Planning and Management 51, no. 2 (March
2008): 233-257.
22. Page | 10
Landfill type: There are several types of landfills. The most common type of landfill
accepts municipal waste and recyclable materials. However, other landfills
specialize in treating and handling chemical, hazardous, and medical wastes. It is
possible that a landfill that treats and handles special wastes is likely to face stronger
community opposition due to the perceived increase in public health risks to the
people living near these landfills.
Active versus closed landfill: Living near an active, as opposed to a closed, landfill
also influences residents’ perceptions of the landfill’s impacts. Living near a closed
landfill does not mean that residents’ perceptions are lukewarm or that they simply
do not care. A landfill can still have long-term effects after it no longer accepts
wastes. A closed or abandoned landfill may have more severe impacts than an
active landfill, especially if it is not managed properly. Some of the closed or
abandoned landfills are classified as Superfund sites by the federal or state
Environmental Protection Agency (EPA), which means the site, has been severely
polluted and is unsuitable for residential developments. A landfill that is classified
as a Superfund site is expected to have long-term effects on the residents’ property
values and health quality. A multiple regression study conducted in Massachusetts
and led by Bouvier, compares six different landfills by size, operating status, and
history of contamination. The result reveals that only one landfill has a significant
impact on surrounding property values, and this site is also on the EPA “Potential
Health Risk” list.12
The landfill in the Massachusetts study is no longer accepting
waste, but its reputation and effects still impact the surrounding communities today.
On the other hand, a closed or abandoned landfill that is managed properly may
actually produce a positive effect on the surrounding property values. A closed or
abandoned landfill means an opportunity for redevelopment. If the government or
waste industry can transform closed or abandoned landfills into parks, wildlife
sanctuaries, recreational areas, or other public service facilities, then the result could
mean a positive impact on the property values and the living quality for the residents
of the surrounding communities.13
The perceptions of a landfill’s impacts on surrounding communities might not be entirely
accurate. Most of the research and case studies concluded that residents perceive that a
nearby landfill has adverse effects on surrounding communities and property values.
Although the reasons that local residents do not appreciate having a landfill near their
neighborhood are understandable and their concerns are legitimate, it is important to consider
12
Rachel A. Bouvier, John M. Halstead, Karen S. Conway, Alberto B. Manalo, “The Effect of Landfills on
Rural Residential Property Values: Some Empirical Evidence,” The Journal of Regional Analysis & Policy 30,
no. 2 (2000): 23-37.
13
E. Kavazanjian, Department of Civil and Environmental Engineering, “Sustainable Redevelopment of Former
and Abandoned Landfills: Lessons from Practice,” (Arizona: Arizona State University, 2007).
23. Page | 11
that the technology and management in landfill operations have significantly improved from
the past. McClelland shows that residents sometimes overestimate the negative effects of
landfills.14
Separate research conducted by Taylor that concerns a landfill in the state of
Virginia shows a disparity between actual landfill operations and public perceptions. One of
the major disparities was residents perceived the landfill as a source of water pollution
without knowing that the State of Virginia had installed state-of-the-art piping system to
extract excessive water and leachate from the landfill.15
The public may perceive a local
landfill as a negative factor, but in some cases a local landfill can actually benefit the
surrounding communities. Parker argues that if landfills are well designed and can
implement state-of-the-art technology, they might contribute to positive land values through
host community fees, revenues, jobs, and reliable waste services. As a result, a well-
designed landfill could have positive impacts on property values.16
After a landfill is closed
it can contribute to the surrounding communities by being transformed into parks, sports
facilities and other community service amenities. Kavazanjian notes that landfill
redevelopment can have environmental, economic, and social benefits by isolating waste
from the environment, generating revenue and providing community recreation activities.17
Landfill characteristics still have significant influence on a local landfill’s impact on
surrounding property values. However, it is important that the local residents need to be
educated and informed so they can make effective contribution to the landfill development
and implementation.
2.2 Not in My Backyard (NIMBY)
Not-In-My-Backyard (NIMBY) refers to an attitudinal or philosophical stand that a local
community takes against unwanted developments that are introduced to their community.
NIMBYism can be provoked by personal perceptions that determine a community’s
acceptance of an existing or proposed landfill. Personal perceptions are formed based on
experiences, stereotypes, political and social beliefs, and other engagements. The NIMBY
concept is considered a grass roots movement that started as early as 1970s. Melosi states
that the modern environmental movement that started in the 1960s also helped to shape the
NIMBY movement concerning various environmental issues. The NIMBY movement
started when the American public was concerned about toxic pollution, such as lead
14
Gary H. McClelland, William D. Schulze, Brian Hurd, “The Effect of Risk Beliefs on Property Value: A Case
Study of a Hazardous Waste Site,” Society of Risk Analysis 10, no. 4 (1990): 485-497.
15
David Taylor, “The Economic and Environmental Issues of Landfills,” Environmental Health Perspectives
107, no. 8 (August 1999): 404-409.
16
Bruce J. Parker, “Solid Waste Landfills and Residential Property Values,” National Solid Waste Management
Association Washington D.C (2003): 1-6.
17
E. Kavazanjian, Department of Civil and Environmental Engineering, “Sustainable Redevelopment of Former
and Abandoned Landfills: Lessons from Practice,” (Arizona: Arizona State University, 2007).
24. Page | 12
poisoning and exposure to pesticides and it was soon moved from NIMBY to Not-In-
Anyone’s-Backyard (NIABY).18
A NIMBY movement often starts or is organized by local community members who are
concerned about certain developments or policies related to their community. It is often
provoked by a sense or belief that the rights of the individual have been neglected or violated.
NIMBYism can take the form of a protest against governments or industries through the
organizing of action groups led by the local residents. This response by the local population
derives from a variety of reasons ranging from a sense that they are been overrun by the
authorities or industry to a genuine concern for the health and safety of residents of the
community.19
Therefore, a NIMBY movement targeting a certain issue or policy might be
promoted by various groups with diverse agendas. As a result, NIMBY movements include,
but are not limited to, protests, rallies, and collecting signatures for ballot measure
propositions to support or delay some project’s implementation.
NIMBYism has drawn praise as well as criticism. NIMBY advocates view NIMBYism and
a NIMBY movement as a platform to engage in the political, and urban planning decision
processes. They see the movement as a bridge builder between the community and the
government to enhance understanding and cooperation. Solheim argues that public
involvement can lead to improved decisions, promote environmental awareness and reduce
the likelihood of divisive conflict. The local population can be involved from the early stage
of facility planning and continue throughout a facility’s operational life.20
A NIMBY
movement might promote dialogue between the involved parties to build mutual
understanding. However, it can also delay or prevent authorities and participants from
reaching a mutual agreement to resolve landfill site selection and operation issues.
NIMBY opponents see NIMBY movements, or NIMBYism, as a sign that the planning
process is broken or ineffective. Slevin and Burnaman argue that, in a sense, NIMBYism is
not a true civic participation in a democratic environment, because the existence of
NIMBYism means meaningful citizen participation is being excluded in the decision-making
process.21
In Slevin and Burnaman’s opinion, NIMBY movements and NIMBYism exist
because the channel and platform for the local community involvement is either taken away
or has not been utilized. On the other hand, government authorities and the waste industry
oppose NIMBY movements and NIMBYism because they believe that NIMBYs interrupt
18
Martin V. Melosi, “Equity, Eco-racism and Environmental History,” Environmental History Review 19, no. 3
(1995): 1-16.
19
Encyclopedia of Earth, “NIMBYism,” (no date), http://www.eoearth/org/article/NIMBYism (accessed
February 14, 2010).
20
Catherine A. Solheim, Charles E. Faupel, Conner Bailey, “Solid Waste Management and the Need for
Effective Public Participation,” Southern Rural Sociology 13, no. 1 (1997): 65-88.
21
Patrick Slevin, Ross S. Burnaman, “A Discussion: NIMBYism,” The Florida Bar Journal 78, no. 2 (February
2004): 38-39.
25. Page | 13
and delay project implementation. Therefore, NIMBY opponents, such as local governments
and involved industries, perceive NIMBYism and NIMBY movements as unconstructive
community participation.
NIMBY participants may have different agendas and motivations, even within their
collective efforts. Concerning landfill planning and operation, some may feel strongly about
landfills and their potential environmental consequences. Others are highly concerned about
economic consequences such as lowered property values and the additional financial
obligations to maintain the facility. The agendas and motivations in NIMBY movements are
based on two major components in NIMBYism: environmental justice and social justice.
Environmental justice: In landfill planning and operation, environmental justice
focuses on the rights of the local population to adequate quality of environmental
factors, such as clean air and water. It also focuses on eliminating exposure to
unwanted environmental pollution, including noise and air pollution. Therefore, the
focal points in environmental justice in NIMBYism accentuate the issues of humanity
and equity. Bullard defines environmental justice as the embracing of the principle
that all people and communities are entitled to equal protection of environmental and
public health laws and regulations.22
The environmental justice in NIMBYism often
focuses on the environmental quality of the host community and the potential cost to
maintain such environmental quality. The host community is more concerned about
the direct impact a local landfill would have on their health and safety instead of
potential impacts that might be miles away, caused by landfill runoffs or emissions.
Therefore, the environmental justice movement concerning landfill selection and
operation focuses more on the local and regional impacts. In addition, a NIMBY
movement focusing on environmental justice often requires a long- term commitment
by its members to be involved and stay current with the issues, because the magnitude
of impacts from a landfill might take years to evolve, especially when the
contamination source is underground and difficult to track. A research conducted by
Christenson and Cozzarelli on the Norman Landfill, a closed landfill in Oklahoma,
found leachate percolating into the underground water and contaminating the water
resource even several years after the landfill had stopped accepting waste.23
Environmental justice in landfill issues often requires the long-term commitment of
human and financial resources because of the cost associated with landfill operation
and management. Therefore, it is critical that the local community has a channel or
platform to participate in the decision-making process.
22
Robert D. Bullard, “Environmental Justice: It’s More Than Waste Facility Siting,” Social Science Quarterly
77, no. 3 (September 1996): 493-499.
23
Scott C. Christenson, Isabelle M. Cozarelli, “The Norman Landfill Environmental Research Site: What
Happen to the Waste in Landfills?,” USGS (August 2003): 1-4.
26. Page | 14
Social justice: Social justice generally focuses on public health and financial issues
such as pest control and the costs for landfill maintenance during the landfill planning
and operation process. Social justice in landfill issues often involves racial issues and
low- income communities. Merritt, who compares the three case studies in Alabama
points out that limited resources make poorer communities more vulnerable to protect
their social and living quality such as safer streets or quiet neighborhoods. As a result,
“not in my back yard” was transformed into “put it in the black’s yard” as many of
these unwanted land uses came to be located in communities of color.24
Therefore,
social justice in landfill issues are sometimes transformed into debates on resource
distribution and equality since color and low- income communities are targeted.
These communities usually have limited resources to protect their social and living
quality. Another study also shows that landfills are more likely to be located near
poor and less privileged communities. The research led by Norton finds that landfills
are disproportionately located in communities of color and low wealth in North
Carolina.25
It is not uncommon for the targeted communities to be excluded from the
landfill planning process. A study led by Solheim relates that local residents
organized a NIMBY movement because their social rights were excluded. The eight
case studies presented here provide concrete evidence that excluding the public from
the siting approval process is likely to result in a negative response to the proposed
solid waste facilities.26
Social justice in NIMBYism is a sensitive subject, especially
when the targeted communities may feel that they are being taken advantage of when
asked to absorb the social and environmental consequences of landfill operation,
while other communities reap the benefits of shipping their waste elsewhere.
Although environmental and social justice components each have a different focus area in
landfill planning and operation, the mutual objective is to ensure community members have
proper channels to voice their concerns, questions, and complaints. In addition, community
members should have an opportunity to vote to either support or oppose the landfill’s
development near their community. Environmental and social justice components might
have different focus areas; however, they are interconnected during landfill planning and
operation. It is difficult to focus simply on one without considering the other.
24
Lani Merritt, “Common Cause: A Comparative Case Study of Three Alabama Communities Organizing
Against Landfills,” Southern Rural Sociology 17, no. 1 (2001): 134-158.
25
Jennifer M. Norton, Steve Wang, Hester J. Lipscomb, Jay S. Kaufam, Stephen W. Marshall, Altha J. Cravey,
“Race, Wealth and Solid Waste Facility in North Carolina,” Environmental Health Perspective 115, no. 9
(September 2007): 1344-1350.
26
Catherine A. Solheim, Charles E. Faupel, Conner Bailey, “Solid Waste Management and the Need for
Effective Public Participation,” Southern Rural Sociology 13, no. 1 (1997): 65-88.
27. Page | 15
3 Overview of Landfill Operations
Landfills are still the primary method for handling municipal wastes. Production efficiency
has significantly improved since the industrial revolution. Commodities are produced at a
cheaper, faster, and more massive pace. In addition, materials such as plastic and rubber are
used in many products to enhance quality. Therefore, more and more wastes are been
generated. In the past, landfills were located in rural areas, away from their communities.
Landfills were poorly managed, which resulted in filthy and unsanitary conditions. However,
landfill management technology and regulations have improved significantly over the years
to ensure landfill operations are efficient, effective, and safe. In the past, noise, air pollution
and water pollution were some of the major challenges in operating a landfill. However,
technologies such as sound barriers are used to minimize noise. Some of the waste
companies attempt to be environmental friendly by running equipment on renewable or clean
energy to minimize air pollution and emission. Leachate is the liquids that drain from
landfills and it is a primary pollutant to any water resource near a landfill. Piping system is
installed to extract excessive water and leachate. Regardless of these improvements, landfills
are still ranked as one of the highest unwelcome developments in urban planning.
The resentment toward landfill development near communities could come from not
understanding the improvements in landfill operation and safety measures. Daily landfill
operation is carried out under the guidance of various federal and state regulations. The
regulations ensure landfill management and workers track the daily activities of landfill
operation, such as accepted tonnage and material types. Landfills are required to implement
monitoring and treatment mechanisms to treat and test water, and to treat and test methane
and other byproducts from the landfill before their discharge into the environment. Further,
in California, landfill management teams must ensure landfill activities and operations
comply with Occupational Safety and Health Administration (OSHA) and California
Environmental Quality Act (CEQA) regulations. The purpose and goal of these regulations
are to ensure landfill operations are socially and environmentally safe.
3.1 Daily Landfill Operation
Landfills are constructed to ensure minimal environmental impact. Workers in water trucks
spray water daily on interior roads and on the landfill site to control dust and debris. Sound
barriers minimize noise. Pipe systems collect leachate and methane. Leachate is collected
and treated before discharge into the sewage system. Methane is collected and used to power
landfill vehicles. Landfill workers and personnel are required to attend regularly scheduled
training sessions on safety, landfill operation, environmental control, and emergency
response. Besides the mechanisms installed to provide quality environmental control, the
daily landfill operations follow a set procedure, which includes weighing, spreading,
covering, and material recovery.
28. Page | 16
Weighing and checking: Each waste collection vehicle is weighed at a scale house at
the landfill entrance. The vehicle is weighed to ensure the total waste tonnage does
not exceed the permitted daily tonnage limit. In addition, the load is checked to
ensure no chemical, hazardous, or other unacceptable wastes are included in the load.
Spreading and compacting: Bulldozers spread and compact the waste in layers after
the load is checked and unloaded. Spreading and compacting waste saves valuable
landfill space and eliminates voids where rodents might find harborage. Generally,
the layer is spread and compacted at about 2 feet and the process continues to repeat
until the layer reaches the height between 8 and 10 feet.27
Covering: At the end of the spreading and compacting process, bulldozers cover the
area with approximately 6 feet of soil.28
The covering is to keep insects, rodents, and
birds away, to control odor and to prevent rainfall from penetrating through the layers.
Rainfall that penetrates through the layers is likely to become acidic or toxic because
of mixing with the covered waste. Alternative covering materials besides soil are
mulch, sand, pebbles, and shredded green waste.
Material recovery: Typically, the landfill company attempts to recover recyclable
materials, such as paper, cardboard, green waste, construction waste, aluminum, glass,
and plastic, to prevent its addition to the landfill. Material recovery generates another
revenue source for the waste company because these materials can be separated,
grouped, and graded for resale to other vendors. Keeping recyclable materials away
from the landfill also saves valuable landfill space. Landfill personnel prefer to
recover materials at an early stage before waste collection vehicles reach the landfills.
Therefore, if landfill personnel spot a load that is full of recyclable materials during
the weighing, then the vehicle may be directed elsewhere to unload the recyclable
waste. In addition, it is common for landfills to operate in conjunction with a
material recovery facility (MRF), where all recycling, green waste, and construction
waste collection vehicles are instructed to unload their materials for further separation
and handling.
27
Department of Resources Recycling and Recovery. “Beyond 2000: California’s Continuing Need for
Landfills,” http://calrecycle.ca.gov/SWFacilities/Landfills/NeedFor/Operations.htm (accessed February 28,
2011).
28
Department of Resources Recycling and Recovery. “Beyond 2000: California’s Continuing Need for
Landfills,” http://calrecycle.ca.gov/SWFacilities/Landfills/NeedFor/Operations.htm (accessed February 28,
2011).
29. Page | 17
3.2 Environmental Impacts of Landfills
The biggest environmental challenge in landfill operation is preventing landfill emission
from entering air and water resources. Although landfill operation and quality control have
improved significantly over the years, emission reduction still remains a top priority in
managing landfills. Emission from landfills contributes to the following air quality problems:
Greenhouse emissions: Landfills release greenhouse gases into the atmosphere.
Greenhouse gases trap heat radiation from the sun within the earth’s atmosphere,
contributing to global warming. Greenhouse gases such as carbon dioxide come
from operating vehicles and waste collection truck load emissions. Most of the
vehicles are run on gasoline or diesel and usually do not operate very efficiently;
miles per gallon of fuel can be comparatively low. Another greenhouse gas that
emanates from landfills is methane. In fact, landfills are a major source of methane
emission. Methane comes from waste decomposition. Items such as petroleum-
based plastic bags take years to decompose. During its decomposition process
methane is released into the air. Methane release from landfill waste can be a
serious hazard if it is not managed properly. Methane can infiltrate into a building
undetected and then could be ignited by a match or electrical spark to start a fire.
Generally, a pipe system is installed to extract and collect methane from covered
waste loads. The captured gas is then used to power some landfill operational
vehicles.
Combustion: Landfills are sited in an open area with as much waste as possible
compacted into layers each day. The temperature under these layers can be
extremely high. In addition, the methane concentration could increase if it is not
properly extracted. It is possible for covered waste to catch fire because of the
elevated temperature and high concentration of methane. Once the waste begins to
burn, it can then release various types of harmful chemicals and greenhouse gases
into the atmosphere.
Odor: Odor is another challenge for landfills as part of maintaining adequate air
quality. Waste is spread, compacted, and covered daily. However, if the waste is
not covered properly and is exposed to open air, it can release unpleasant smells.
Sometime the odors can be harmful to humans. Municipal landfills have a lot
human waste, such as food, soiled diapers, and restroom wastes. When exposed to
the air under high temperatures, these wastes may generate an odor affecting areas
that are miles away. Therefore, odor control is essential in maintaining adequate air
quality.
30. Page | 18
Dust and debris: Within a landfill, most of the roads leading to unloading and
spreading areas are unpaved. Therefore, heavy waste collection trucks and large
equipment vehicles generate clouds of dust while driving through the landfill. In
addition, small particles and debris sometimes fall from the trucks. The dust and
small particles pollute the local air, threatening the health of landfill workers. In
order to avoid degrading air quality around landfills, landfill companies employ
workers to drive water trucks through the area to constantly spread water to control
dust and small particles.
Emissions from landfills can also enter the water system. Unlike air quality, which has a
chance for improvement after the landfill is closed, pollutants from landfills could have long-
term effects on the ground and surface water resources. Emissions from landfills contribute
to the following problems in water quality:
Waste runoff: If the waste is not managed and covered properly, insoluble and soluble
waste could enter the storm drains and water channels to pollute surface water.
Pollutants can be in solid, chemical, or toxic forms. Once wastes enter the water they
are very difficult and costly to remove. In addition, if a pollutant is in chemical or
toxic form then it is also very difficult and costly to track its direction and destination.
Solid waste runoff can also clog storm drains and water channels causing floods
during rainy season.
Leachate: Degree and type of leachate varies based on the age of the landfill and the
type of waste it contains. However, in municipal landfills leachate usually comes
from food waste, yard waste, and rain. The liquid is mixed with other materials in the
compacted layers. Leachate could have high acidity, or high levels of ammonia or
bacteria. If leachate enters the groundwater system it can severely pollute the
underground water source with few options for treatment. In addition, once leachate
enters the groundwater, it is difficult to track its direction and destination. It could
pollute water resources that are miles away from its origin. Since leachate is in liquid
form, it is very difficult to track and prevent it from penetrating through the waste.
To control the problem, a landfill company must install liners, a pipe system, filters,
pumps, and sumps to collect and extract leachate from covered wastes. The goal is to
collect and extract leachate before it penetrates deep into the layers. Once the
leachate is collected and extracted, it is treated before discharge into drains or surface
water.
3.3 Social Impacts of Landfills
In addition to environmental impacts, landfills also have sociological impacts on surrounding
communities. The social impacts of landfills on surrounding communities can be observed in
31. Page | 19
the changes in the residents’ quality of living. Those changes in the quality of living
contribute to various sociological changes in the surrounding communities. The social
impacts from landfills can be observed in the following areas:
Public health issues: The environmental impacts by landfills on surrounding
communities often result in the decline of those communities’ public health quality.
Odor, dust, and debris from landfills often degrade the air quality in surrounding
communities. Emissions from trucks and landfill vehicles can also release carbon
dioxide and other chemicals into the air. Residents may have difficulty breathing or
have chronic respiratory problems because of the constant exposure to the polluted air.
Water pollution caused by leachate and waste runoff threatens water quality and
supply. Unsanitary water can cause health problems such as malaria and diarrheal
diseases. These environmental impacts degrade the living and social qualities of
surrounding communities. In addition, the impacts can also go beyond the initial
perimeter. Residents who are constantly exposed to poor air and water quality may
require frequent medical care. Therefore, poor air and water quality can increase both
social and health costs of surrounding communities.
Traffic and road condition issues: Another social impact of landfills is the
degradation in public road quality due to increased traffic volume. A study led by
Solheim points out that landfill traffic safety can potentially provoke NIMBY
movements among the residents because of potential impact on their quality of life.
Increased traffic volume in and around a landfill and community often reinforce the
perception that road safety is diminishing by the mere presence of larger waste
vehicles.29
Large waste collection trucks and landfill operation vehicles contribute to
additional impacts and extra weight on the road surface, deteriorating road quality.
Therefore, frequent pavement and road maintenance is required to maintain the roads.
As a result, surrounding communities and local governments have to absorb the
additional cost of road maintenance. Debris that falls from the waste collection trucks
can also add to the cost of road maintenance. The debris from waste trucks requires
more frequent road sweeping service and other preventative services to keep the
debris from entering storm drains. Increase in traffic volume also means poorer traffic
quality and a greater chance of traffic accidents. Large waste collection vehicles have
bigger blind spots. Waste collection vehicle drivers may miss seeing cars or obstacles
directly behind them. In addition, careless operation and control can increase the
chance of traffic accidents. These traffic-related costs are often absorbed by the local
communities and the local government.
29
Catherine A. Solheim, Charles E. Faupel, Conner Bailey, “Solid Waste Management and the Need for
Effective Public Participation,” Southern Rural Sociology 13, no. 1 (1997): 65-88.
32. Page | 20
Community perception: Landfill selection and operation often face strong community
opposition. Community members do not see landfills as presenting a positive or
desirable image that reflects the quality of their neighborhood. Community
perception is often influenced by past experience, social status, and incorrect
information. Landfill management and operation have improved dramatically over
the years, but the negative images and perceptions remain unchanged among the
general population. In fact, much research and many studies have shown that if
community members have an opportunity to be educated on or even witness daily
landfill operation, their level of acceptance and support could increase. A survey
study led by Rahardyan focuses on residents’ acceptance and the perceptions of waste
facility in three different metropolitan areas in Japan yielded different level of
acceptance. The study has shown the oppositional attitude decreased for residents
who had a chance to visit a waste facility.30
In addition, how those incorrect
community perceptions can be changed depends on the outreach methods used by the
landfill companies. Landfill companies must be willing to provide opportunities to
allow surrounding communities to be involved in their daily operations in order to
change community perception. If landfill companies actively stay involved in local
communities and events they will help to build a bridge of trust and understanding
between local communities and landfill companies.
Compensation packages: Compensation packages can be another positive social
impact resulting from a landfill. Unlike redeveloping a closed or abandoned landfill,
the local government or the involved industries may offer compensation packages to
gain local community support to build and operate a landfill. According to Jenkins,
the compensation package approach has becoming a popular form of dealing with
unwanted land issues. The community may consider variables such as host fees,
social impacts, environmental impacts, and economic impacts to determine their
compensation.31
The compensation package may include building schools, parks,
water treatment plants, or other facilities. The purpose is to compensate for any direct
or indirect impacts from landfill operations and to gain community support for the
building and operating of the landfill on the selected site. However, a successful
compensation package requires community members to stay active and current on the
issues of landfill operations and have a mutual understanding upon how the
community should be compensated. Otherwise, the local government and the
involved industries might offer a compensation package that is inadequate to the
needs of the surrounding communities. A study led by Gallagher states that the
government and the waste industry are often too hasty in offering their compensation
30
B. Rahardyan, T. Matsuto, Y. Kakuta, N. Tanaka, “Resident’s Concerns and Attitudes Towards Solid Waste
Management Facilities,” Waste Management 24 (2004): 437-451.
31
Robin R. Jenkins, Kelly B. Maguire, Cynthia L. Morgan, “Host Community Compensation and Municipal
Solid Waste Landfills,” Land Economic 80, no. 4 (November 2004): 513-528.
33. Page | 21
packages, without understanding the local residents’ needs and concerns. As a result,
the resources provided by the compensation package are unable to accommodate or
improve the quality of life.32
A successful compensation package should give the
host community a chance to have the necessary resources to improve the living
quality and to implement mechanisms to minimize the potential negative impacts
from the undesirable facility.
Unlike the environmental impacts, it can be difficult to identify the direct social impacts from
presence of a local landfill. It is difficult to identify or calculate the exact level or magnitude
of the impacts from that landfill. Instead, there are many indirect impacts, such as added
medical costs and road maintenance costs. Landfill-related accidents also contribute to
insurance and repair costs and sometimes even result in loss of life. A landfill can present a
positive social impact on its surrounding communities if it is transformed into a social service
amenity after its operational life has ended. However, this requires methodical and
systematic landfill planning. Such planning should be incorporated at the beginning of the
planning stage instead of waiting until the end of a plant’s operational life.
3.4 Economic Impacts of Landfills
The economic impacts of landfills are similar to the social impacts. Landfills can have a
positive economic impact on the local communities and government by being a long-term
and steady revenue source. The economic impacts of a local landfill are reflected in the
property values of the surrounding communities. However, the magnitude of the impacts on
property values is still being debated. Like social impacts, sometimes it is difficult to
identify direct economic impacts from landfills on surrounding communities. The positive
and negative economic impacts of landfills can be observed in the following areas:
Additional revenue: Landfill can generate an additional revenue source for the local
government. As a landfill is an undesirable, but necessary facility, the waste industry
has to spend large sums of money to buy or rent a piece of land from the local
government to build and operate a landfill. In addition, the waste industry must pay
various taxes and fees to operate the landfill. The City of San Jose, for example,
charges franchise fees and AB 939 fees based on the waste container size and the
frequency of service a business receives. A landfill company must pay the local
government in order to retain its rights to operate the landfill. In turn, residents and
businesses must pay taxes and fees in order to receive services. Having a landfill in a
local community often means additional job opportunities. Increased job
opportunities mean lower unemployment rate and additional revenue for the local
32
L. Gallagher, S. Ferreira, F. Convert, “Host Community Attitude Toward Solid Waste Infrastructure:
Comprehension Before Compensation,” Journal of Environmental Planning and Management 51, no. 2 (2008):
233-257.
34. Page | 22
government. Landfills are usually built to have a long operational life. Therefore,
having a landfill under its jurisdiction means a long-term and steady revenue source
for the local government.
Property values: Generally, people perceive a landfill as an undesirable and
unwelcome facility to their neighborhood. In the past, landfills might have had poor
maintenance issues. However, landfill operations have drastically improved to control
effectively emissions, sanitation, pest, and other environmental issues. Regardless of
these improvements, communities still perceive landfills as a negative impact on their
property values. A study by Klein that was presented to Maryland Solid Waste Task
Force in 1999, documented an average of a 0.4 percent decrease in property value for
each decibel increase above 55dBA, which means a truck that produces 90dBA
would yield a 14 percent decline in property value.33
However, the accuracy and
magnitude of the impacts that landfills have on their surrounding communities are
still been debated among researchers and scholars. In addition, some researchers
argue that landfills can actually have a positive impact on the local property values,
especially if the landfill is transformed into a public service amenity after the landfill
is closed. A study by Kavazanjian, focusing on sustainable redevelopment of
abandoned or closed landfills, found there are many opportunities in redeveloping
landfills. As a result, it may bring positive impacts on surrounding property values.34
However, the majority of published studies find that landfills have a negative impact
on the surrounding property values. Landfills need to have state-of-the art equipment
and technology and have a well-planned strategy from the beginning to the end of
operational life in order for landfills to have a positive impact on the property values.
This usually requires landfills to be redeveloped into public service facilities after
closure. Landfills can have a positive impact on property values depending on the
quality of the landfill planning process.
In summary, a landfill can bring multiple revenue sources to the local government. In
addition, it is often a long-term and steady revenue sources. Therefore, in some less
privileged areas, the local community and governments invite and embrace a landfill
company’s plans to build and operate a landfill within their communities. The local
communities and governments expect the waste industry to invest in the community
financially by building public facilities and bringing job opportunities. The impacts of
landfills on property values are still being debated. It is difficult to accurately distinguish the
negative impacts of landfills, especially if the community hosts more than one undesirable
facility nearby. While studies show that landfills might have a negative impact on property
33
Richard D. Klein, “Citizen Perspective on Siting Solid Waste Facilities,” (paper presented to the Maryland
Solid Waste Task Force Baltimore MD, October 12, 1999).
34
E. Kavazanjian, Department of Civil and Environmental Engineering “Sustainable Redevelopment of Former
and Abandoned Landfills: Lessons from Practice,” (ArizonaL Arizona State University, 2007).
35. Page | 23
values, with state-of-the-art technology and systematic planning, landfills can have positive
impacts instead.
37. Page | 25
4 Guadalupe Landfill, San Jose, CA
Guadalupe Landfill is an active landfill in the southern part of San Jose, California, located at
15999 Guadalupe Mines Road, San Jose. Figure 4.1 illustrate the approximate location of
the Guadalupe Landfill. Guadalupe Mines Road is a two-way street that traverses residential
and light industrial areas, and is the only access to the landfill. Guadalupe Landfill is located
in a hilly area surrounded by such uses as residential, industrial, forest and parks, a golf
course, as well as other facilities. The operating area of the landfill is approximately one
mile from the entrance. Trucks must drive up a hill to reach the scale house and the dumping
areas. The landfill is under the jurisdiction of the City of San Jose and the City is the lead
enforcement authority (LEA) that ensures the landfill company complies with all regulations.
The normal operating hours are from 8:00 a.m. to 5:00 p.m. The landfill is restricted from
any operational activities before 7:00 a.m. and after 8:00 p.m. to control noise. The landfill
is managed and owned by Guadalupe Rubbish Disposal Co., Inc., which is a part of Waste
Management, Inc. Waste Management, Inc. has owned and operated the Guadalupe Landfill
since 1999. Waste Management, Inc. is one of the largest solid waste companies in the
nation.
Figure 4.1 Guadalupe Landfill Location
Source: City-Data, City of San Jose Main Postal Zip Code Map
Guadalupe
Landfill
38. Page | 26
4.1 Guadalupe Landfill: Operation
Guadalupe Landfill is approximately 107 acres in area.35
The landfill has a solid waste
facility permit that allows it to accept residential and commercial solid, recycled, and
construction waste. The landfill also has a composting facility that accepts green and
compostable waste. However, the composting facility is only permitted to turn green and
compostable waste into mulch to use as a daily cover or sell to other vendors. The
composting facility is not permitted to turn green and compostable waste into compost
because of odor issues.36
The maximum accepted tonnage per day is 1,300 tons. Guadalupe
Landfill is equipped with a leachate monitoring, collecting, and disposal system. Leachate
and water collected from the landfill are treated and checked before release. Guadalupe
Landfill has approximately 50 methane wells to collect methane. It also has a facility to
collect natural gas. The methane is sold to a third party and the natural gas is sold to Pacific
Gas and Electric Company (PG & E). The facility is an open landfill and requires daily
covers after the wastes are spread and compacted. The permitted covering materials include
ash, shredded auto, construction materials, mulch, contaminated soil, foam, geosyn blanket,
green material, sludge, and tires. Currently, the Guadalupe Landfill is under expansion, and
the landfill’s life should be extended by another 25 years when the expansion is complete.37
It is unclear, at this time, the type of redevelopment that may be planned for the Guadalupe
Landfill once the landfill reaches its capacity. Since it is located on a hill, the most likely
alternative is transformation of the landfill into an open space.
4.2 Guadalupe Landfill: Disposal Tonnages
The original estimated closure date for the landfill was January 2010. The estimated post-
closure maintenance period was intended to span years 2010 through 2040. However, the
Guadalupe Landfill will now remain active beyond 2010 because of technology advances
that have improved productivity and efficiency of landfill operations. In addition, California
has the most aggressive “recycle, reuse, and reduce” regulations that help divert large
amounts of recyclables from the landfill, saving valuable landfill space. Besides diverting
recyclable materials from ever entering the landfill, some of the accepted waste can be used
as daily cover, which also saves landfill space. Guadalupe Landfill accepted 229,182 tons of
materials in 2006. However, the landfill only accepted 112,152 tons of materials in 2007
because it did not accept any waste in the first two quarters in 2007. On average, 9.4 percent
35
Department of Resources Recycling and Recovery, “Active Landfills Profile for Guadalupe Sanitary Landfill,”
Active Landfill Profile, http://www.calrecycle.ca.gov (accessed June 2, 2010).
36
Wise, Neil. Guadalupe Landfill Operation Manager, Waste Management, Inc., Interviewed by author, San
Jose, CA, September 15, 2010.
37
Wise, Neil. Guadalupe Landfill Operation Manager, Waste Management, Inc., Interviewed by author, San
Jose, CA, September 15, 2010.
39. Page | 27
of accepted wastes in 2006 were used for daily cover and 14.0 percent in 2007. Figure 4.2
illustrates the total tonnage accepted and the tonnage used for daily cover in 2006 and 2007.38
Figure 4.2 Guadalupe Landfill Accepted Tonnage and Tonnage Used for Cover 2006-
2007
Source: Department of Resources Recycling and Recovery
San Jose is the largest contributor of the waste sent to the Guadalupe Landfill. The city of
San Jose transported 12,293 tons of materials to the landfill in 2008. However, Guadalupe
Landfill also accepts waste from other jurisdictions in California. Cities like San Mateo,
Concord and Atherton are approximately a two-hour round trip to the landfill. Transporting
wastes from other jurisdictions generate additional traffic volume, air and noise pollution in
the Almaden Valley community. In addition, it is possible that more waste will be
transporting to the landfill because of the landfill expansion project, which increased the
landfill capacity and extended landfill life. Figure 4.3 shows the top seven jurisdictions
outside of San Jose that send waste to Guadalupe Landfill in 2008.39
38
Department of Resources Recycling and Recovery, “Active Landfills Profile for Guadalupe Sanitary Landfill,”
Active Landfill Profile, http://www.calrecycle.ca.gov (accessed June 2, 2010).
39
Department of Resources Recycling and Recovery, “Active Landfills Profile for Guadalupe Sanitary Landfill,”
Active Landfill Profile, http://www.calrecycle.ca.gov (accessed June 2, 2010).
229,182
112,152
23,822 18,238
0
50,000
100,000
150,000
200,000
250,000
2006 2007
WasteTonnages
Year
Guadalupe Landfill Accepted Tonnage and
Tonnage Used for Cover 2006-2007
Accepted Waste (Ton)
Used for Daily Cover (Ton)
40. Page | 28
Figure 4.3 Top-Seven Local Jurisdictions Contributing Waste to Guadalupe Landfill in
2008
Source: Department of Resources Recycling and Recovery
In summary, Guadalupe Landfill is an active municipal landfill in the southern part of San
Jose. The Guadalupe Landfill is the second largest active landfill in San Jose behind Newby
Island Landfill. However, unlike Newby Island Landfill, Guadalupe Landfill does not house
any waste collection trucks. It solely focuses on accepting and managing commercial and
residential wastes and recyclables. Guadalupe Landfill also accepts commercial yard waste,
which the landfill turns the material into commercial grade compost and mulch that are sold
to landscaping companies, gardeners and other interested businesses. The landfill also
accepts waste from cities farther away from San Jose such as San Mateo, Atherton and
Concord, but San Jose remains its largest customer. Guadalupe Landfill is currently under
construction to expand its capacity and operation. Once the expansion is completed, it
expects to extend the landfill life for another 25 years.40
40
Wise, Neil. Guadalupe Landfill Operation Manager, Waste Management, Inc., Interviewed by author, San
Jose, CA, September 15, 2010.
100 100
89
82
56 52
44
0
20
40
60
80
100
120
Palo Alto Woodside Los Gatos San Mateo Portola
Valley
Atherton Concord
WasteTonnages
Jurisdictions
Top-Seven Jurisdictions Sending Waste to
Guadalupe Landfill in 2008
41. Page | 29
5 Almaden Valley, San Jose, California
Almaden Valley is a neighborhood in the southwestern part of the city of San Jose. The
Almaden Valley neighborhood is roughly equivalent to the 95120 zip code. The three major
highways that access the neighborhood are Highways 101, 87 and 85. See, Figure 4.1
provides the Almaden Valley location. The major streets in the neighborhood are Blossom
Hill Road, Coleman Avenue, Almaden Expressway, and Santa Teresa Boulevard. The valley
is surrounded by small hills and the Santa Cruz Mountains. The Almaden Valley
neighborhood is one of the more affluent neighborhoods within San Jose. It is a
predominantly single-family residential community. The neighborhood also has abundant
green spaces. Besides residential units, the neighborhood also includes several small
shopping centers, parks, schools, churches, and small businesses.
5.1 Almaden Valley Neighborhood: Demographics
According to the U.S. Census Bureau, the 95120 zip code had total population of 37,089 in
the year 2000.41
The male to female ratio was very close, with approximately 18,323 males
and 18,766 females. It had a predominantly Caucasian (71 percent) and Asian (23 percent)
population. Figure 5.1 shows the age group breakdown in the Almaden Valley neighborhood.
Figure 5.1 Almaden Valley Residents Age Group Breakdowns
Source: U.S Census Bureau
41
U.S Census Bureau, “Zip Code Tabulation Area 95120,” American FactFinder Fact Sheet,
http://factfinder.census.gov/home/saff/main.html?_lang=en (accessed June 10, 2010).
6.2
72.8
8.9
Age Groups in Almaden Valley
Under 5 years
18 years and over
65 years and over
42. Page | 30
Almaden Valley of year 2000 had a strong work force because the majority population was
between 18 years and 65 years of age. In addition, it was likely to have married couples with
children younger than 18 years of age. In fact, according to the year 2000 census, 74.5
percent of males and 70.6 percent of females were identified as married.42
The average
family size was 3.22 persons in the year 2000.
5.2 Almaden Valley Neighborhood: Education and Income
Generally, one’s education influences earnings. In the year 2000, the neighborhood had
25,071 residents 25 years or older, which is approximately 67 percent of the total population
in the 95120 zip code.43
Of those residents, 64 percent were high school graduates or had a
college degree, with 41 percent of these holding a bachelor or higher degree. Higher
education could also contribute to low poverty level. The Almaden Valley neighborhood
only has 140 families (or 1.3 percent of the total households) who lives below the poverty
level. Figure 5.2 shows the geographic locations of Almaden Valley and the three
surrounding neighborhoods for the education and income comparison.
Figure 5.2 Geographic Locations of Almaden Valley and Three Surrounding Neighborhoods
Source: Map created by author. Mapping information acquired through URBP 278- GIS Application, summer, 2010.
42
U.S Census Bureau, “Zip Code Tabulation Area 95120,” American FactFinder Fact Sheet,
http://factfinder.census.gov/home/saff/main.html?_lang=en (accessed June 10, 2010).
43
U.S Census Bureau, “Zip Code Tabulation Area 95120,” American FactFinder Fact Sheet,
http://factfinder.census.gov/home/saff/main.html?_lang=en (accessed June 10, 2010).
43. Page | 31
Table 5.1 compares the population and education level of Almaden Valley residents (in zip
code 95120) who are 25 years or older with the other three surrounding neighborhoods:
Cambrian/Pioneer (zip code 95118), Coyote (zip code 95119), and Edenvale (zip code
95123). Table 5.2 compares the numbers of families live below the poverty level in the same
four zip codes.
Table 5.1 Population and Education Background Comparison among Almaden Valley
and Surrounding Neighborhoods
Zip Code Cambrian/Pioneer
9511844
Coyote
9511945
Almaden
Valley
9512046
Edenvale
9512347
Total
Population
(Year 2000)
31,916 10,137 37,089 59,621
Population 25
and Over
21,637 (67%) 6,342 (62%) 25,071 (67%) 38,829 (65%)
High School or
Higher
18,911 (59%) 5,565 (54%) 24,094 (64%) 34,353 (57%)
Bachelor
Degree or
Higher
7,145 (22%) 2,192 (21%) 15,261 (41%) 11,890 (19%)
Source: U.S Census Bureau
Table 5.2 Poverty Comparison among Almaden Valley and Surrounding
Neighborhoods
Zip Code Cambrian/Pioneer
95118
Coyote
95119
Almaden
Valley
95120
Edenvale
95123
Families Live
Below Poverty
Level
347 130 140 508
Percentage 4.1% 5% 1.3% 3.3%
Source: U.S Census Bureau
44
U.S Bureau of the Census, “Zip Code Tabulation Area 95118,” American FactFinder Fact Sheet,
http://factfinder.census.gov/home/saff/main.html?_lang=en (accessed June 10, 2010).
45
U.S Bureau of the Census, “Zip Code Tabulation Area 95119,” American FactFinder Fact Sheet,
http://factfinder.census.gov/home/saff/main.html?_lang=en (accessed June 10, 2010).
46
U.S Bureau of the Census, “Zip Code Tabulation Area 95120,” American FactFinder Fact Sheet,
http://factfinder.census.gov/home/saff/main.html?_lang=en (accessed June 10, 2010).
47
U.S Bureau of the Census, “Zip Code Tabulation Area 95123,” American FactFinder Fact Sheet,
http://factfinder.census.gov/home/saff/main.html?_lang=en (accessed June 10, 2010).
44. Page | 32
Both tables show that the Almaden Valley neighborhood performs better than the other three
surrounding neighborhoods in terms of education level and percentage of families living
below the poverty level. Almaden Valley is one of the affluent neighborhoods in San Jose.
Figure 5.3 illustrates the income levels in the Almaden Valley neighborhood in 1999. Of the
12,430 households, 3,566 households (29 percent) have an annual income between $100,000
and $149,999. Another 2,256 households (18 percent) earn $200,000 or greater, annually,
and 2,166 households (17 percent) have an annual income between $150,000 and $199,999.
Figure 5.3 Income Levels in the Almaden Valley in 1999
Source: U.S Census Bureau
The median household income, measured in 1999 dollars is $120,117 in the year 2000
census.48
By comparison, the median household income for residents of the city of San Jose,
measured in 1999 dollar is $70,243. Almaden Valley has a significantly higher median
income compared to that in San Jose and also the three surrounding neighborhoods. Figure
5.4 compares the median income among Almaden Valley and its three surrounding
neighborhoods.
48
U.S Census Bureau, “Zip Code Tabulation Area 95120,” American FactFinder Fact Sheet,
http://factfinder.census.gov/home/saff/main.html?_lang=en (accessed June 10, 2010).
12% 12% 12%
29%
17% 18%
0
500
1,000
1,500
2,000
2,500
3,000
3,500
4,000
Less than
$49,999
$50,000 to
$$74,999
$75,000 to
$99,999
$100,000 to
$149,999
$150,000 to
$199,999
$200,000 or
more
Households
Income Levels
Income in 1999 (12,430 Households)
45. Page | 33
Figure 5.4 Median Income Comparisons among Almaden Valley and Surrounding
Neighborhoods
Source: U.S Census Bureau
The occupation held by the Almaden Valley residents may also be connected with the high
level of income in the neighborhood. Figure 5.5 shows the occupation types held by the
Almaden Valley residents.
Figure 5.5 Occupation Types Held by Almaden Valley Residents
Source: U.S Census Bureau
73,134
87,931
120,117
75,188
0
20,000
40,000
60,000
80,000
100,000
120,000
140,000
95118 95119 95120 95123
Income
Surrounding Neighborhood Zip Codes
Median Income Comparisons
12,392
933
4,221
481 551
0
5,000
10,000
15,000
Management Service Sales/Office Constrcution Production
NumberofResidents
Occupation
Occupation Types Held by Almaden Valley
Residents
46. Page | 34
12,392 of the 18,586 employed civilian who are 16 years or older work in management,
professional or related occupations. This represents 66.7 percent of the labor force. 4,221
employees are in sales or office related occupations, representing 22.7 percent of the labor
force. This makes Almaden Valley a predominately white collar neighborhood.
5.3 Almaden Valley Neighborhood: Property Values
Almaden Valley is one of the more affluent neighborhoods in San Jose. It is primarily a
residential community. It has many parks and other neighborhood vegetation to create a
desirable living environment. Almaden Valley also has desirable public schools. Many of its
public schools have high Academic Performance Index (API) scores. API scores is a school
performance evaluation tool used by the California Department of Education to measure
students’ academic performance. In addition, single-family homes are the common
residential units in the community. It is not uncommon in the Almaden Valley community to
have large lots and living spaces. Four properties were selected to compare their selling
prices in 2010. One of the properties is located within the one-mile radius from the landfill
and the remaining three properties are beyond the one-mile radius area. All four properties
were sold in 2010. In order to evaluate if locating near an active landfill would have an
impact on the selling price, properties with similar structural characteristics were selected.
All four properties are single-family units with the same number of bedrooms and bathrooms.
In addition, the houses were built between mid-1960s to mid-1970s. All four properties are
similar in lot sizes and square footage. Figure 5.6 shows the selling prices of the selected
properties in 2010.
Figure 5.6 Selling Price Comparison
Sources: www.zillow.com
760,000 785,000 768,000 799,000
0
200,000
400,000
600,000
800,000
1454 Montelegre Dr. 1284 Oakglen Way 1136 Carla Dr. 1106 El Prado Dr.
PriceSold
Year 2010
Selling Price Comparison Between Property
Near and Away From the Landfill
47. Page | 35
Table 5.3 shows the characteristics of the selected houses in the Almaden Valley community
that are near and away from the landfill. As the table shows, the selected properties are
similar in square footage, numbers of bedrooms and bathrooms to minimize the differences
in housing characteristics that could possibly influence the selling price. The selected houses
are also located within the same school district, sharing the same elementary school and
middle school. High schools are split between Pioneer High and Leland High. These four
selected properties are also away from any major streets and truck paths. Al these houses
sold in year 2010 (see Figure 5.7). All three houses (Oakglen, Carla and El Prado) that are
beyond the one mile radius from the landfill sold at a higher price than the one (Montelegre)
located near the landfill even though two of the houses (Carla and El Prado) are slightly
smaller in square footage and lot sizes.
Table 5.3 Selling Price Comparison of Single-Family Homes Near and Away from the
Landfill in 2010
Address Bed-
rooms
Bath-
rooms
Square
Ft
Lot
Size
Years
Built
School Price
Sold
1454 Montelegre
Dr.
(within the
survey area)
4 2.5 2,033 8,120 1968 Los Alamitos ES API:
916
Castillero MS API:
806
Pioneer HS API: 823
$760,000
1284 Oakglen
Way
(Beyond the
survey area)
4 2.5 2,055 8,712 1976 Los Alamitos ES API:
916
Castillero MS API:
806
Pioneer HS API: 823
$785,000
1136 Carla Dr.
(Beyond the
survey area)
4 2.5 1,970 7,940 1968 Los Alamitos ES API:
916
Castillero MS API:
806
Leland HS API: 890
$768,000
1106 El Prado Dr.
(Beyond the
survey area)
4 2.5 2,015 7,840 1966 Los Alamitos ES API:
916
Castillero MS API:
806
Leland HS API: 890
$799,000
Source: www.zillow.com
The goal of the research is to determine whether the residents who live within the one-mile
radius of the Guadalupe Landfill perceive the landfill has an impact on the local property
values and traffic safety. If the residents perceive that the landfill has an adverse impact on
the property values, then the perception should be reflected in the selling prices, as properties
closer to the landfill would be valued significantly lower than properties that are farther from
the landfill. The selling price comparison shows that the distance to the landfill is probably
48. Page | 36
not a major concern to the buyer. The selling price of the house located near the landfill
(Montelegre) was only slightly lower than the other three houses (Oakglen, Carla, and El
Prado) located beyond the one-mile radius of the landfill. If the distance to the landfill is not
a factor then the one possible major influential factor on local home sale prices could be the
quality of the local public schools, which is determined by API scores. All four properties
share the same elementary and middle schools. However, Pioneer High School, with a lower
API score, serves the home closer to the landfill, while Leland High School serves the three
homes farther from the landfill. It is highly possible that the selling price difference is
caused by the school API scores than each home’s geographic distance from the landfill. The
buyers may have been more interested in the school districts than concerned about the
landfill impacts.
49. Page | 37
6 Resident Survey: Perception on Landfill’s Impacts on
Property Values and Traffic Safety
A survey was conducted to gather information on the Almaden Valley residents’ perception
of the impacts of Guadalupe Landfill on traffic safety and property values. Survey questions
included questions covering resident’s background, his/her awareness of Guadalupe Landfill
and its operation, and his/her perception of landfill’s effect on traffic safety and property
value. The targeted area was single-family homes located within one mile of the landfill.
According to the Santa Clara County Assessor’s Office data, there are 3,730 single-family
homes within this one-mile distance of the landfill. Every fifth house on each side of the
street was considered for survey, which equal to approximately 750 available subjects. The
survey was anonymous. Homeowners were not required to provide their names or addresses.
The survey targeted single- family homes only, and avoided commercial and multi-family
units. Appendix 1 contains the survey that was administered to the targeted Almaden Valley
residents. Figure 6.1 illustrate the location of the Guadalupe Landfill and area covered by the
survey. The peach color area is the location of the Guadalupe Landfill and the yellow areas
are properties that are within one mile distance from the landfill.
Figure 6.1 Map of the Guadalupe Landfill and Areas Covered by the Survey
Source: Santa Clara County Assessor Office.
Guadalupe
Landfill
50. Page | 38
6.1 Data Source
The map that shows the one mile distance from the Guadalupe Landfill and the mailing
address data of the residents were acquired from the Santa Clara County Assessor’s Office.
The data was purchased with a fee. However, part of the covered area is actually in the City
of Los Gatos. In addition, the assessor’s data indicate that some of the houses list only a post
office box address or different mailing and residential addresses. Houses within the city of
Los Gatos and houses with different addresses were eliminated from the survey. The main
reason for removing houses with alternate addresses from the survey was that these houses
might not be the primary residential property for the homeowners. These homeowners might
not be the occupants that would frequently encounter waste collections trucks or landfill
operation near their property. Elimination of the unsuitable addresses brought the 750
available subjects down to approximately 525.
6.2 Data Distribution and Collection
The 525 surveys were administered to the Almaden Valley residents based on the parcel list
provided by the Santa Clara County Assessor’s Office. The surveys were administered by
postal service from June 1, 2010 to July 18, 2010. Collection for the survey ended on August
18, 2010. A total of 107 surveys were received by August 18, 2010, or 20 percent of the 525
mailed surveys. The surveys were administered once. No additional rounds or surveys were
administered after July 18, 2010.
6.3 Survey: General Demographic and Answers from Respondents
The survey respondents reflect the characteristics of the Almaden Valley community.
Among the 107 respondents, 44 percent of them (48) have lived in the area for more than 16
years. The Almaden Valley community is an affluent community with a predominantly
Caucasian and Asian population. Among the 107 survey respondents, 71 percent identified
themselves (76) as White or Caucasian, and 19 percent identified themselves as Asians (20).
Most of residents in the Almaden Valley community have a college education. Of the survey
respondents, 86 percent of the respondents (92) received a bachelor degree or higher a degree,
and 10 percent (11) have some college education. The Almaden Valley neighborhood has a
broad base of people who are between 18 years and 65 years old, which means a strong
working force in the community. Of the respondents, 47 percent (51) are between the ages of
35 and 54 years old and 33 percent of them (36) are between the age of 55 and 74 year.
Further, 54 percent of the survey respondents (58) have no children under 18 living in their
households. Almaden Valley has a larger elderly group compare to the city of San Jose and
Santa Clara County. Based on Census 2000, approximately, 22.3 percent of the Almaden
51. Page | 39
Valley community population is age 55 and over.49
City of San Jose is at 15.9 percent and
Santa Clara County is at 17.7 percent.50
In summary, according to the Census 2000 and the
survey received, Almaden Valley is mainly made up by working professionals and retired
residents.
6.4 Survey: Neighborhood Evaluation
The initial surveys show the respondents do not think that living near the landfill has an
impact on the property values and traffic safety since most of the respondents are satisfied
with the neighborhood. Of the respondents surveyed, 72 percent of them (77) rate the
neighborhood as excellent, 26 percent (28) rate the neighborhood as good, and only 0.1
percent of the respondents (2) rate the neighborhood as average. 42 percent of the survey
respondents (45) indicate that the location was the primary factor they considered when
purchasing the property. Thirty-two percent of the survey respondents (34) list multiple
reasons, such as location, school, view and other factors as primary factors considered when
they purchased the property. Of the survey respondents, 99 percent (106) own the property;
only one (1) survey respondent rents.
6.5 Survey: Awareness of Landfill Existence
Concerning knowledge of the landfill, 54 percent of the survey respondents (58) note that
they were informed or aware of the landfill’s existence before they purchased the property.
26 percent of the respondents (28) note that they were not informed or aware of the landfill
before their purchase, and 20 percent (21) do not recall. Of the 58 respondents who were
informed or aware of the landfill, 20 percent of them (11) had considered the distance to the
landfill as a factor when they made the offer to purchase their homes.
Besides the focus of the survey is on the residents’ perception of the impacts that the
Guadalupe Landfill has on traffic safety and property values, the survey respondents also
make some interesting comments and observations about living near the Guadalupe Landfill,
such as:
One respondent notes that he/she did not notice the landfill is so close by until
he/she was looking for a landfill to unload large household items that would not fit
in the carts.
Two respondents express their concerns about the odor.
49
U.S Census Bureau, “Zip Code Tabulation Area 95120,” American FactFinder Fact Sheet,
http://factfinder.census.gov/home/saff/main.html?_lang=en (March 16, 2011).
50
U.S Census Bureau, “State and County Quick Facts.” American FactFinder Fact Sheet,
http://quickfacts.census.gov/qfd/states/06/06085.html (March 16, 2011).