Download to read offline
![VISSOFT 2018 | Towards an Open Source Stack to Create a Unified Data Source for Software Analysis and Visualization
Richard Müller, Dirk Mahler, Michael Hunger, Jens Nerche, Markus Harrer
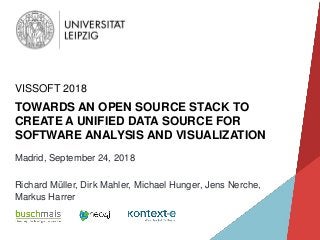
HOW TO GET A UNIFIED DATA SOURCE FOR
SOFTWARE ANALYSIS AND VISUALIZATION?
2
?
[Diehl 2007]](https://image.slidesharecdn.com/vissoft2018-opensourcestack-180927141935/85/Towards-an-Open-Source-Stack-to-Create-a-Unified-Data-Source-for-Software-Analysis-and-Visualization-VISSOFT-2018-2-320.jpg?cb=1538471176)
![VISSOFT 2018 | Towards an Open Source Stack to Create a Unified Data Source for Software Analysis and Visualization
Richard Müller, Dirk Mahler, Michael Hunger, Jens Nerche, Markus Harrer
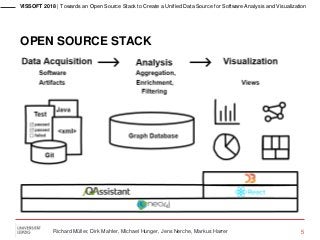
HOW TO GET A UNIFIED DATA SOURCE FOR
SOFTWARE ANALYSIS AND VISUALIZATION?
3
Software data naturally maps to a
multivariate, compound, attributed,
and time-dependent graph
[Diehl & Telea 2014]](https://image.slidesharecdn.com/vissoft2018-opensourcestack-180927141935/85/Towards-an-Open-Source-Stack-to-Create-a-Unified-Data-Source-for-Software-Analysis-and-Visualization-VISSOFT-2018-3-320.jpg?cb=1538471176)
![VISSOFT 2018 | Towards an Open Source Stack to Create a Unified Data Source for Software Analysis and Visualization
Richard Müller, Dirk Mahler, Michael Hunger, Jens Nerche, Markus Harrer
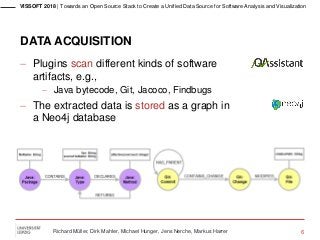
CHALLENGES IN CREATING, STORING, AND
QUERYING SOFTWARE DATA
1. Schema
How to model a given aspect of a software system in
terms of entities, relations, and attributes?
2. Selection
How to select data relevant for a given task from an entire
graph?
3. Implementation
How to store the graph in a way that is efficient for quickly
reading and writing large amounts of data?
4
[Diehl & Telea 2014]](https://image.slidesharecdn.com/vissoft2018-opensourcestack-180927141935/85/Towards-an-Open-Source-Stack-to-Create-a-Unified-Data-Source-for-Software-Analysis-and-Visualization-VISSOFT-2018-4-320.jpg?cb=1538471176)
![VISSOFT 2018 | Towards an Open Source Stack to Create a Unified Data Source for Software Analysis and Visualization
Richard Müller, Dirk Mahler, Michael Hunger, Jens Nerche, Markus Harrer
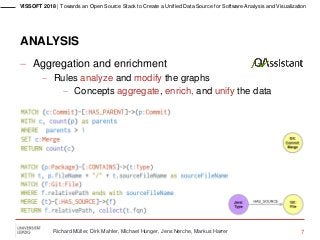
RELATED WORK
Tools for parsing, modeling, and querying software data
Moose [Nierstrasz et al. 2005]
Famix, Dynamix, and Hismo [Ducasse et al. 2011, Greevy 2007, Gîrba
et al. 2005]
Rascal [Klint et al. 2009]
Recent approaches using a graph database for storing
and querying software data
VerX-Combo [Yano et al. 2015]
Swarm Debugging Prototype [Petrillo et al. 2015]
VIMETRIK and KNIME [Khan et al. 2015, Berthold et al. 2009]
11](https://image.slidesharecdn.com/vissoft2018-opensourcestack-180927141935/85/Towards-an-Open-Source-Stack-to-Create-a-Unified-Data-Source-for-Software-Analysis-and-Visualization-VISSOFT-2018-11-320.jpg?cb=1538471176)
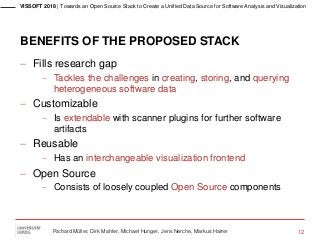


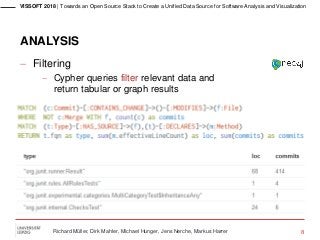
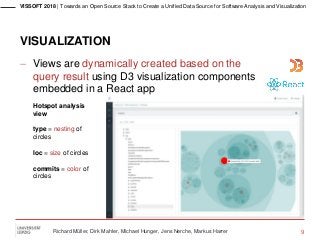
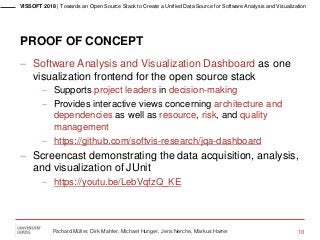
The beginning of every software analysis and visualization process is data acquisition. However, there are various sources of data about a software system. The methods used to extract the relevant data are as diverse as the sources are. Furthermore, integration and storage of heterogeneous data from different software artifacts to form a unified data source are very challenging. In this paper, we introduce an extensible open source stack to take the first step to solve these challenges. We show its feasibility by analyzing and visualizing JUnit and provide answers regarding the schema, selection, and implementation of software artifacts’ data. In VISSOFT'18: Proceedings of the 6th IEEE Working Conference on Software Visualization, 2018. Paper preprint: https://easychair.org/publications/preprint/893N


![Graph-Based Performance Analysis at System- and Application-Level [SSP 2020]](https://cdn.slidesharecdn.com/ss_thumbnails/ssp2020graph-basedperformanceanalysisatsystem-andapplication-level-201113101020-thumbnail.jpg?width=640&height=640&fit=bounds)
![Graph-Based Analysis and Visualization of Software Traces [SSP 2019]](https://cdn.slidesharecdn.com/ss_thumbnails/ssp2019-graph-basedanalysisandvisualizationofsoftwaretraces-191105113623-thumbnail.jpg?width=640&height=640&fit=bounds)
![A Graph-based Feature Location Approach using Set Theory [SPLC2019]](https://cdn.slidesharecdn.com/ss_thumbnails/splc2019-agraph-basedfeaturelocationapproachusingsettheory-190912130107-thumbnail.jpg?width=640&height=640&fit=bounds)


![ANIMAL_CELL_,_TISSUE_AND_ORGAN_CULTURE[1].pptx](https://cdn.slidesharecdn.com/ss_thumbnails/animalcelltissueandorganculture1-260204172026-4462b440-thumbnail.jpg?width=640&height=640&fit=bounds)


