SlideShare a Scribd company logo
1 of 4
Download to read offline
Fall 2014 Student Score Report Page 1
Total Score: 1374
Mastery Level: Advanced
Percentile Rank: 98
Your CLA+ Scores and Percentile Ranks
YOUR SCORE
PERCENTILE RANK
AT YOUR SCHOOL
PERCENTILE RANK
ACROSS CLA+
TOTAL CLA+ SCORE 1374 98 98
PERFORMANCE TASK 1249 86 85
SELECTED-RESPONSE QUESTIONS 1499 99 99
NOTE: CLA+ scores range from approximately 400 to 1600.
Your CLA+ Mastery Level
YOUR MASTERY LEVEL
AVERAGE MASTERY LEVEL
AT YOUR SCHOOL
AVERAGE MASTERY LEVEL
ACROSS CLA+
TOTAL CLA+ SCORE
MASTERY LEVEL Advanced Proficient Basic
NOTE: There are four CLA+ mastery levels: Below Basic, Basic, Proficient, and Advanced.
Your CLA+ Subscores
PERFORMANCE TASK
Analysis & Problem Solving Writing Effectiveness Writing Mechanics
AVERAGE SCORES AVERAGE SCORES AVERAGE SCORES
YOUR
SUBSCORE Your School All CLA+
YOUR
SUBSCORE Your School All CLA+
YOUR
SUBSCORE Your School All CLA+
4 3.1 3.0 4 3.2 3.1 4 3.6 3.4
SELECTED-RESPONSE QUESTIONS
Scientific & Quantitative
Reasoning Critical Reading & Evaluation Critique an Argument
AVERAGE SCORES AVERAGE SCORES AVERAGE SCORES
YOUR
SUBSCORE Your School All CLA+
YOUR
SUBSCORE Your School All CLA+
YOUR
SUBSCORE Your School All CLA+
715 545 500 722 567 500 599 556 500
NOTE: The Performance Task subscore categories are scored on a scale of 1 through 6, and Selected-Response Question
subscores are reported on a scale ranging approximately from 200 to 800.
cla+Richard Mattish | Bob Jones University
Fall 2014 Student Score Report Page 2
CLA+, a product of the Council for Education (CAE), is
an innovative assessment designed to measure
critical-thinking and written-communication skills.
CLA+ includes two major components: a
Performance Task (PT) and a series of Selected-
Response Questions (SRQs).
The Performance Task presents students with a
real-world situation that requires a purposeful
written response. Students are asked to address an
issue, propose the solution to a problem, or
recommend a course of action to resolve a conflict.
They are instructed to support their responses by
utilizing information provided in a Document Library.
This repository contains a variety of reference
materials, such as technical reports, data tables,
newspaper articles, office memoranda, and emails. A
full PT includes four to nine documents in the library.
Students have 60 minutes to complete this
constructed-response task.
In the second part of the examination, students are
asked to answer 25 Selected-Response Questions.
Ten questions measure scientific and quantitative
reasoning, and ten measure critical reading and
evaluation. Another five questions call for students
to critique arguments by identifying logical flaws and
questionable assumptions. Like the PT, the 25 SRQs
are document-based and require students to draw
information from provided materials. Students have
30 minutes to complete this section of the
assessment.
YOUR CLA+ SCORES AND PERCENTILE RANKS
The scores in the first table of your results represent
your performance on the two sections of CLA+ and
on the assessment as a whole.
Your Score for the Total CLA+ is the average of the
Performance Task and Selected-Response
Questions section scores. Your CLA+ section scores
are determined by your subscores for the CLA+
tasks, which are aggregated and converted to scale
scores. This process results in a scale score
distribution with the same mean and standard
deviation as the combined SAT Math and Critical
Reading (or converted ACT) scores of college
freshmen that took the assessment. This type of
scaling makes it such that the CLA+ score range
corresponds approximately to the combined SAT
Math and Critical Reading score range of college
freshmen who took CLA+.
CLA+ scores typically range roughly from 400 to
1600, though it is possible for individuals with
exceptionally high performance on CLA+ to receive
scores above 1600.
The Percentile Rank Across CLA+ column in the first
table of this report indicates how well you performed
on CLA+ relative to other test-takers. The values in
this column represent the percentage of examinees
at your class level whose scores were lower than
yours, both within your school and across CLA+.
MASTERY LEVEL
Your CLA+ mastery level is presented in the second
table on page 1. These levels are determined by your
Total CLA+ score.
There are four mastery levels for CLA+: Below Basic,
Basic, Proficient, and Advanced.
Students who are Below Basic do not meet the
minimum requirements to merit a basic level of
mastery.
Students at the Basic level should be able to
demonstrate that they at least read the documents,
UNDERSTANDING YOUR RESULTS
Richard Mattish | Bob Jones University cla+
Fall 2014 Student Score Report Page 3
made a reasonable attempt at an analysis of the
details, and are able to communicate in a manner
that is understandable to the reader. Students
should also show some judgment about the quality
of the evidence.
Students at the basic level should also know the
difference between correlation and causality. They
should be able to read and interpret a bar graph, but
not necessarily a scatter plot or comprehend a
regression analysis. Tables may be out of reach for
basic students as well.
Students at the Proficient level should be able to
extract the major relevant pieces of evidence
provided in the documents and provide a cohesive
argument and analysis of the task. Proficient
students should be able to distinguish the quality of
the evidence in these documents and express the
appropriate level of conviction in their conclusion
given the provided evidence. Additionally, students
should be able to suggest additional research or
consider counterarguments. Minor errors in writing
need to be defined rigorously.
Proficient students have the ability to correctly
identify logical fallacies, accurately interpret
quantitative evidence, and distinguish the validity of
evidence and its purpose. They should have the
ability to determine the truth and validity of an
argument. Finally, Proficient students should be able
to know when a graph or table is applicable to an
argument.
Students at the Advanced level demonstrate
consistency and completeness, and show a
command of the English language in their response.
They have a level of sophistication that is not seen in
the proficient or basic levels. Advanced students
create and synthesize the provided evidence, are
comfortable with ambiguity, are able to structure
their thoughts, understand causality, add new ideas,
and introduce new concepts in order to create or
seek new evidence. They think about conditions and
nuances and express finer points and caveats by
proposing a conditional conclusion.
The students at this level display creativity and
synthesis, while understanding the finer points in the
documents. For example, advanced students will be
able to synthesize the information across multiple
documents and address the ambiguities in the data
that are presented, such as outliers and knowing
how sample size affects outcomes. Advanced
students will also be able to identify and highlight
gaps in logic and reasoning.
YOUR CLA+ SUBSCORES
Performance Task responses are scored across
three skill areas: Analysis & Problem Solving, Writing
Effectiveness, and Writing Mechanics. Each of these
subscore categories is scored on a scale of 1 through
6. For information about the skills associated with
each subscore, please refer to the CLA+
Performance Task scoring rubric, which is available
on our website at www.cae.org/claptrubric.
The top section of the Your Subscores table on page
1 of this report shows your Performance Task
subscore, as well as the average subscore of
students at your class level, both at your school and
across CLA+.
Selected-Response Questions are also scored
across three skill areas: Scientific & Quantitative
Reasoning, Critical Reading & Evaluation, and
Critique an Argument. Subscores for the selected-
response section of CLA+ are determined by the
number of correct answers in a given section,
adjusted for the difficulty of the set of questions
received, and then converted to a more interpretable
scale using a linear transformation, with a mean of
500 and standard deviation of 100. This scale results
in selected-response section subscores ranging
from approximately 200 to 800, similar to the
subsections of the SAT. Students must attempt at
least half of the questions to receive a score for this
section.
The lower section of the Your Subscores table on
page 1 of this report shows your Selected-Response
Questions subscores, as well as the average
subscore of students at your class level, both at your
school and across CLA+.
Richard Mattish | Bob Jones University cla+
Fall 2014 Student Score Report Page 4
SHARING RESULTS WITH EMPLOYERS OR GRADUATE SCHOOLS
Whether you intend to enroll in graduate school for
an advanced degree, or enter the workforce upon
graduation, your CLA+ results provide a valuable tool
for potential employers or graduate schools to
ascertain the depth of your critical-thinking and
writing skills. In addition to your Total CLA+ Score,
your percentile rank indicates how your score ranks
against others across CLA+, and your mastery level
provides details about the skills required to have
scored at a given level. You can choose to
supplement internship, job, or graduate school
applications by including these results—total CLA+
scores, percentile rankings, and mastery levels—on
you résumé.
If you have scored at the Proficient or Advanced level
on CLA+, you will also be eligible to receive a verified
digital badge. These badges allow career-ready
students to stand out among their peers and appeal
to companies seeking employees with the higher-
order skills measured by CLA+. A CLA+ badge can be
displayed via an online vault or backpack, an
electronic résumé, or a LinkedIn profile. A badge
supplements a résumé because it showcases a
broad range of a student’s skills, particularly the
skills that are transferable outside of the classroom
and valid in the workplace.
If you have performed well on CLA+, you can also
choose to share your CLA+ results on job boards and
employment platforms. There are a growing number
of employment websites that function as job boards
and matching services for entry-level positions.
These sites are important tools for connecting
prospective employers and recent graduates. CLA+
is recognized as a high-quality, valid measure of the
skills employers value the most. CLA+ performance
can be featured on the profiles that you create for
these sites.
Through a partnership with Brazen Careerist, high-
performing CLA+ participants will have the
opportunity to connect with companies who are
interested in recruiting and hiring students who
possess skills measured by CLA+ in an exclusive
virtual job fair. With Brazen Careerist’s virtual
platform, selected students will have the ability to
engage with hiring managers from leading employers
in real time.
You can also choose to share results on electronic
transcripts and résumés. A growing number of
universities subscribe to electronic credential profi-
les for students to display and distribute records of
academic accomplishment. CLA+ participants can
easily and securely include CLA+ scores as a verified
record and share your score report.
MOVING FORWARD
cla+Richard Mattish | Bob Jones University

More Related Content

What's hot

Poetry across time 2012 mark scheme
Poetry across time 2012 mark schemePoetry across time 2012 mark scheme
Poetry across time 2012 mark schemeTpaisey
 
Tabe level l training ppt (fy11 final)[1]
Tabe level l training ppt (fy11 final)[1]Tabe level l training ppt (fy11 final)[1]
Tabe level l training ppt (fy11 final)[1]charlie_herbert
 
501 quantitative comparison_questions
501 quantitative comparison_questions501 quantitative comparison_questions
501 quantitative comparison_questionssoniaovhal
 
CMM+100+MWF+Syllabus
CMM+100+MWF+SyllabusCMM+100+MWF+Syllabus
CMM+100+MWF+SyllabusKevin Kryston
 
Common Core Standards
Common Core StandardsCommon Core Standards
Common Core StandardsSCKESC
 
Common Core Standards
Common Core StandardsCommon Core Standards
Common Core StandardsCourtney Huff
 
transcript_17-02-14_09-25-06 (1)
transcript_17-02-14_09-25-06 (1)transcript_17-02-14_09-25-06 (1)
transcript_17-02-14_09-25-06 (1)Panagiotis Lemos
 
Strategies for Obtaining Your First Academic Position - Tips
Strategies for Obtaining Your First Academic Position - TipsStrategies for Obtaining Your First Academic Position - Tips
Strategies for Obtaining Your First Academic Position - TipsSociety of Women Engineers
 
Poetry across time jan 2012 mark scheme
Poetry across time jan 2012 mark schemePoetry across time jan 2012 mark scheme
Poetry across time jan 2012 mark schemeTpaisey
 
Edld 5352 week_2_assignment_jan_2012
Edld 5352 week_2_assignment_jan_2012Edld 5352 week_2_assignment_jan_2012
Edld 5352 week_2_assignment_jan_2012bdwashi
 

What's hot (16)

Ccss 8.30.11
Ccss 8.30.11Ccss 8.30.11
Ccss 8.30.11
 
Poetry across time 2012 mark scheme
Poetry across time 2012 mark schemePoetry across time 2012 mark scheme
Poetry across time 2012 mark scheme
 
edTPAMGC
edTPAMGCedTPAMGC
edTPAMGC
 
Tabe level l training ppt (fy11 final)[1]
Tabe level l training ppt (fy11 final)[1]Tabe level l training ppt (fy11 final)[1]
Tabe level l training ppt (fy11 final)[1]
 
Tb writing book
Tb writing bookTb writing book
Tb writing book
 
501 quantitative comparison_questions
501 quantitative comparison_questions501 quantitative comparison_questions
501 quantitative comparison_questions
 
CMM+100+MWF+Syllabus
CMM+100+MWF+SyllabusCMM+100+MWF+Syllabus
CMM+100+MWF+Syllabus
 
handbook
handbookhandbook
handbook
 
2015 Fall Sylabus
2015 Fall Sylabus2015 Fall Sylabus
2015 Fall Sylabus
 
Common Core Standards
Common Core StandardsCommon Core Standards
Common Core Standards
 
Common Core Standards
Common Core StandardsCommon Core Standards
Common Core Standards
 
Actinfo E
Actinfo EActinfo E
Actinfo E
 
transcript_17-02-14_09-25-06 (1)
transcript_17-02-14_09-25-06 (1)transcript_17-02-14_09-25-06 (1)
transcript_17-02-14_09-25-06 (1)
 
Strategies for Obtaining Your First Academic Position - Tips
Strategies for Obtaining Your First Academic Position - TipsStrategies for Obtaining Your First Academic Position - Tips
Strategies for Obtaining Your First Academic Position - Tips
 
Poetry across time jan 2012 mark scheme
Poetry across time jan 2012 mark schemePoetry across time jan 2012 mark scheme
Poetry across time jan 2012 mark scheme
 
Edld 5352 week_2_assignment_jan_2012
Edld 5352 week_2_assignment_jan_2012Edld 5352 week_2_assignment_jan_2012
Edld 5352 week_2_assignment_jan_2012
 

Similar to CLA+ Student Report

Presentation2.pptx
Presentation2.pptxPresentation2.pptx
Presentation2.pptxKamranLaeeq1
 
Assessment in Learning 1-Reporting Lesson 9.pptx
Assessment in Learning 1-Reporting Lesson 9.pptxAssessment in Learning 1-Reporting Lesson 9.pptx
Assessment in Learning 1-Reporting Lesson 9.pptxAlfranDaveAmpoyos
 
PSAT: How To Interpret Your Score
PSAT: How To Interpret Your ScorePSAT: How To Interpret Your Score
PSAT: How To Interpret Your ScoreRaiseMe
 
PSAT: How To Interpret Your Score
PSAT: How To Interpret Your ScorePSAT: How To Interpret Your Score
PSAT: How To Interpret Your ScoreRaiseMe
 
Assessment Rubrics Thinking Inside The Boxes
Assessment Rubrics Thinking Inside The BoxesAssessment Rubrics Thinking Inside The Boxes
Assessment Rubrics Thinking Inside The BoxesKarla Adamson
 
Assessment of Learning 2 (assessment).pptx
Assessment of Learning 2 (assessment).pptxAssessment of Learning 2 (assessment).pptx
Assessment of Learning 2 (assessment).pptxLizzieBho
 
Bloom's Taxonomy
Bloom's TaxonomyBloom's Taxonomy
Bloom's Taxonomybutest
 
Week 4 data chart and bar graphs the data chart and bar gr
Week 4 data chart and bar graphs the data chart and bar grWeek 4 data chart and bar graphs the data chart and bar gr
Week 4 data chart and bar graphs the data chart and bar grSALU18
 
Week 4 data chart and bar graphs the data chart and bar gr
Week 4 data chart and bar graphs the data chart and bar grWeek 4 data chart and bar graphs the data chart and bar gr
Week 4 data chart and bar graphs the data chart and bar grssuser774ad41
 
Strategies For Improvement On Ohios State Tests 112008(2)
Strategies For Improvement On Ohios State Tests 112008(2)Strategies For Improvement On Ohios State Tests 112008(2)
Strategies For Improvement On Ohios State Tests 112008(2)ashlandumjm
 
Psat explained
Psat explainedPsat explained
Psat explainedYoAmoNYC
 
PSAT explained
PSAT explainedPSAT explained
PSAT explainedJSlinkyNY
 

Similar to CLA+ Student Report (20)

ACT - September
ACT - SeptemberACT - September
ACT - September
 
Psat Nmsqt
Psat NmsqtPsat Nmsqt
Psat Nmsqt
 
Psat Nmsqt
Psat NmsqtPsat Nmsqt
Psat Nmsqt
 
Presentation2.pptx
Presentation2.pptxPresentation2.pptx
Presentation2.pptx
 
Assessment in Learning 1-Reporting Lesson 9.pptx
Assessment in Learning 1-Reporting Lesson 9.pptxAssessment in Learning 1-Reporting Lesson 9.pptx
Assessment in Learning 1-Reporting Lesson 9.pptx
 
ACT June
ACT JuneACT June
ACT June
 
PSAT: How To Interpret Your Score
PSAT: How To Interpret Your ScorePSAT: How To Interpret Your Score
PSAT: How To Interpret Your Score
 
PSAT: How To Interpret Your Score
PSAT: How To Interpret Your ScorePSAT: How To Interpret Your Score
PSAT: How To Interpret Your Score
 
Chap 15
Chap 15Chap 15
Chap 15
 
Product
ProductProduct
Product
 
Assessment Rubrics Thinking Inside The Boxes
Assessment Rubrics Thinking Inside The BoxesAssessment Rubrics Thinking Inside The Boxes
Assessment Rubrics Thinking Inside The Boxes
 
Power Standards
Power StandardsPower Standards
Power Standards
 
Assessment of Learning 2 (assessment).pptx
Assessment of Learning 2 (assessment).pptxAssessment of Learning 2 (assessment).pptx
Assessment of Learning 2 (assessment).pptx
 
Bloom's Taxonomy
Bloom's TaxonomyBloom's Taxonomy
Bloom's Taxonomy
 
Week 4 data chart and bar graphs the data chart and bar gr
Week 4 data chart and bar graphs the data chart and bar grWeek 4 data chart and bar graphs the data chart and bar gr
Week 4 data chart and bar graphs the data chart and bar gr
 
I-ready Research
I-ready ResearchI-ready Research
I-ready Research
 
Week 4 data chart and bar graphs the data chart and bar gr
Week 4 data chart and bar graphs the data chart and bar grWeek 4 data chart and bar graphs the data chart and bar gr
Week 4 data chart and bar graphs the data chart and bar gr
 
Strategies For Improvement On Ohios State Tests 112008(2)
Strategies For Improvement On Ohios State Tests 112008(2)Strategies For Improvement On Ohios State Tests 112008(2)
Strategies For Improvement On Ohios State Tests 112008(2)
 
Psat explained
Psat explainedPsat explained
Psat explained
 
PSAT explained
PSAT explainedPSAT explained
PSAT explained
 

CLA+ Student Report

  • 1. Fall 2014 Student Score Report Page 1
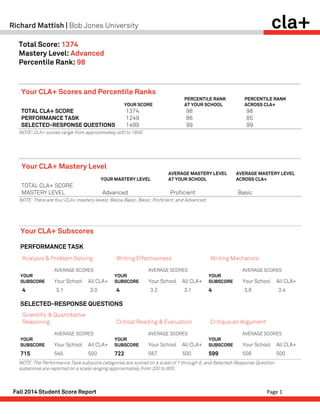
 Total Score: 1374 Mastery Level: Advanced Percentile Rank: 98 Your CLA+ Scores and Percentile Ranks YOUR SCORE PERCENTILE RANK AT YOUR SCHOOL PERCENTILE RANK ACROSS CLA+ TOTAL CLA+ SCORE 1374 98 98 PERFORMANCE TASK 1249 86 85 SELECTED-RESPONSE QUESTIONS 1499 99 99 NOTE: CLA+ scores range from approximately 400 to 1600. Your CLA+ Mastery Level YOUR MASTERY LEVEL AVERAGE MASTERY LEVEL AT YOUR SCHOOL AVERAGE MASTERY LEVEL ACROSS CLA+ TOTAL CLA+ SCORE MASTERY LEVEL Advanced Proficient Basic NOTE: There are four CLA+ mastery levels: Below Basic, Basic, Proficient, and Advanced. Your CLA+ Subscores PERFORMANCE TASK Analysis & Problem Solving Writing Effectiveness Writing Mechanics AVERAGE SCORES AVERAGE SCORES AVERAGE SCORES YOUR SUBSCORE Your School All CLA+ YOUR SUBSCORE Your School All CLA+ YOUR SUBSCORE Your School All CLA+ 4 3.1 3.0 4 3.2 3.1 4 3.6 3.4 SELECTED-RESPONSE QUESTIONS Scientific & Quantitative Reasoning Critical Reading & Evaluation Critique an Argument AVERAGE SCORES AVERAGE SCORES AVERAGE SCORES YOUR SUBSCORE Your School All CLA+ YOUR SUBSCORE Your School All CLA+ YOUR SUBSCORE Your School All CLA+ 715 545 500 722 567 500 599 556 500 NOTE: The Performance Task subscore categories are scored on a scale of 1 through 6, and Selected-Response Question subscores are reported on a scale ranging approximately from 200 to 800. cla+Richard Mattish | Bob Jones University
  • 2. Fall 2014 Student Score Report Page 2 CLA+, a product of the Council for Education (CAE), is an innovative assessment designed to measure critical-thinking and written-communication skills. CLA+ includes two major components: a Performance Task (PT) and a series of Selected- Response Questions (SRQs). The Performance Task presents students with a real-world situation that requires a purposeful written response. Students are asked to address an issue, propose the solution to a problem, or recommend a course of action to resolve a conflict. They are instructed to support their responses by utilizing information provided in a Document Library. This repository contains a variety of reference materials, such as technical reports, data tables, newspaper articles, office memoranda, and emails. A full PT includes four to nine documents in the library. Students have 60 minutes to complete this constructed-response task. In the second part of the examination, students are asked to answer 25 Selected-Response Questions. Ten questions measure scientific and quantitative reasoning, and ten measure critical reading and evaluation. Another five questions call for students to critique arguments by identifying logical flaws and questionable assumptions. Like the PT, the 25 SRQs are document-based and require students to draw information from provided materials. Students have 30 minutes to complete this section of the assessment. YOUR CLA+ SCORES AND PERCENTILE RANKS The scores in the first table of your results represent your performance on the two sections of CLA+ and on the assessment as a whole. Your Score for the Total CLA+ is the average of the Performance Task and Selected-Response Questions section scores. Your CLA+ section scores are determined by your subscores for the CLA+ tasks, which are aggregated and converted to scale scores. This process results in a scale score distribution with the same mean and standard deviation as the combined SAT Math and Critical Reading (or converted ACT) scores of college freshmen that took the assessment. This type of scaling makes it such that the CLA+ score range corresponds approximately to the combined SAT Math and Critical Reading score range of college freshmen who took CLA+. CLA+ scores typically range roughly from 400 to 1600, though it is possible for individuals with exceptionally high performance on CLA+ to receive scores above 1600. The Percentile Rank Across CLA+ column in the first table of this report indicates how well you performed on CLA+ relative to other test-takers. The values in this column represent the percentage of examinees at your class level whose scores were lower than yours, both within your school and across CLA+. MASTERY LEVEL Your CLA+ mastery level is presented in the second table on page 1. These levels are determined by your Total CLA+ score. There are four mastery levels for CLA+: Below Basic, Basic, Proficient, and Advanced. Students who are Below Basic do not meet the minimum requirements to merit a basic level of mastery. Students at the Basic level should be able to demonstrate that they at least read the documents, UNDERSTANDING YOUR RESULTS Richard Mattish | Bob Jones University cla+
  • 3. Fall 2014 Student Score Report Page 3 made a reasonable attempt at an analysis of the details, and are able to communicate in a manner that is understandable to the reader. Students should also show some judgment about the quality of the evidence. Students at the basic level should also know the difference between correlation and causality. They should be able to read and interpret a bar graph, but not necessarily a scatter plot or comprehend a regression analysis. Tables may be out of reach for basic students as well. Students at the Proficient level should be able to extract the major relevant pieces of evidence provided in the documents and provide a cohesive argument and analysis of the task. Proficient students should be able to distinguish the quality of the evidence in these documents and express the appropriate level of conviction in their conclusion given the provided evidence. Additionally, students should be able to suggest additional research or consider counterarguments. Minor errors in writing need to be defined rigorously. Proficient students have the ability to correctly identify logical fallacies, accurately interpret quantitative evidence, and distinguish the validity of evidence and its purpose. They should have the ability to determine the truth and validity of an argument. Finally, Proficient students should be able to know when a graph or table is applicable to an argument. Students at the Advanced level demonstrate consistency and completeness, and show a command of the English language in their response. They have a level of sophistication that is not seen in the proficient or basic levels. Advanced students create and synthesize the provided evidence, are comfortable with ambiguity, are able to structure their thoughts, understand causality, add new ideas, and introduce new concepts in order to create or seek new evidence. They think about conditions and nuances and express finer points and caveats by proposing a conditional conclusion. The students at this level display creativity and synthesis, while understanding the finer points in the documents. For example, advanced students will be able to synthesize the information across multiple documents and address the ambiguities in the data that are presented, such as outliers and knowing how sample size affects outcomes. Advanced students will also be able to identify and highlight gaps in logic and reasoning. YOUR CLA+ SUBSCORES Performance Task responses are scored across three skill areas: Analysis & Problem Solving, Writing Effectiveness, and Writing Mechanics. Each of these subscore categories is scored on a scale of 1 through 6. For information about the skills associated with each subscore, please refer to the CLA+ Performance Task scoring rubric, which is available on our website at www.cae.org/claptrubric. The top section of the Your Subscores table on page 1 of this report shows your Performance Task subscore, as well as the average subscore of students at your class level, both at your school and across CLA+. Selected-Response Questions are also scored across three skill areas: Scientific & Quantitative Reasoning, Critical Reading & Evaluation, and Critique an Argument. Subscores for the selected- response section of CLA+ are determined by the number of correct answers in a given section, adjusted for the difficulty of the set of questions received, and then converted to a more interpretable scale using a linear transformation, with a mean of 500 and standard deviation of 100. This scale results in selected-response section subscores ranging from approximately 200 to 800, similar to the subsections of the SAT. Students must attempt at least half of the questions to receive a score for this section. The lower section of the Your Subscores table on page 1 of this report shows your Selected-Response Questions subscores, as well as the average subscore of students at your class level, both at your school and across CLA+. Richard Mattish | Bob Jones University cla+
  • 4. Fall 2014 Student Score Report Page 4 SHARING RESULTS WITH EMPLOYERS OR GRADUATE SCHOOLS Whether you intend to enroll in graduate school for an advanced degree, or enter the workforce upon graduation, your CLA+ results provide a valuable tool for potential employers or graduate schools to ascertain the depth of your critical-thinking and writing skills. In addition to your Total CLA+ Score, your percentile rank indicates how your score ranks against others across CLA+, and your mastery level provides details about the skills required to have scored at a given level. You can choose to supplement internship, job, or graduate school applications by including these results—total CLA+ scores, percentile rankings, and mastery levels—on you résumé. If you have scored at the Proficient or Advanced level on CLA+, you will also be eligible to receive a verified digital badge. These badges allow career-ready students to stand out among their peers and appeal to companies seeking employees with the higher- order skills measured by CLA+. A CLA+ badge can be displayed via an online vault or backpack, an electronic résumé, or a LinkedIn profile. A badge supplements a résumé because it showcases a broad range of a student’s skills, particularly the skills that are transferable outside of the classroom and valid in the workplace. If you have performed well on CLA+, you can also choose to share your CLA+ results on job boards and employment platforms. There are a growing number of employment websites that function as job boards and matching services for entry-level positions. These sites are important tools for connecting prospective employers and recent graduates. CLA+ is recognized as a high-quality, valid measure of the skills employers value the most. CLA+ performance can be featured on the profiles that you create for these sites. Through a partnership with Brazen Careerist, high- performing CLA+ participants will have the opportunity to connect with companies who are interested in recruiting and hiring students who possess skills measured by CLA+ in an exclusive virtual job fair. With Brazen Careerist’s virtual platform, selected students will have the ability to engage with hiring managers from leading employers in real time. You can also choose to share results on electronic transcripts and résumés. A growing number of universities subscribe to electronic credential profi- les for students to display and distribute records of academic accomplishment. CLA+ participants can easily and securely include CLA+ scores as a verified record and share your score report. MOVING FORWARD cla+Richard Mattish | Bob Jones University