Oajap endogenous archeological sciences luisetto m naseer almuktar et al 20...
Grunewald
1. Cerebral Cortex January 2010;20:89--108
doi:10.1093/cercor/bhp082
Advance Access publication April 24, 2009
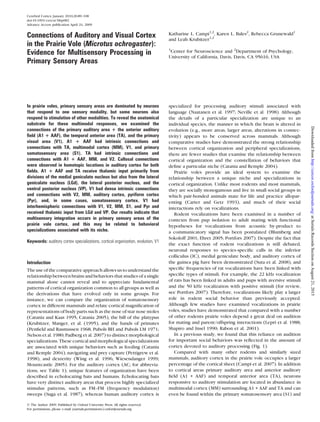
Connections of Auditory and Visual Cortex
in the Prairie Vole (Microtus ochrogaster):
Evidence for Multisensory Processing in
Primary Sensory Areas
Katharine L. Campi1,2
, Karen L. Bales2
, Rebecca Grunewald1
and Leah Krubitzer1,2
1
Center for Neuroscience and 2
Department of Psychology,
University of California, Davis, Davis, CA 95616, USA
In prairie voles, primary sensory areas are dominated by neurons
that respond to one sensory modality, but some neurons also
respond to stimulation of other modalities. To reveal the anatomical
substrate for these multimodal responses, we examined the
connections of the primary auditory area 1 the anterior auditory
field (A1 1 AAF), the temporal anterior area (TA), and the primary
visual area (V1). A1 1 AAF had intrinsic connections and
connections with TA, multimodal cortex (MM), V1, and primary
somatosensory area (S1). TA had intrinsic connections and
connections with A1 1 AAF, MM, and V2. Callosal connections
were observed in homotopic locations in auditory cortex for both
fields. A1 1 AAF and TA receive thalamic input primarily from
divisions of the medial geniculate nucleus but also from the lateral
geniculate nucleus (LGd), the lateral posterior nucleus, and the
ventral posterior nucleus (VP). V1 had dense intrinsic connections
and connections with V2, MM, auditory cortex, pyriform cortex
(Pyr), and, in some cases, somatosensory cortex. V1 had
interhemispheric connections with V1, V2, MM, S1, and Pyr and
received thalamic input from LGd and VP. Our results indicate that
multisensory integration occurs in primary sensory areas of the
prairie vole cortex, and this may be related to behavioral
specializations associated with its niche.
Keywords: auditory cortex specializations, cortical organization, evolution, V1
Introduction
The use of the comparative approach allows us to understand the
relationship between brains and behaviors that studies of a single
mammal alone cannot reveal and to appreciate fundamental
patterns of cortical organization common to all groups as well as
the derivations that have evolved only in some groups. For
instance, we can compare the organization of somatosensory
cortex in different mammals and relate cortical magnification of
representations of body parts such as the nose of star nose moles
(Catania and Kaas 1995; Catania 2005), the bill of the platypus
(Krubitzer, Manger, et al. (1995), and the hands of primates
(Penfield and Rasmussen 1968; Pubols BH and Pubols LM 1971;
Nelson et al. 1980; Padberg et al. 2007) to distinct morphological
specializations. These cortical and morphological specializations
are associated with unique behaviors such as feeding (Catania
and Remple 2004), navigating and prey capture (Pettigrew et al.
1998), and dexterity (Wing et al. 1996; Wiesendanger 1999;
Mountcastle 2005). For the auditory cortex (AC; for abbrevia-
tions, see Table 1), unique features of organization have been
described in echolocating bats and humans. Echolocating bats
have very distinct auditory areas that process highly specialized
stimulus patterns, such as FM--FM (frequency modulation)
sweeps (Suga et al. 1987), whereas human auditory cortex is
specialized for processing auditory stimuli associated with
language (Naatanen et al. 1997; Neville et al. 1998). Although
the details of a particular specialization are unique to an
individual species, the manner in which the brain is altered in
evolution (e.g., more areas, larger areas, alterations in connec-
tivity) appears to be conserved across mammals. Although
comparative studies have demonstrated the strong relationship
between cortical organization and peripheral specializations,
there are fewer studies that examine the relationship between
cortical organization and the constellation of behaviors that
define a particular niche (Catania and Remple 2004).
Prairie voles provide an ideal system to examine the
relationship between a unique niche and specializations in
cortical organization. Unlike most rodents and most mammals,
they are socially monogamous and live in small social groups in
which pair-bonded animals mate for life and practice allopar-
enting (Carter and Getz 1993), and much of their social
interactions rely on vocalizations.
Rodent vocalizations have been examined in a number of
contexts from pup isolation to adult mating with functional
hypotheses for vocalizations from acoustic by-product to
a communicatory signal has been postulated (Blumberg and
Sokoloff 2001; Ehret 2005; Portfors 2007). Despite the fact that
the exact function of rodent vocalizations is still debated,
neuronal responses to species-specific calls in the inferior
colliculus (IC), medial geniculate body, and auditory cortex of
the guinea pig have been demonstrated (Suta et al. 2008), and
specific frequencies of rat vocalizations have been linked with
specific types of stimuli. For example, the 22 kHz vocalization
of rats has been linked in adults and pups with aversive stimuli
and the 50 kHz vocalization with positive stimuli (for review,
see Portfors 2007). Therefore, vocalizations likely play a larger
role in rodent social behavior than previously accepted.
Although few studies have examined vocalizations in prairie
voles, studies have demonstrated that compared with a number
of other rodents prairie voles depend a great deal on audition
for mating and parent/offspring interactions (Lepri et al. 1988;
Shapiro and Insel 1990; Rabon et al. 2001).
In a previous study, we found that this reliance on audition
for important social behaviors was reflected in the amount of
cortex devoted to auditory processing (Fig. 1).
Compared with many other rodents and similarly sized
mammals, auditory cortex in the prairie vole occupies a larger
percentage of the cortical sheet (Campi et al. 2007). In addition
to cortical areas primary auditory area and anterior auditory
field (A1 + AAF) and temporal anterior area (TA), neurons
responsive to auditory stimulation are located in abundance in
multimodal cortex (MM) surrounding A1 + AAF and TA and can
even be found within the primary somatosensory area (S1) and
Ó The Author 2009. Published by Oxford University Press. All rights reserved.
For permissions, please e-mail: journals.permissions@oxfordjournals.org
atSerialsRecordsSectiononAugust21,2015http://cercor.oxfordjournals.org/Downloadedfrom
2. the primary visual area (V1) (Campi et al. 2007). Specifically, in
V1, about a quarter of all recording sites had neurons responsive
to multimodal stimulation, with all these sites containing
neurons responsive to auditory stimulation and stimulation of
some other modality such as vision (86%). We proposed that this
increased multisensory processing observed in primary cortical
fields as well as the predominance of auditory responses (93%)
for multimodal neurons in S1, V1, and MM is associated with the
importance of the auditory system in social interactions. These
findings prompted us to ask how these behavioral and
physiological specializations would be reflected in the cortico-
cortical and thalamocortical connections in prairie voles and if
the connection patterns of auditory and visual areas were
different than those of nonmonogamous rodents that relied less
on the auditory system for important social interactions.
The goal of the present study was to determine the source of
inputs to A1 + AAF, TA, and V1. Cortical injections of anatomical
tracers were placed in these cortical fields and labeled cells, and
axon terminals in the neocortex and thalamus were related to
architectonic boundaries (Fig. 1B). We compare these data with
findings from other rodents that have different social systems and
niches to better understand the types of cortical organization
changes that may accompany these differences.
Materials and Methods
A total of 10 cortical injections were placed in 10 adult prairie voles
(Microtus ochrogaster), and of these, 5 injections were placed in
A1 + AAF in 5 animals, 2 injections were placed in TA in 2 animals, and 3
injections were placed in V1 in 3 animals. All procedures were
approved by the Internal Animal Care and Use Committee and
conformed to National Institutes of Health guidelines.
Table 1
Abbreviations Table
Cortical fields
1, somatosensory area in anterior parietal cortex
2, somatosensory area in anterior parietal cortex
3a, somatosensory area in anterior parietal cortex
3b, primary somatosensory area
A1, primary auditory area
AAF, anterior auditory area
AC, auditory cortex
M, mean
M1, primary motor area
MM, multimodal cortex
OB, olfactory bulb
Oc1, occipital area 1
Oc2, occipital area 2
OTc, occipital temporal area, caudal division
OTr, occipital temporal area, rostral division
PM, parietal medial area
PV, parietal ventral area
Pyr, pyriform cortex
R, rostral auditory field
S1, primary somatosensory area
S2, second somatosensory area
TA, temporal anterior area
Te1, temporal area 1 (Brodmann’s area 41)
Te2, temporal area 2
Te3, temporal area 3
TP, Temporal posterior architectonic area
V1, primary visual area (Brodmann’s area 17)
V2, second visual area (Brodmann’s area 18)
VAF, ventral auditory area
Thalamic nuclei
AD, anterodorsal nucleus
AM, anteromedial nucleus
APT, anterior pretectal nucleus
AV, anteroventral nucleus
cp, cerebral peduncle
eml, external medullary lamina
Hb, habenular nucleus
ic, internal capsule
IGL, intergeniculate leaflet
LD, lateral dorsal nucleus
LGd, lateral geniculate nucleus, dorsal division
LGv, lateral geniculate nucleus, ventral division
LP, lateral posterior nucleus
MGC, medial geniculate complex
MGd, medial geniculate nucleus, dorsal division
MGm, medial geniculate nucleus, magnocellular division
MGv, medial geniculate nucleus, ventral division
opt, optic tract
PAG, periaqueductal gray
pc, posterior commissure
Pli, posterior limitans thalamic nucleus
PO, posterior nucleus
PP, peripeduncular nucleus
Rt, reticular nucleus
SC, superior colliculus
SG, suprageniculate
SNR, substantia nigra
VL, ventral lateral nucleus
VP, ventral posterior nucleus
VPl, ventral posterior nucleus, lateral division
VPm, ventral posterior nucleus, medial division
ZI, zona incerta
Figure 1. (A) Composite reconstruction of flattened vole cortex illustrating the
distribution of neuronal responses from electrophysiological recording sites and their
relationship to architectonically defined cortical areas. Neurons in S1 responded
primarily to somatosensory stimulation, neurons in V1 responded mostly to visual
stimulation, and neurons in auditory cortex responded mostly to auditory stimulation.
However, multisensory responses can clearly be distinguished within these primary
areas. When neurons in primary areas and MM responded to more than one modality
of stimulation, 93% of the responses were to auditory stimulation plus either visual or
somatosensory stimulation. Purple dots represent sites in which neurons responded
to somatosensory stimuli. Yellow dots represent sites in which neurons responded to
visual stimuli. Green dots represent sites in which neurons responded to auditory
stimuli. Black dots represent sites in which neurons responded to more than one
modality of stimulation. Thin lines in S1 denote body part representation boundaries.
(B) Light field, digital image of cortex that has been flattened, sectioned parallel to the
cortical surface, and stained for myelin from a different case than that illustrated in
(A). Although the entire series of sections were used to draw borders,
architectonically distinct areas can be visualized even in this single section. Medial
is to the top, and caudal is to the right. Fp, forepaw; tr, trunk; vib, vibrissae. Other
abbreviations are found in Table 1.
90 Connections of Sensory Cortex in Prairie Voles d
Campi et al.
atSerialsRecordsSectiononAugust21,2015http://cercor.oxfordjournals.org/Downloadedfrom
3. Neuroanatomical Tracer Injections
The neuroanatomical tracer injections were performed under standard
sterile conditions. At the beginning of these experiments, the animals
were anesthetized with intramuscular injections of ketamine hydro-
chloride (67 mg/kg) and xylazine (13 mg/kg). Supplemental doses
were given as needed to maintain a surgical plane of anesthesia. Once
anesthetized, the skin was cut, the skull was exposed, and a craniotomy
was made over a small area of the cortex. A 10% solution of 10 000 mw
each of biotinylated dextran amine (BDA), fluororuby (FR), or
fluoroemerald (FE; Invitrogen, Carlsbad, CA) was injected with either
a calibrated Hamilton syringe (Hamilton Co., Reno, NV) or a glass
pipette attached to a picospritzer (General Valve Corp., Fairfield, NJ).
Approximately 0.4 lL of the tracer was injected at depth of 400--600
lm in cortex. This quantity produced small injections averaging 450 lm
in diameter as measured in flattened cortical sections with tracer
deposit in all 6 layers (Fig. 2A,E--H). Only cases that were restricted to
the cortical layers and did not invade underlying structures were used
(Fig. 2E--H).
Histological Processing
Tracers were allowed to transport for 6 days with the exception of case
07-136 in which 14 days of transport were allowed, after which time
the animals were euthanized with a lethal dose of sodium pentobarbital
(250 mg/kg). The animals were perfused transcardially with 0.9%
saline, followed by 4% paraformaldehyde in 0.1 M phosphate buffer (PB,
pH 7.4), and 4% paraformaldehyde in 10% sucrose in PB. After fixation,
the brain was extracted from the skull; the hemispheres were separated
from the thalamus, weighed, and then flattened between 2 glass slides.
The cortex and thalamus were immersed in 30% sucrose overnight. The
cortex was sectioned tangential to the cortical surface at a 20 lm
thickness on a freezing microtome. This preparation allows the overall
organization and positions of fields relative to each other to be
determined. The thalamus and brainstem were sectioned coronally at
a 40 lm thickness on a freezing microtome. In all cases, alternate series
of cortical sections were reacted for myelin (Fig. 1B; Gallyas 1979; Fang
et al. 2005; Padberg et al. 2005; Campi et al. 2007), processed for
both cytochrome oxidase (CO; Carroll and Wong-Riley 1984) and BDA
(Fig. 2A--D), using standard avidin--biotin development (Vectastain Elite;
Vector Laboratories, Burlingame, CA), or mounted for fluorescence
microscopy. Alternate series of sections in the thalamus were
processed for Nissl, processed for combined CO + BDA, or mounted
for fluorescence microscopy to relate cytoarchitectonic borders to
labeled cell bodies and axon terminals. The CO + BDA reaction was a 2-
step process in which the sections were first processed for CO using
cytochrome C and diaminobenzidine (DAB). Second, BDA labeling was
visualized with an avidin--biotin complex procedure followed by
a metal-enhanced DAB reaction (Veenman et al. 1992).
Data Analysis and Reconstruction
Labeled cells, axon terminals, and injections sites were marked using
a camera lucida for sections stained for CO/BDA and an X/Y stage
encoding system for alternate sections mounted for fluorescence
microscopy (MD Plot 5.2; AccuStage, Shoreview, MN). Every section in
each of these series was reconstructed. Individual reconstructions of
labeled cells were combined into a composite. Architectonic bound-
aries of adjacent sections were traced using a camera lucida (Stemi SV6;
Carl Zeiss, Germany), The entire series of sections were used to
reconstruct architectonic boundaries. The composites for the cells/
terminals and architectonic boundaries were combined into a final
summary display (e.g., Fig. 4A).
Thalamic sections were reconstructed as above; however, labeled
cells were directly related to architectonic boundaries for each section.
Specifically, individual drawings of each thalamic section were made
delineating labeled cells and axon terminals and architectonic borders.
These sections were then assembled into a series as seen in Figures
(Figs 8-- 10 and 12 and 13).
The total number of labeled cells was counted for the cortex and
then for the thalamus, and the percentage of labeled cells present in
each cortical area or thalamic nucleus was calculated (i.e., labeled cells
per cortical area/total cortical labeled cells 3 100).
Glass-mounted sections were scanned at 203 (0.46 lm/pixel) in an
Aperio ScanScope T3 scanner (Aperio Technologies, Vista, CA) for use
in figures. Minimal alterations using Adobe Photoshop were made in the
brightness and contrast for all photomicrographs.
Results
The goal of the current study was to determine the
connections of auditory and visual cortex to uncover the
anatomical substrate for multisensory processing that we
previously observed in our functional mapping studies of
primary sensory areas of the prairie vole (Campi et al. 2007).
Determination of Cortical Field Boundaries
Results from our previous study in the prairie vole are critical
for identifying cortical field boundaries, localizing our injection
sites in the neocortex, and interpreting the present results.
Electrophysiologically determined boundaries and their re-
lation to myeloarchitectonic boundaries are briefly described
here for the prairie vole (Figs 1 and 3A), and these are related
to myeloarchitectonically determined boundaries in other
commonly used rodents including mice (Fig. 3B), rats (Fig. 3C),
and squirrels (Fig. 3D). Electrophysiological recording techni-
ques allowed us to determine the organization of visual,
somatosensory, and auditory cortex in prairie voles (Fig. 1A)
and relate distinct cortical fields to myeloarchitectonic
boundaries. The topographic organization of S1 was deter-
mined and related to a densely myelinated field (Fig. 1B) that is
similar in appearance and location to that described for S1 in
other rodents such as squirrels (Sur et al. 1978; Krubitzer et al.
1986; Wong and Kaas 2008), rats (Welker 1971; Chapin and Lin
1984; Remple et al. 2003), and mice (Woolsey 1967;
Nussbaumer and Van der Loos 1985; Hunt et al. 2006) and
other mammals (e.g., Felleman et al. 1983; Jain et al. 1998;
Catania et al. 2000; for review, see Kaas 1983; Karlen and
Krubitzer 2007; Krubitzer and Campi 2009). A smaller,
moderately myelinated field was identified caudolateral to S1,
and neurons in this field had large receptive fields on the body.
This field corresponds to the S2/PV (second somatosensory
area and the parietal ventral area) region described in other
rodents (Krubitzer et al. 1986; Hunt et al. 2006; Benison et al.
2007) and other mammals (e. g. Krubitzer and Calford 1992;
Krubitzer et al. 1995; Beck et al. 1996).
In voles, neurons at the occipital pole responded pre-
dominantly to visual stimulation (Fig. 1A), and this region of
cortex was coextensive with a darkly myelinated area which
corresponds to area 17 or V1 in other rodents (Hall et al. 1971;
Caviness 1975; Wagor et al. 1980; Coogan and Burkhalter 1993)
and other mammals (e. g. Hubel and Wiesel 1968; Allman and
Kaas 1971; Payne 1993; Kahn et al. 2000; for review, see Lyon
2007). A second, lightly myelinated field in which neurons
respond to visual stimulation was also identified in voles and
corresponds to area 18 or the second visual area, V2 as
described in other rodents (Hall et al. 1971; Tiao and
Blakemore 1976; Wagor et al. 1980; Malach 1989) and other
mammals (e. g. Allman and Kaas 1974; Tusa et al. 1979; Rosa
et al. 1999).
In the temporal region of cortex in prairie voles, a large
myelinated region was observed in which neurons responded
primarily to auditory stimulation. This region was broken into
a darkly myelinated region located medially and a moderately
myelinated region located laterally (Fig. 3A). The medial region
Cerebral Cortex January 2010, V 20 N 1 91
atSerialsRecordsSectiononAugust21,2015http://cercor.oxfordjournals.org/Downloadedfrom
4. is similar in location and appearance to area 41 or temporal
cortex area (Te1) as described architectonically in rats and
mice, and these fields correspond to 2 functionally defined
auditory fields, A1 and AAF in mice (Caviness 1975; Stiebler
et al. 1997), Mongolian gerbils (Thomas et al. 1993: Budinger
et al. 2006), and rats (e. g. Rutkowski et al. 2003; Kalatsky et al.
2005; Polley et al. 2007; Fig. 3). In squirrels, this region
corresponds to A1 and to a rostral field termed R (Fig. 3D,
Merzenich et al. 1976; Luethke et al. 1988), the latter of which
may be homologous to AAF in other rodents. The moderately
Figure 2. Digital image of the injection of BDA in A1 þ AAF from case 07-36 (A) and labeled cells in MM cortex resulting from this injection (B). The digital image in (C) is
a thalamic section from case 07-111 reacted for CO þ BDA. In this case, TA was injected and labeled axons can be seen in MG. The digital image in (D) is a thalamic section
from case 07-121 reacted for CO þ BDA in which labeled cells in MG can be seen. (E--H) Digital images of injection site of FR in A1 þ AAF in case 08-108. This cortex has been
flattened and cut parallel to the cortical surface. Different cortical depths are imaged to demonstrate that the injection site did not invade underlying structures. The digital image
in (E) is the most superficial section, (F) Is from middle cortical layers, and (G, H) are of the deepest section showing the hippocampus coming in to view in the lower left corner.
Medial is to the top, and rostral is to the left in images (A, B). Dorsal is to the top, and medial is to the right in (C and D). Medial is to the top, and rostral is to the right in images
(E--H). Conventions as in previous figure. For list of abbreviations, see Table 1.
92 Connections of Sensory Cortex in Prairie Voles d
Campi et al.
atSerialsRecordsSectiononAugust21,2015http://cercor.oxfordjournals.org/Downloadedfrom
5. myelinated lateral region corresponds TA (Fig. 3D), as described
in squirrels (Merzenich et al. 1976; Luethke et al. 1988), and
neurons in TA in squirrels respond to auditory stimulation. In
mice (Stiebler et al. 1997) and rats (e.g., Polley et al. 2007; see
Discussion), this region has been shown to contain several
functionally defined auditory areas, and its location and
architectonic appearance are similar to TA in squirrels, voles,
and rats (Fig. 3). In the present study, we used a combined
nomenclature for cortical areas from several rodents (i.e., mice,
rats, gerbils, and squirrels) which was derived from both
electrophysiological recording studies and architectonic analysis.
The myeloarchitectonic appearance of the major subdivisions of
the neocortex (S1, S2/PV, V1, V2, A1 + AAF, TA) in all these
species is remarkably similar and provides an accurate frame-
work for comparisons across rodents and across mammals in
general.
Cortical Connections of A1 + AAF and TA
In 5 cases (Fig. 4; 2 cases not shown), injections were placed in
the auditory core region (A1 + AAF), and in 2 cases, 07-111 and
07-136 (Fig. 5) injections were placed in TA. Injection sites
ranged in size from 300 to 800 lm in diameter as measured in
flattened cortical sections.
A1 + AAF Connections
In all cases in which tracer was injected into A1 + AAF, a large
percentage of labeled cells (mean [M] = 49%, see Fig. 6A) were
intrinsic to A1 + AAF (Fig. 4A,C,E), and in most cases, these
labeled cells surrounded the injection site and filled much of the
field. Connections of A1 + AAF with TA were present in all cases
with a mean of 14% of labeled cells observed in this field. Most of
the labeled cells in all cases clustered toward the medial portion
Figure 3. Photomicrographs of myelin stained sections of flattened cortex with architectonic boundaries denoted with thin broken lines. (A) Prairie vole. (B) Mouse. (C) Rat. (D)
Squirrel. Complete areal boundaries cannot be seen in a single section, and it should be noted that the entire series are used for drawing composite reconstruction boundaries.
However, in some of these images, a number of cortical fields are readily identified even in a single section including S1, the auditory core region including A1 þ AAF and TA and
V1. Conventions as in previous figure. For list of abbreviations, see Table 1.
Cerebral Cortex January 2010, V 20 N 1 93
atSerialsRecordsSectiononAugust21,2015http://cercor.oxfordjournals.org/Downloadedfrom
6. of TA, at the border with A1 + AAF. Labeled cell bodies and
terminations were generally overlapping.
Connections of A1 +AAF with MM were also observed in all but
one case, and the percentages of labeled cells varied between
16% and 36% with a mean of 20% (Fig. 6A). In some cases,
a cluster of labeled cells was located ventral to TA (Fig. 4A,C); in
no case did this cluster extend past the rhinal fissure into
pyriform cortex (Pyr). There was also a cluster of moderate label
just medial to A1 + AAF and lateral to V2, in MM. Finally, there was
sparse labeling in cortex between S1 and AC.
A1 + AAF were also connected with V1 and/or V2 in 3 cases
(Fig. 4A,C; case 07-55 not shown). Labeled cells and axon
terminals in V1 and V2 were distributed across the middle
portion of the fields and comprised a small percentage of all
labeled cells in the cortex (M in V1 = 7% and M in V2 = 7%).
Cases 07-36 and 07-121 (Fig. 4A,C), in which the injection was
located nearly in the center of the A1 + AAF, had the highest
percentage of label in V1, 22% and 10%, respectively. Case 07-55
(not shown), which was on the very lateral edge of A1 + AAF, had
only a few labeled cells in V1 (3%).
Connections of A1 + AAF with somatosensory cortex (S1 and/
or S2) were observed in 2 cases (07-121 and 08-108; Fig. 4C,E).
In these cases, 2 patches of terminal labeling and labeled cells
were located at the caudal edge of S1 (vibrissae representation).
In case 07-121, a small percentage of labeled cells ( <3%) were
located in the caudolateral edge of S2 (snout/face representa-
tion). Because of the small number of cells labeled in this region,
the percentage of label in S1 and S2 was combined for analysis.
Cortical Connections of TA
Injection sites in TA were located in the caudomedial (07-111;
Fig. 5A) and rostrolateral (07-136; Fig. 5C) portions of this field. A
large proportion of labeled cells resulting from these injections
were observed in other portions of TA (M = 54%; Fig. 6A). A
moderate percentage of labeled cells were observed in A1 + AAF
(M = 18%), and these labeled cells were scattered throughout
Figure 4. Patterns of ipsilateral and contralateral cortical connections resulting from injections in A1 þ AAF. Ipsilateral connections are shown in (A, C, and E), and contralateral
connections are shown in (B, D, and F). Black filled circles represent labeled cells, and light gray patches represent anterograde terminal fields resulting from the injections in
A1 þ AAF. The injection site is denoted by a gray patch with a black outline. Thin lines denote architectonic boundaries, and dashed lines denote approximate boundaries. Note
that labeled cells are observed in other auditory areas, MM, and in V1 and V2. In cases 07-36 and 07-121, BDA was injected into A1 þ AAF, and in case 08-108, FR was injected
into A1 þ AAF. Conventions as in previous figure. For list of abbreviations, see Table 1.
94 Connections of Sensory Cortex in Prairie Voles d
Campi et al.
atSerialsRecordsSectiononAugust21,2015http://cercor.oxfordjournals.org/Downloadedfrom
7. the field. As with A1 + AAF, MM cortex immediately lateral to TA
and medial to A1 + AAF contained a moderate proportion of
labeled cells (M = 28%). Finally, connections of TA with V2 were
sparse (M = 5%), and connections with V1 were extremely
sparse (M = 0.12%) and restricted to the caudolateral boundary
of V1 in one case (07-136).
Callosal Connections of A1 + AAF and TA
Callosal connections of both A1 + AAF and TA were observed
in all but one case and were mostly in homotopic locations of
these fields in the contralateral hemisphere (Figs 4B,D,F and
5B,D). Connections were moderate to sparse in all cases. In all
cases in which transported tracer was observed in the
opposite hemisphere following injections in A1 + AAF, all or
almost all but one of the labeled cells were in a homotopic lo-
cation in A1 + AAF in the contralateral hemisphere (Fig. 4B,D,F),
except for 1 case where label was observed in TA along the
medial boundary and in cortex caudolateral to S2 (Fig. 4F). In
the 2 cases in which tracer was injected into TA, all the labeled
cells were in the homotopic location in TA of the contralateral
hemisphere (Fig. 5B,D). Terminal labeling in TA and A1 + AAF
in the opposite hemisphere was only observed in one case,
07-136 (Fig. 5D). This was a BDA injection with a transport
time of 14 days, and this likely intensified the terminal labeling
contralaterally.
Cortical Connections of V1
Ipsilateral Connections of V1
In 3 cases, 07-56 (Fig. 7A,B), 07-76 (Fig. 7C,D), and 07-121 (Fig.
7E,F) injections were placed in V1. Injection sites ranged in
size from 200 to 900 lm in diameter. Two of the injection sites
(cases 07-76 and 07-56) were located rostrally (Fig. 7E) and one
more caudally in V1 (Fig. 7A,C). The representation of the
visual hemifield in V1 has been demonstrated to be similar in all
rodents and all mammals examined. The representation of the
lower visual quadrant is located rostromedially in V1, the upper
quadrant is represented caudolaterally, the horizontal meridian
representation bisects the upper and lower quadrants, and the
vertical meridian is represented on the lateral edge of V1
(Hubel and Wiesel 1968; Allman and Kaas 1971; e.g., Hall et al.
1971; Montero 1973; Wagor et al. 1980; Vidyasagar et al. 1992;
Kahn et al. 2000). Although retinotopic mapping was not done
in the prairie vole, we assume a similar representation to that of
all other rodents and all other mammals for V1. Using this
information, 2 of our injection sites (07-56 and 07-76) are located
in the expected location of central vision and one injection site
(07-121) is located in the expected location of the representa-
tion of peripheral visual field at the horizontal meridian.
All 3 V1 injection cases showed intrinsic connections with
V1 (M = 58%; Fig. 6C), although the density of these
connections was different between the cases. In case 07-121,
in which the injection site is nearer the representation of the
peripheral horizontal meridian, 90% of labeled cell bodies were
within V1. In contrast, in cases 07-56 and 07-76, in which the
injection sites are nearer the expected location of the
representation of the vertical meridian near central vision,
35% and 49%, respectively, of labeled cell bodies were within
V1. Connections with V2 were observed in all cases, but the
amount of labeled cells in this cortical area was relatively low
(6%). Moderate connections with MM cortex were observed in
cases 07-56 and 07-76 (26% and 24%, respectively). Sparse
Figure 5. Patterns of ipsilateral and contralateral cortical connections resulting from injections in TA. Ipsilateral connections are shown in (A, C), and contralateral connections
are shown in (B, D). Black filled circles represent labeled cells, and light gray patches represent anterograde terminal fields resulting from the injections in A1 þ AAF. The injection
site is denoted by a gray patch with a black outline. Thin lines denote architectonic boundaries, and dashed lines denote approximate boundaries. Labeled cells are mostly in other
auditory areas but are also found in MM and V1. BDA was injected into TA in both cases. Conventions as in previous figures. For list of abbreviations, see Table 1.
Cerebral Cortex January 2010, V 20 N 1 95
atSerialsRecordsSectiononAugust21,2015http://cercor.oxfordjournals.org/Downloadedfrom
8. connections with MM were observed in case 07-121 (3%).
Moderate to sparse connections with S1 were observed in cases
07-56 and 07-76 (10% and 3%, respectively). No connections with
S1 were observed in case 07-121. Moderate connections with Pyr
were observed in 2 cases 07-56 and 07-76 (15% and 13%,
respectively). In all cases,V1hadsparseconnectionswith auditory
cortex (Fig. 6C). Thus, the connections of the central visual
representation in V1 are more broadly distributed than the
connections of the peripheral visual representation.
Callosal Connections of V1
For all cases, the densest callosal connections of V1 were with
V1 of the opposite hemisphere (44%; Figs 6D and 7B,D,F).
Injection sites at the rostrolateral border of V1 resulted in
labeled cells mainly in the rostrolateral portion of V1 in the
opposite hemisphere in a roughly homotopic location to that
injected. The injection site at the caudal pole of V1 resulted in
labeled cells mainly at the caudolateral border of V1 in the
expected location of the vertical meridian of the upper visual
quadrant (Fig. 7E). Moderate connections were also observed
with V2 (15%), and these connections were scattered through-
out the field in one case and more restricted in 2 cases (Fig.
7B,D,F). Light to moderate connections were observed with MM
in 2 cases (11% and 29%, respectively; Fig. 6D), and sparse
connections with MM cortex were observed in case 07-121
(3%). Moderate connections with S1 and Pyr of the opposite
hemisphere were observed in case 07-76 (Fig. 7D). Finally,
moderate to sparse connections were observed with A1 + AAF
(12%) in all cases, but only sparse connections were observed
with TA (4%) in 2 cases (Fig. 7B,F). As with ipsilateral cortical
connection, interhemispheric connections of the central visual
representation of V1 are more broadly distributed.
Architectonic Subdivisions of Thalamus
Subdivisions of the thalamus were delineated using sections
stained for Nissl substance and CO (Fig. 8). Several nuclei can
clearly be distinguished using these stains. The dorsal and ventral
divisions of the lateral geniculate nucleus, LGN (LGd and LGv),
stain darkly for CO and are separated by the lightly stained CO
and cell sparse intergeniculate leaflet. Further, both LGd and LGv
contained small, darkly stained cells in tissue stained for Nissl
substance, but there were no discernable layers or subdivisions
observed in either of these nuclei (Fig. 8A--F). Dorsal to the LGd,
the lateral posterior nucleus (LP) reacted moderately for CO and
had a medium cell packing density distinguished with Nissl
staining (Fig. 8A--D). The lateral and medial divisions of LP could
be distinguished from each other by darker CO reactivity and
denser cell packing in the medial division. Medial to the LGd, VP
can be seen as a triangular shaped nucleus that is darkly reactive
Figure 6. Histograms depicting the percentage of labeled cells in ipsilateral (A) and contralateral cortex (B) resulting from injections in A1 þ AAF (dark gray) and TA (light gray).
The percentage of labeled cells in the ipsilateral cortex (C) and contralateral (D) cortex resulting from injections in V1. For injections in auditory cortex, connections were mostly
from cortical areas associated with auditory processing, but connections were also observed with nonauditory cortical areas such as V1, V2, and S1/S2. Although connections of
V1 were mostly from cortical areas associated with visual processing, connections with nonvisual cortical areas such as A1þAAf, TA, and S1 were also observed. Conventions as
in previous figures. For list of abbreviations, see Table 1.
96 Connections of Sensory Cortex in Prairie Voles d
Campi et al.
atSerialsRecordsSectiononAugust21,2015http://cercor.oxfordjournals.org/Downloadedfrom
9. for CO and has small, densely packed cells surrounded laterally
by the cell sparse, lightly reactive (CO) external medullary
lamina (Fig. 8A,B). The medial geniculate complex forms the
caudal boundary of VP. The medial geniculate nucleus (MGN)
can be divided into the dorsal, ventral, and medial divisions by
cell packing density differences as well as differences in CO
reactivity. The ventral division (MGv) is the largest, the most
darkly reactive for CO, and the most densely packed of the MGN
divisions. The dorsal division (MGd) is moderately reactive for
CO with medium density cell packing. The medial or magno-
cellular division (MGm) is lightly reactive for CO with a sparse
density of large cells. The optic tract (opt) is a lightly reactive
(CO), cell sparse band on the lateral edge of each section, and
the cerebral peduncle (cp) is a lightly reactive band on the
ventral lateral edge of each section. The substantia nigra (SNR) is
darkly reactive for CO with medium to sparse cell packing
density distinguished by Nissl staining.
Thalamic Connections of Auditory Cortex
In the 5 cases in which injections were placed in A1 + AAF, the
majority of thalamicinput (M = 93%)wasfrom 2ofthedivisionsof
the MGN (Figs 9-- 11). Specifically, 63% of cells projecting to A1 +
AAF are from MGv (Fig. 11A), and 30% of the cells are from MGd.
Interestingly, projections from nuclei associated with other
sensory systems were also observed in 4 of the cases in which
injections were restricted to A1 + AAF. For example, 3% of the
labeled cells in the thalamus were located in the LGd in 3 cases
(Figs 9-- 11), 2% of the labeled cells were in LP in cases 07-36 and
08-108,andincase07-121,8%oflabeledcellsinthethalamuswere
in VP. The labeled cells were equally split between ventral
posterior nucleus, medial division (VPm) and ventral posterior
nucleus, lateral division (VPl). In this same case, labeled cells were
also observed in S1 and S2 of the cortex. In case 07-36, terminal
labeling was observed in MGd and MGv (Figs 2C and 9A).
Figure 7. Patterns of ipsilateral and contralateral cortical connections resulting from injections in V1. Ipsilateral connections are shown in (A, C, and E), and contralateral
connections are shown in (B, D, and F). Black filled circles represent labeled cells, and light gray patches represent anterograde terminal fields resulting from the injections in
A1 þ AAF. The injection site is denoted by a gray patch with a black outline. Thin lines denote architectonic boundaries, and dashed lines denote approximate boundaries. Note
that labeled cells are observed in other visual areas but are also in MM auditory cortex and in 2 cases Pyr. In cases 07-56 and 07-76, FR was injected into V1, and in case 07-121,
FE was injected into V1. Conventions as in previous figures. For list of abbreviations, see Table 1.
Cerebral Cortex January 2010, V 20 N 1 97
atSerialsRecordsSectiononAugust21,2015http://cercor.oxfordjournals.org/Downloadedfrom
10. Thalamic connections of TA were mainly with MGd (65%) in
both cases, whereas MGv and MGm had a smaller percentage of
labeled cells (Figs 11A and 12). In case 07-111, only a few
labeled cells were observed in the 3 divisions of the MGN,
whereas most of the labeling in these divisions was terminal
labeling (Fig. 12A). There was also some terminal labeling in the
Figure 8. Digital images of coronal sections through the prairie vole thalamus that have been reacted for CO (A, C, E, G, I) and stained for Nissl (B, D, F, H, J). This series is from
rostral (A, B) through caudal sections (I, J) showing nuclei in the thalamus where labeled cells and terminals were identified. In rostral sections of the thalamus, VP, LGN, LD, LP,
and PO can be readily identified in either or both CO and Nissl stains (A, B). At middle thalamic levels, the transition between VP, MGN, and LGN can be seen (C--F). Further
caudally, MGd, MGv, MGm, APT, SC, and PAG are distinct in either or both stains (G--J). Sections are 120 lm apart. Scale bar is 1 mm. Dorsal is to the top and lateral to the left.
For list of abbreviations, see Table 1.
98 Connections of Sensory Cortex in Prairie Voles d
Campi et al.
atSerialsRecordsSectiononAugust21,2015http://cercor.oxfordjournals.org/Downloadedfrom
11. LGd and VP in this case. The scarcity of labeled cells in this case
was surprising because the injection in cortex included all
cortical layers. In contrast, in case 07-136 (Fig. 12B), a large
number of labeled cells were present in the 3 divisions of MGN
with a small percentage of labeled cells in LP (5%) and sparse
cell label in LGd and VP (see Figs 11A and 12B). The injection
sites in these 2 cases differed in size and location, and this may
account for some of the differences observed.
Thalamic Connections of V1
In the 2 cases (07-56 and 07-76) in which injection sites were
rostral in V1, in the expected location of central vision, the
majority of thalamic input (67%) comes from LGd (see Fig. 13
for reconstructions and Fig. 11B for percentages of connec-
tions). Moderate to sparse connections with LD (lateral dorsal
nucleus; 7%), LP (21%), posterior thalamic group (PO; 14%), VP
(13%), and ventral lateral nucleus (VL; 10%) were observed in
case 07-76. In case 07-121 in which the injection site was
located at the caudal pole of V1, the majority of input was
from the LGd (55%) and moderate connections were from LD
(18%). Moderate to sparse connections with PO (1%), VL
(4%), and anteroventral nucleus (AV; 13%) were observed in
case 07-121.
Discussion
Cortical and Thalamic Connections of Auditory Cortex in
Rodents
In the present investigation, we found that connections of A1 +
AAF were most prominent with other regions of A1 + AAF,
moderate with TA, and moderate with surrounding MM. The
auditory core in the prairie vole corresponds to the architec-
tonically defined area 41 or Te1 and is composed of 2 functional
Figure 9. Reconstructions of a coronally cut series of sections through the thalamus for cases 07-36 (A) and 07-121 (B). In these cases, an injection of BDA was placed in A1 þ
AAF (Fig. 4). The resulting locations of labeled cell bodies relative to thalamic nuclei boundaries are shown. Black filled circles represent BDA-labeled cells, and gray patches
represent anterograde terminal fields resulting from the BDA injection. Most of the labeled cells and anterograde terminals from the injections were observed within divisions of
MGN. A small cluster of labeled cells was observed in LGd in cases 07-36 and 07-121. Labeled cells were also observed in VPl and VPm in case 07-121. Thin lines denote
boundaries of thalamic nuclei, determined based on CO reactivity and Nissl stains. In this and the following figure, the series of sections run from rostral (top left) through caudal
(bottom right). Sections are 120 lm apart. Scale bar is 1 mm. Other conventions as in previous figures. For list of abbreviations, see Table 1.
Cerebral Cortex January 2010, V 20 N 1 99
atSerialsRecordsSectiononAugust21,2015http://cercor.oxfordjournals.org/Downloadedfrom
12. fields (A1 and AAF/R) as demonstrated in electrophysiological
recording studies in mice (e.g., Stiebler et al. 1997), squirrels
(e.g., Merzenich et al. 1976; Luethke et al. 1988), rats (e.g.,
Rutkowski et al. 2003; Polley et al. 2007), and Mongolian gerbils
(Thomas et al. 1993; Budinger et al. 2006). All of our injections in
the prairie vole were in the caudal or lateral portion of the field
in the expected location of A1 rather than AAF. We did not
observe any major differences in connections across injection
sites in the present study suggesting that all of our injections
were limited to a single field, A1. The pattern of connections in
the present study is similar to that observed for the auditory core
region (A1 + AAF/Te1) in other rodents such as Mongolian
gerbils (Thomas and Lopez 2003; Budinger et al. 2006), squirrels
(Luethke et al. 1988), and rats (e.g., Shi and Cassell 1997). In
these other rodents, the connections of both fields in the
auditory core region are fairly restricted to other auditory
cortical areas. Interestingly, in the vole, direct connections of
A1 + AAF were also observed with the V1 and the S1.
Connections of A1 with S1 and visual areas were also reported
in recent studies of the Mongolian gerbil (Budinger et al. 2006)
but not in other rodents (Fig. 14A). In rats, cortex just dorsal to
Te1 contained labeled cells following injections placed in Te1,
and this region of cortex was defined as S1 (Shi and Cassell
1997). However, this location does not correspond to the
location of S1 in rats as defined using electrophysiological
recording techniques (e.g., Chapin and Lin 1984). Recently,
connections of A1 with nonsensory areas including orbital,
medial prefrontal, and cingulate areas of the cortex were
observed in the Mongolian gerbil (Budinger et al. 2008).
Connections with these cortical areas were not observed in
the prairie vole. The possible significance of these differences in
connection patterns between different rodents is discussed
below.
Connections of TA in the present investigation were
observed with A1 + AAF (mostly in the caudal portion of this
field), with cortex caudal to and lateral to TA, and with V2.
Electrophysiological recordings in this region demonstrate that
neurons respond predominantly to auditory stimulation (Campi
et al. 2007). Connections of TA in the squirrel (Luethke et al.
1988) were similar to those observed in the prairie vole but
were somewhat more restricted in that no connections were
observed with V2. In rats, the region of cortex that appears to
correspond in location to TA in squirrels and prairie voles is
composed of 2 fields termed the ventral auditory field (VA or
VAF; e.g., Donishi et al. 2006; Kimura et al. 2007; Polley et al.
2007) and the suprarhinal auditory area (Polley et al. 2007).
Cortical connections of VA(F) are predominantly with other
auditory areas but are also observed with insular cortex and
posterior parietal cortex (PPC; Kimura et al. 2007), which
corresponds to cortex just dorsal to A1 + AAF and caudal to S1,
which we term MM in prairie voles.
Callosal connections of both A1+AAF and TA were re-
stricted to homotopic locations of either A1 + AAF or TA in all
but one case. This is different than the patterns of callosal
connections of A1 and TA in squirrels and Mongolian gerbils,
which are most dense with matched locations in the opposite
hemisphere but are also present with other auditory regions
of the cortex (Luethke et al. 1988; Thomas and Lopez 2003).
This was particularly true for the injection in TA in squirrels in
which the injection in TA was relatively large and may have
spread beyond the boundaries of the field (Luethke et al.
1988).
The pattern of thalamic connections of A1 + AAF in voles is
similar to that seen in other rodents in that the majority of
thalamic input to A1 + AAF (Te1) is from MGv, and the major
input to TA (VAF) is from MGd in rats (e.g., Roger and Arnault
1989; Winer et al. 1999; Donishi et al. 2006), mice (Caviness
and Frost 1980; Winer et al. 1999; Llano and Sherman 2008),
squirrels (Wong et al. 2008), and other mammals such as cats
(e.g., Morel and Imig 1987) and monkeys (e.g., de la Mothe et al.
2006). Thalamocortical connections of VAF, similar in location
to our TA, were with both MGd and MGv (Kimura et al. 2007;
Polley et al. 2007).
In the present study, we also observed projections to A1 +
AAF and TA from VP, LGd, and LP. However, not all of these
nuclei project to A1 + AAF and/or TA in all cases (Figs 10-- 12).
VP is associated with somatosensory processing, and LGd and
LP are associated with visual processing. These connections
have not been observed in rats or squirrels. However,
connections with nonauditory nuclei including LP, LD, and
posterior limitans thalamic nucleus associated with visual
processing have been observed in the Mongolian gerbil
(Budinger et al. 2006). The presence of multisensory inputs
to primary auditory areas of the cortex in some rodents but
not others raises the question of what generates this diversity
in cortical organization and connectivity and what types of
behaviors are subserved by a distinct type of processing
network.
Cortical and Thalamic Connections of V1 in Rodents
In the present investigation, we found that connections of V1
were most prominent with other regions of V1 (area 17,
occipital cortex area 1 or Oc1) and with V2 (area 18, Oc2,
lateral visual areas), although the density of these connections
in comparison to connections with other regions of cortex
was different for presumptive central versus peripheral visual
field representations (see Results, Connections of V1). This
pattern of connections is similar to that observed in other
rodents such as mice (Simmons et al. 1982; Wang and
Burkhalter 2007), rats (Miller and Vogt 1984; Malach 1989;
Coogan and Burkhalter 1993; Montero 1993), hamsters
(Olavarria and Montero 1990), and squirrels (Kaas et al.
1989). Interestingly, in the vole, direct connections of V1
were also observed with the auditory cortex, the primary
somatosensory cortex, and the Pyr (Fig. 14B). Connections of
V1 with somatosensory and auditory areas of the cortex have
not been reported in other rodents; however, connections of
V1 have not been investigated in other monogamous rodents.
Callosal connections of V1 in all cases tended to cluster
around the representation of the vertical meridian as is
commonly seen in other rodents (e.g., Thomas and Espinoza
1987; Kaas et al. 1989; Olavarria and Montero 1990; Wang and
Burkhalter 2007) and other mammals. However, like ipsilat-
eral connections, connections were more broadly distributed
to other areas including A1 + AAF, TA, MM, and, in one case,
Pyr. This pattern is not commonly observed in other rodents
or other mammals. Thus, not only are connections of auditory
cortex more broadly distributed in the prairie vole but
connections of other primary areas, such as V1, are broadly
distributed as well.
Thalamocortical connections of V1 are similar to those
observed in other rodents in that the major thalamic input to
V1 is from LGd (Nauta and Bucher 1954; Kaas et al. 1972; Peters
100 Connections of Sensory Cortex in Prairie Voles d
Campi et al.
atSerialsRecordsSectiononAugust21,2015http://cercor.oxfordjournals.org/Downloadedfrom
13. Figure 11. Histograms depicting the percentage of labeled cells in the dorsal thalamus resulting from injections in the auditory core regions (A) in A1 þ AAF (dark gray) and TA
(light gray) and in visual cortex (B). For injections in the A1 þ AAF and TA, cells were mostly in thalamic nuclei associated with auditory processing. However, labeled neurons
were also observed in nuclei of the thalamus associated with somatosensory processing (VP) and visual processing (LGd and LP). (B) Projections to V1 were mostly from thalamic
nuclei associated with visual processing (B), connections with nonvisual nuclei of the thalamus associated with somatosensory processing (VP) and motor processing (VL) were
also observed. For list of abbreviations, see Table 1.
Figure 10. Reconstructions of a coronally cut series of sections through the thalamus for case 08-108. In this case, an injection of FR was placed in A1 þ AAF (Fig. 4). The
resulting locations of labeled cell bodies relative to thalamic nuclei boundaries are shown. Black filled circles represent FR-labeled cells. Most of the labeled cells from the injection
were observed within MGv. A small cluster of labeled cells was observed in LGd/LP. Thin lines denote boundaries of thalamic nuclei, determined based on CO reactivity and Nissl
stains. Sections are 120 lm apart. Other conventions as in previous figures. For list of abbreviations, see Table 1.
Cerebral Cortex January 2010, V 20 N 1 101
atSerialsRecordsSectiononAugust21,2015http://cercor.oxfordjournals.org/Downloadedfrom
14. and Feldman 1976; Caviness and Frost 1980; Simmons et al.
1982) and other mammals (Stone and Dreher 1973; Sanderson
et al. 1980; Perkel et al. 1986; Kahn et al. 2000; Lyon 2007). In
the present study, we also observed projections to V1 from LP,
LD, PO, VL, AV, and VP. However, not all of these nuclei project
to V1 in all cases (Fig. 13). For example, in case 07-76 in which
the injection was in the expected location of the central visual
field representation, connections with VL, VP, and PO were
observed (Fig. 13A). In contrast in case 07-121, in which the
injection was in the expected location of the peripheral visual
field representation, connections with VL, VA, AV, and AM
(anteromedial nucleus) were observed (Fig. 13B). LD and LP
are associated with visual processing, PO and VP are associated
with somatosensory processing, and VL is associated with
motor processing.
Connections Reflect Behavioral Specializations
There are a number of examples of how connections reflect
and likely subserve a variety of behaviors in different mammals
and different sensory systems. For example, in primates,
callosal connections between the hand representation in each
hemisphere are conspicuously absent at early levels of
processing in areas 3a, 3b, 1, and 2 but are extremely dense
in posterior parietal cortical areas (e.g., Jones and Powell
1969; Killackey et al. 1983; Caminiti and Sbriccoli 1985;
Shanks et al. 1985; Padberg et al. 2005; for review, see
Figure 12. Reconstructions of a coronally cut series of sections through the thalamus for cases 07-111 and 07-136. In these cases, an injection of BDA was placed in TA (Fig. 5).
In case 07-111, most of the labeling was anterograde. A small cluster of cells was observed in divisions of MG. In case 07-136, most of the labeled cells were observed in MGd
with some label in MGv. Sparser labeling was also observed in LG, LP, and VP. Thin lines denote boundaries of thalamic nuclei, determined based on CO reactivity and Nissl stains.
These sections are 120 lm apart. Other conventions as in previous figures. For list of abbreviations, see Table 1.
102 Connections of Sensory Cortex in Prairie Voles d
Campi et al.
atSerialsRecordsSectiononAugust21,2015http://cercor.oxfordjournals.org/Downloadedfrom
15. Krubitzer and Disbrow 2008). A number of studies using
a variety of techniques (Hunter et al. 1976; Myers and Ebner
1976; Manzoni et al. 1984) indicate that these connections are
necessary for intermanual transfer of information across
hemispheres and coordination between the hands and
between the hands and the eyes. In the visual system, callosal
connections of V1 are predominantly with the vertical
meridian representation of the opposite hemisphere, and
such connections are proposed to establish functional
continuity of visual hemifield representations for a unified
percept of the visual field and to synchronize neuronal
activity across hemispheres (e.g., Carmeli et al. 2007). Further,
the connections of the central visual representations in V1 are
different than of those of peripheral representations (e.g.,
Gattass et al. 2005; Ungerleider et al. 2008). For example, the
central visual representation in V1 has projections to V4
(dorsomedial visual area), which peripheral representations
do not. On the other hand, the peripheral visual representa-
tion in V1 has projections to V3A and PO. These connectional
differences have been hypothesized to subserve different
types of visual information processing such as object versus
spatial vision (Gattass et al. 2005).
We observed specializations in cortical and thalamic
connections of both V1 and A1 of the prairie vole that form
the substrate for the multimodal neuronal responses that we
observe in these fields. We postulate that this pattern of
connectivity may be related to a constellation of behaviors
associated with their unique niche. Interestingly, the
Figure 13. Reconstructions of a coronally cut series of sections through the thalamus for cases 07-76 (A) and 07-121 (B). FR as placed in V1 in case 07-76 and FE was placed in
V1 in case 07-121 (Fig. 7). The resulting locations of labeled cell bodies relative to thalamic nuclei boundaries are shown. Black filled circles represent FR or FE-labeled cells
resulting from the injection. Most of the labeled cells from the injections were observed within LGd, LP, and LD. A small cluster of labeled cells was observed in VP and PO (A).
Labeled cells were also observed in VL and in case 07-121 in AM, AV, and VA. Thin lines denote boundaries of thalamic nuclei, determined based on CO reactivity and Nissl
stains. Sections are 120 lm apart. Other conventions as in previous figure.
Cerebral Cortex January 2010, V 20 N 1 103
atSerialsRecordsSectiononAugust21,2015http://cercor.oxfordjournals.org/Downloadedfrom
16. multimodal connectivity of primary sensory areas that we observe
inthepresentinvestigationhasbeenobservedinoneotherrodent,
the Mongolian gerbil (Budinger et al. 2006). In contrast to most
mammals and other rodents in particular, the prairie vole and the
Mongolian gerbil are socially monogamous species (Agren 1984;
Carter and Getz 1993). Prairie voles and Mongolian gerbils live in
small groups, usually consisting of a pair-bonded male and female
and 1--2 litters of young. They practice alloparenting in which the
adult male and female as well as juveniles from the previous litter
carefor the young.The social interactions among prairie voles rely
in part on early tactile experience, and differences in this early
experience have dramatic effects on later social interactions
(Bales et al. 2007). Finally, Mongolian gerbils and prairie vole pups
havebeenobservedtovocalizeatmuchhigherratesthanmiceand
rats when separated from their mothers (Motomura et al. 2002),
underscoring the important social role of auditory localization in
these groups compared with other groups of rodents. Although
Norway rats, house mice, and squirrels are social rodents, they are
promiscuous. Males from promiscuous species do not generally
live in the same burrow space as females nor do they form lifelong
associations or pair bonds, and young are cared for exclusively by
females (Poole 1985).
Figure 14. (A) Summary of A1 þ AAF connections in 4 species rodents (A). Similar patterns of multisensory connections can be seen in the 2 socially monogamous rodents.
These connections are not present in the promiscuous rodents. The AC of each rodent is represented by the elongated middle box. The boxes above are cortical area connections.
The boxes below are thalamic nuclei connections. The thickness of the lines represents the relative density of connections. (B) Summary of V1 connections in 4 species of
rodents. A pattern of multisensory connections can be seen in the Prairie vole. These connections are not present in the other rodents. V1 of each rodent is represented by the
elongated middle box. The boxes above are cortical area connections. The boxes below are thalamic nuclei connections. The thickness of the lines represents the relative amount
of connections. The connections of the Mongolian gerbil are from Budinger et al. (2006). The connections of the squirrel are from Kaas et al. (1972), Luethke et al. (1988), Kaas
et al. (1990), and Wong et al. (2008). The connections of the rat are from Peters and Feldman (1976), Miller and Vogt (1984), Malach (1989), Shi and Cassell (1997), Winer et al.
(1999), Kimura et al. (2003), and Polley et al. (2007). Connections from the mouse are from Caviness and Frost (1980), Simmons et al. (1982), and Wang and Burkhalter (2007).
The design of this illustration was inspired by Figure 4 from Budinger et al. (2006). For list of abbreviations, see Table 1.
104 Connections of Sensory Cortex in Prairie Voles d
Campi et al.
atSerialsRecordsSectiononAugust21,2015http://cercor.oxfordjournals.org/Downloadedfrom
17. These behavioral differences in rodents have previously
been linked with differences in hormones, gene expression,
receptor type and distribution, forebrain connections, and
cortical organization (Insel and Shapiro 1992; Carter 1998;
Reep and Kirkpatrick 1999; Bales and Carter 2003; Lim et al.
2004; Campi et al. 2007). Therefore, it is reasonable to
postulate that the differences in cortical and thalamic
connections of auditory and visual cortex in the monogamous
rodents versus the promiscuous rodents may be linked to
communication that subserves important and unique social
interactions. Budinger et al. (2006) propose that the multi-
sensory integration that they observed in the Mongolian gerbil
cortex may be important for sound source localization, spatial
mnemonic functions, spatial attention and navigation, and
even acquisition of conditioned fear response. Admittedly, the
relationship between the extent of multisensory integration
that occurs in the neocortex and the behaviors associated
with particular social conditions within a group need to be
further investigated, but the available data provide strong
support for the proposition that complex social interactions
that are mediated to a large extent by the auditory system
require inputs from other sensory systems as well. Additional
testing of these relationships would also include examination
of other monogamous rodent species, such as the California
mouse or Djungarian hamster.
Multisensory Processing Occurs at Multiple Stages of
Processing
Integration of information from all sensory systems is
necessary for establishing a unified representation of the
environment necessary for making accurate decisions and
responding appropriately to natural stimuli. However, where
in the brain this integration takes place may be dependent on
several factors including but not limited to the evolutionary
history and derived developmental mechanisms of individual
species, the size of the brain, the size of cortex and
subcortical structures, the sensory environment, and specific
demands that unique environments place on developing and
evolving nervous systems. An interesting observation in prairie
voles and Mongolian gerbils is that integration occurs in
primary cortical sensory areas via corticocortical connections
as well as thalamocortical connections. This seems somewhat
surprising because multisensory integration in the cortex is
generally thought to occur in higher order cortical areas such
as in PPC and anterior ectosylvian sulcus (Wallace et al. 1992;
Duhamel et al. 1998; Recanzone 2003; Cohen et al. 2005;
Grefkes and Fink 2005; Stein and Stanford 2008). However,
there are an accumulating number of studies that demonstrate
that multisensory processing in primary fields may actually be
more pervasive than previously believed. For example, studies
in other mammals such as mice (Hunt et al. 2006), tenrecs
(Krubitzer et al. 1997), rats (Wallace et al. 2004), and even
monkeys (Brosch et al. 2005; Ghazanfar et al. 2005) have
demonstrated multimodal responses in primary fields or at
least modulation of neural response by different modalities of
stimulation.
In terms of cortical connections, studies in cats demonstrate
that A1 receives inputs from multisensory thalamic nuclei (e.g.,
Lee and Winer 2008a) and from multimodal cortical areas (e.g.,
Lee and Winer 2008b). Although A1 in monkeys appears to be
interconnected only with other auditory cortical areas (e.g.,
Aitkin et al. 1988; de la Mothe et al. 2006; Hackett, Smiley, et al.
2007), it does receive thalamic inputs from multisensory nuclei
(e.g., Hackett, de la Mothe, et al. 2007). For visual cortex,
multisensory integration has been described between extras-
triate cortical fields and the auditory core (e.g., Cappe and
Barone 2005). Further, feedback connections to V1 originate in
auditory cortex (e.g., Falchier et al. 2002; Clavagnier et al.
2004), but the source of these inputs was not localized to A1
(see Falchier et al. 2002). Feedback projections to V1 have also
been demonstrated to be widespread and include projections
from occipitotemporal and superior temporal regions, as well
as parietal and auditory association areas (Rockland and Van
Hoesen 1994; Rockland and Ojima 2003). Although it is clear
that multisensory integration occurs much earlier in cortical
processing hierarchies than was previously believed, direct
connections between primary sensory areas or between
second sensory areas and primary cortical areas of a different
modality have not been observed in normal adult mammals, as
in the present study or in Mongolian gerbils (Budinger et al.
2006). Further, inputs from primary thalamic projection nuclei
associated with a particular sensory system (e.g., MG, LG, VP) to
primary cortical fields that represent different modalities have
not been observed in normal adult mammals.
In addition to the well-documented integration that occurs
in the superior colliculus, multisensory integration has also
been demonstrated at the level of the thalamus. For example, in
rats, the dorsal and medial divisions of the MGN receive
auditory input from the IC as well as somatosensory input from
the spinal cord, and divisions of MG project directly to ventral
auditory areas Te2 and Te3 (Ledoux et al. 1987; Donishi et al.
2006). Furthermore, electrophysiological recording of neurons
in the MGm demonstrates multisensory responses to auditory
and somatosensory stimuli in rats (Bordi and LeDoux 1994). In
cats, auditory and somatosensory integration has been demon-
strated in the MGm through connections from the external
nucleus of the IC, and multimodal response properties have
been observed in MGm, which in turn projects to A1 and AAF
(Wepsic 1966; Calford and Aitkin 1983; Morel and Imig 1987).
Taken together, data from the present study in prairie voles
as well as studies in other mammals indicate that integration of
multisensory inputs occurs at early stages of cortical process-
ing, and this early integration may be a general feature of
organization shared by all mammals (Ghazanfar and Schroeder
2006). However, the precise pattern of connectivity that
generates this integration is different for different mammals
and, at the cortical level, appears to be associated with niche
and the demands of a particular social environment.
Funding
McDonnell Grant to L.K., the National Institutes of Health (R01-
NS35103 to L.K., MH0703022 to K.B. and S.C.); the National Eye
Institute (T 32 EY015387); University of California; Davis
Graduate Studies block; National Research Service Award
(1F31NS062633-01A1 to K.C.).
Notes
We wish to thank Monica Chau, Sarah Karlen, DeLaine Larsen, and
Adele Seelke for contributing to these experiments and for their helpful
comments on this manuscript. Conflict of Interest: None declared.
Address correspondence to Leah Krubitzer, Center for Neurosci-
ence, University of California, Davis, 1544 Newton Ct, Davis, CA 95616,
USA. Email: lakrubitzer@ucdavis.edu.
Cerebral Cortex January 2010, V 20 N 1 105
atSerialsRecordsSectiononAugust21,2015http://cercor.oxfordjournals.org/Downloadedfrom
18. References
Agren A. 1984. Pair formation in the Mongolian gerbil. Anim Behav.
32:528--535.
Aitkin LM, Kudo M, Irvine DRF. 1988. Connections of the primary
auditory cortex in the common marmoset, Callithrix jacchus
jacchus. J Comp Neurol. 269:235--248.
Allman JM, Kaas JH. 1971. Representation of the visual field in striate
and adjoining cortex of the owl monkey (Aotus trivirgatus). Brain
Res. 35:89--106.
Allman JM, Kaas JH. 1974. The organization of the second visual area (V
II) in the owl monkey: a second order transformation of the visual
hemifield. Brain Res. 76:247--265.
Bales KL, Carter CS. 2003. Developmental exposure to oxytocin
facilitates partner preferences in male prairie voles (Microtus
ochrogaster). Behav Neurosci. 117:854--859.
Bales KL, Lewis-Reese AD, Pfeifer LA, Kramer KM, Carter CS. 2007. Early
experience affects the traits of monogamy in a sexually dimorphic
manner. Dev Psychobiol. 49:335--342.
Beck PD, Pospichal MW, Kaas JH. 1996. Topography, architecture, and
connections of somatosensory cortex in opossums: evidence for five
somatosensory areas. J Comp Neurol. 366:109--133.
Benison AM, Rector DM, Barth DS. 2007. Hemispheric mapping of
secondary somatosensory cortex in the rat. J Neurophysiol.
97:200--207.
Blumberg MS, Sokoloff G. 2001. Do infant rats cry. Psychol Rev.
108:83--95.
Bordi F, LeDoux JE. 1994. Response properties of single units in areas of
rat auditory thalamus that project to the amygdala. II. Cells receiving
convergent auditory and somatosensory inputs and cells antidrom-
ically activated by amygdala stimulation. Exp Brain Res. 98:275--286.
Brosch M, Selezneva E, Scheich H. 2005. Nonauditory events of
a behavioral procedure activate auditory cortex of highly trained
monkeys. J Neurosci. 25:6797--6806.
Budinger E, Heil P, Hess A, Scheich H. 2006. Multisensory processing via
early cortical stages: connections of the primary auditory cortical
field with other sensory systems. Neuroscience. 143:1065--1083.
Budinger E, Laszcz A, Lison H, Scheich H, Ohl FW. 2008. Non-sensory
cortical and subcortical connections of the primary auditory cortex
in Mongolian gerbils: bottom-up and top-down processing of
neuronal information via field AI. Brain Res. 1220:2--32.
Calford MB, Aitkin LM. 1983. Ascending projections to the medial
geniculate body of the cat: evidence for multiple, parallel auditory
pathways through thalamus. J Neurosci. 3:2365--2380.
Caminiti R, Sbriccoli A. 1985. The callosal system of the superior
parietal lobule in the monkey. J Comp Neurol. 237:85--99.
Campi KL, Karlen SJ, Bales KL, Krubitzer L. 2007. Organization of
sensory neocortex in prairie voles (Microtus ochrogaster). J Comp
Neurol. 502:414--426.
Cappe C, Barone P. 2005. Heteromodal connections supporting
multisensory integration at low levels of cortical processing in the
monkey. Eur J Neurosci. 22:2886--2902.
Carmeli C, Lopez-Aguado L, Schmidt KE, De Feo O, Innocenti GM. 2007.
A novel interhemispheric interaction: modulation of neuronal
cooperativity in the visual areas. PLoS ONE. 2:e1287.
Carroll EW, Wong-Riley MT. 1984. Quantitative light and electron
microscopic analysis of cytochrome oxidase-rich zones in the
striate cortex of the squirrel monkey. J Comp Neurol. 222:1--17.
Carter CS. 1998. Neuroendocrine perspectives on social attachment
and love. Psychoneuroendocrinology. 23:779--818.
Carter CS, Getz LL. 1993. Monogamy and the prairie vole. Sci Am.
268:100--106.
Catania KC. 2005. Star-nosed moles. Curr Biol. 15:R863--R864.
Catania KC, Jain N, Franca JG, Volchan E, Kaas JH. 2000. The
organization of somatosensory cortex in the short-tailed opossum
(Monodelphis domestica). Somatosens Mot Res. 17:39--51.
Catania KC, Kaas JH. 1995. Organization of the somatosensory cortex of
the star-nosed mole. J Comp Neurol. 351:549--567.
Catania KC, Remple FE. 2004. Tactile foveation in the star-nosed mole.
Brain Behav Evol. 63:1--12.
Caviness VS, Jr. 1975. Architectonic map of neocortex of the normal
mouse. J Comp Neurol. 164:247--263.
Caviness VS, Jr, Frost DO. 1980. Tangential organization of thalamic
projections to the neocortex in the mouse. J Comp Neurol.
194:335--367.
Chapin JK, Lin CS. 1984. Mapping the body representation in the SI
cortex of anesthetized and awake rats. J Comp Neurol. 229:199--213.
Clavagnier S, Falchier A, Kennedy H. 2004. Long-distance feedback
projections to area V1: implications for multisensory integration,
spatial awareness, and visual consciousness. Cogn Affect Behav
Neurosci. 4:117--126.
Cohen YE, Russ BE, Gifford GW, 3rd. 2005. Auditory processing in the
posterior parietal cortex. Behav Cogn Neurosci Rev. 4:218--231.
Coogan TA, Burkhalter A. 1993. Hierarchical organization of areas in rat
visual cortex. J Neurosci. 13:3749--3772.
de la Mothe LA, Blumell S, Kajikawa Y, Hackett TA. 2006. Thalamic
connections of the auditory cortex in marmoset monkeys: core and
medial belt regions. J Comp Neurol. 496:72--96.
Donishi T, Kimura A, Okamoto K, Tamai Y. 2006. ‘‘Ventral’’ area in the
rat auditory cortex: a major auditory field connected with the dorsal
division of the medial geniculate body. Neuroscience.
141:1553--1567.
Duhamel JR, Colby CL, Goldberg ME. 1998. Ventral intraparietal area of
the macaque: congruent visual and somatic response properties. J
Neurophysiol. 79:126--136.
Ehret G. 2005. Infant rodent ultrasounds—a gate to the understanding
of sound communication. Behav Genet. 33:19--29.
Falchier A, Clavagnier S, Barone P, Kennedy H. 2002. Anatomical
evidence of multimodal integration in primate striate cortex. J
Neurosci. 22:5749--5759.
Fang PC, Stepniewska I, Kaas JH. 2005. Ipsilateral cortical connections
of motor, premotor, frontal eye, and posterior parietal fields in
a prosimian primate, Otolemur garnetti. J Comp Neurol.
490:305--333.
Felleman DJ, Nelson RJ, Sur M, Kaas JH. 1983. Representations of the
body surface in areas 3b and 1 of postcentral parietal cortex of
Cebus monkeys. Brain Res. 268:15--26.
Gallyas F. 1979. Silver staining of myelin by means of physical
development. Neurol Res. 1:203--209.
Gattass R, Nascimento-Silva S, Soares JG, Lima B, Jansen AK, Diogo AC,
Farias MF, Botelho MM, Mariani OS, Azzi J, et al. 2005. Cortical visual
areas in monkeys: location, topography, connections, columns,
plasticity and cortical dynamics. Philos Trans R Soc Lond B Biol Sci.
360:709--731.
Ghazanfar AA, Maier JX, Hoffman KL, Logothetis NK. 2005. Multisensory
integration of dynamic faces and voices in rhesus monkey auditory
cortex. J Neurosci. 25:5004--5012.
Ghazanfar AA, Schroeder CE. 2006. Is neocortex essentially multisen-
sory? Trends Cogn Sci. 10:278--285.
Grefkes C, Fink GR. 2005. The functional organization of the
intraparietal sulcus in humans and monkeys. J Anat. 207:3--17.
Hackett TA, de la Mothe LA, Ulbert I, Karmos G, Smiley J, Schroeder CE.
2007. Multisensory convergence in auditory cortex, II. Thalamo-
cortical connections of the caudal superior temporal plane. J Comp
Neurol. 502:924--952.
Hackett TA, Smiley JF, Ulbert I, Karmos G, Lakatos P, de la Mothe LA,
Schroeder CE. 2007. Sources of somatosensory input to the caudal
belt areas of auditory cortex. Perception. 36:1419--1430.
Hall WC, Kaas JH, Killackey H, Diamond IT. 1971. Cortical visual areas in
the grey squirrel (Sciurus carolinensis): a correlation between
cortical evoked potential maps and architectonic subdivisions. J
Neurophysiol. 34:437--452.
Hubel DH, Wiesel TN. 1968. Receptive fields and functional architec-
ture of monkey striate cortex. J Physiol. 195:215--243.
Hunt DL, Yamoah EN, Krubitzer L. 2006. Multisensory plasticity in
congenitally deaf mice: how are cortical areas functionally
specified? Neuroscience. 139:1507--1524.
Hunter M, Maccabe JJ, Ettlinger G. 1976. Intermanual transfer of tactile
training in the monkey: the effect of bilateral parieto-prestriate
ablations. Neuropsychologia. 14:385--389.
Insel TR, Shapiro LE. 1992. Oxytocin receptor distribution reflects
social organization in monogamous and polygamous voles. Proc Natl
Acad Sci USA. 89:5981--5985.
106 Connections of Sensory Cortex in Prairie Voles d
Campi et al.
atSerialsRecordsSectiononAugust21,2015http://cercor.oxfordjournals.org/Downloadedfrom
19. Jain N, Catania KC, Kaas JH. 1998. A histologically visible representation
of the fingers and palm in primate area 3b and its immutability
following long-term deafferentations. Cereb Cortex. 8:227--236.
Jones EG, Powell TP. 1969. Connexions of the somatic sensory cortex
of the rhesus monkey. II. Contralateral cortical connexions. Brain.
92:717--730.
Kaas JH. 1983. What, if anything, is SI? Organization of first
somatosensory area of cortex. Physiol Rev. 63:206--231.
Kaas JH, Hall WC, Diamond IT. 1972. Visual cortex of the grey squirrel
(Sciurus carolinensis): architectonic subdivisions and connections
from the visual thalamus. J Comp Neurol. 145:273--305.
Kaas JH, Krubitzer LA, Chino YM, Langston AL, Polley EH, Blair N. 1990.
Reorganization of retinotopic cortical maps in adult mammals after
lesions of the retina. Science. 248:229--231.
Kaas JH, Krubitzer LA, Johanson KL. 1989. Cortical connections of
areas 17 (V-I) and 18 (V-II) of squirrels. J Comp Neurol. 281:
426--446.
Kahn DM, Huffman KJ, Krubitzer L. 2000. Organization and connections
of V1 in Monodelphis domestica. J Comp Neurol. 428:337--354.
Kalatsky VA, Polley DB, Merzenich MM, Schreiner CE, Stryker MP. 2005.
Fine functional organization of auditory cortex revealed by Fourier
optical imaging. Proc Natl Acad Sci USA. 102:13325--13330.
Karlen SJ, Krubitzer L. 2007. The functional and anatomical organiza-
tion of marsupial neocortex: evidence for parallel evolution across
mammals. Prog Neurobiol. 82:122--141.
Killackey HP, Gould HJ, 3rd, Cusick CG, Pons TP, Kaas JH. 1983. The
relation of corpus callosum connections to architectonic fields and
body surface maps in sensorimotor cortex of new and old world
monkeys. J Comp Neurol. 219:384--419.
Kimura A, Donishi T, Okamoto K, Imbe H, Tamai Y. 2007. Efferent
connections of the ventral auditory area in the rat cortex:
implications for auditory processing related to emotion. Eur J
Neurosci. 25:2819--2834.
Kimura A, Donishi T, Sakoda T, Hazama M, Tamai Y. 2003. Auditory
thalamic nuclei projections to the temporal cortex in the rat.
Neuroscience. 117:1003--1016.
Krubitzer L, Campi K. 2009. Neocortical organization in monotremes.
In: Squire LR, editor. Encyclopedia of neuroscience. Oxford (UK):
Academic Press. p. 51--59.
Krubitzer L, Clarey J, Tweedale R, Elston G, Calford M. 1995. A
redefinition of somatosensory areas in the lateral sulcus of macaque
monkeys. J Neurosci. 15:3821--3839.
Krubitzer L, Disbrow E. 2008. The evolution of parietal areas involved in
hand use in primates. In: Kaas J, Gardner E, editors. The senses:
a comprehensive reference. London: Elsevier. p. 183--214.
Krubitzer L, Kunzle H, Kaas J. 1997. Organization of sensory cortex in
a Madagascan insectivore, the tenrec (Echinops telfairi). J Comp
Neurol. 379:399--414.
Krubitzer L, Manger P, Pettigrew J, Calford M. 1995. Organization of
somatosensory cortex in monotremes: in search of the prototypical
plan. J Comp Neurol. 351:261--306.
Krubitzer LA, Calford MB. 1992. Five topographically organized fields
in the somatosensory cortex of the flying fox: microelectrode
maps, myeloarchitecture, and cortical modules. J Comp Neurol.
317:1--30.
Krubitzer LA, Sesma MA, Kaas JH. 1986. Microelectrode maps,
myeloarchitecture, and cortical connections of three somatotopi-
cally organized representations of the body surface in the parietal
cortex of squirrels. J Comp Neurol. 250:403--430.
Lee CC, Winer JA. 2008a. Connections of cat auditory cortex: I.
Thalamocortical system. J Comp Neurol. 507:1879--1900.
Lee CC, Winer JA. 2008b. Connections of cat auditory cortex: III.
Corticocortical system. J Comp Neurol. 507:1920--1943.
Ledoux JE, Ruggiero DA, Forest R, Stornetta R, Reis DJ. 1987.
Topographic organization of convergent projections to the thala-
mus from the inferior colliculus and spinal cord in the rat. J Comp
Neurol. 264:123--146.
Lepri JJ, Theodorides M, Wysocki CJ. 1988. Ultrasonic vocalizations by
adult prairie voles, Microtus ochrogaster. Experientia. 44:271--273.
Lim MM, Hammock EA, Young LJ. 2004. The role of vasopressin in the
genetic and neural regulation of monogamy. J Neuroendocrinol.
16:325--332.
Llano DA, Sherman SM. 2008. Evidence for nonreciprocal organization
of the mouse auditory thalamocortical-corticothalamic projection
systems. J Comp Neurol. 507:1209--1227.
Luethke LE, Krubitzer LA, Kaas JH. 1988. Cortical connections of
electrophysiologically and architectonically defined subdivisions of
auditory cortex in squirrels. J Comp Neurol. 268:181--203.
Lyon D. 2007. The evolution of visual cortex and visual systems. In: Kaas
J, Krubitzer L, editors. Evolution of nervous systems: a comprehen-
sive reference. Oxford: Elsevier. p. 267--306.
Malach R. 1989. Patterns of connections in rat visual cortex. J Neurosci.
9:3741--3752.
Manzoni T, Barbaresi P, Conti F. 1984. Callosal mechanism for the
interhemispheric transfer of hand somatosensory information in the
monkey. Behav Brain Res. 11:155--170.
Merzenich MM, Kaas JH, Roth GL. 1976. Auditory cortex in the grey
squirrel: tonotopic organization and architectonic fields. J Comp
Neurol. 166:387--401.
Miller MW, Vogt BA. 1984. Direct connections of rat visual cortex with
sensory, motor, and association cortices. J Comp Neurol.
226:184--202.
Montero VM. 1973. Evoked responses in the rat’s visual cortex to
contralateral, ipsilateral and restricted photic stimulation. Brain Res.
53:192--196.
Montero VM. 1993. Retinotopy of cortical connections between the
striate cortex and extrastriate visual areas in the rat. Exp Brain Res.
94:1--15.
Morel A, Imig TJ. 1987. Thalamic projections to fields A, AI, P, and VP in
the cat auditory cortex. J Comp Neurol. 265:119--144.
Motomura N, Shimizu K, Shimizu M, Aoki-Komori S, Taniguchi K,
Serizawa I, Saito TR. 2002. A comparative study of isolation-induced
ultrasonic vocalization in rodent pups. Exp Anim. 51:187--190.
Mountcastle VB. 2005. The sensory hand: neural mechanisms of somatic
sensation. Boston (MA): Harvard University Press.
Myers RE, Ebner FF. 1976. Localization of function in corpus callosum:
tactual information transmission in Macaca mulatta. Brain Res.
103:455--462.
Naatanen R, Lehtokoski A, Lennes M, Cheour M, Huotilainen M,
Iivonen A, Vainio M, Alku P, Ilmoniemi RJ, Luuk A, et al. 1997.
Language-specific phoneme representations revealed by electric
and magnetic brain responses. Nature. 385:432--434.
Nauta WJ, Bucher VM. 1954. Efferent connections of the striate cortex
in the albino rat. J Comp Neurol. 100:257--285.
Nelson RJ, Sur M, Felleman DJ, Kaas JH. 1980. Representations of the
body surface in postcentral parietal cortex of Macaca fascicularis. J
Comp Neurol. 192:611--643.
Neville HJ, Bavelier D, Corina D, Rauschecker J, Karni A, Lalwani A,
Braun A, Clark V, Jezzard P, Turner R. 1998. Cerebral organiza-
tion for language in deaf and hearing subjects: biological con-
straints and effects of experience. Proc Natl Acad Sci USA. 95:
922--929.
Nussbaumer JC, Van der Loos H. 1985. An electrophysiological and
anatomical study of projections to the mouse cortical barrelfield and
its surroundings. J Neurophysiol. 53:686--698.
Olavarria J, Montero V. 1990. Elaborate organization of visual cortex in
the hamster. Neurosci Res. 8:40--47.
Padberg J, Disbrow E, Krubitzer L. 2005. The organization and
connections of anterior and posterior parietal cortex in titi
monkeys: do New World monkeys have an area 2? Cereb Cortex.
15:1938--1963.
Padberg J, Franca JG, Cooke DF, Soares JG, Rosa MG, Fiorani M, Jr,
Gattass R, Krubitzer L. 2007. Parallel evolution of cortical areas
involved in skilled hand use. J Neurosci. 27:10106--10115.
Payne BR. 1993. Evidence for visual cortical area homologs in cat and
macaque monkey. Cereb Cortex. 3:1--25.
Penfield W, Rasmussen T. 1968. The cerebral cortex of man: a clinical
study of localization of function. New York: Hafner publishing.
Cerebral Cortex January 2010, V 20 N 1 107
atSerialsRecordsSectiononAugust21,2015http://cercor.oxfordjournals.org/Downloadedfrom
20. Perkel DJ, Bullier J, Kennedy H. 1986. Topography of the afferent
connectivity of area 17 in the macaque monkey: a double-labelling
study. J Comp Neurol. 253:374--402.
Peters A, Feldman ML. 1976. The projection of the lateral geniculate
nucleus to area 17 of the rat cerebral cortex. I. General description.
J Neurocytol. 5:63--84.
Pettigrew JD, Manger PR, Fine SL. 1998. The sensory world of the
platypus. Philos Trans R Soc Lond B Biol Sci. 353:1199--1210.
Polley DB, Read HL, Storace DA, Merzenich MM. 2007. Multiparametric
auditory receptive field organization across five cortical fields in the
albino rat. J Neurophysiol. 97:3621--3638.
Poole T. 1985. Social behavior in mammals. New York: Blackie & Sons
Ltd.
Portfors CV. 2007. Types of functions of ultrasonic vocalizations in
laboratory rats and mice. J Am Assoc Lab Anim Sci. 46:28--34.
Pubols BH, Jr, Pubols LM. 1971. Somatotopic organization of spider
monkey somatic sensory cerebral cortex. J Comp Neurol.
141:63--75.
Rabon D, Sawrey D, Webster W. 2001. Infant ultrasonic vocalizations
and parental responses in two species of voles (Microtus). Canadian
Journal of Zoology. 79:830--837.
Recanzone GH. 2003. Auditory influences on visual temporal rate
perception. J Neurophysiol. 89:1078--1093.
Reep RL, Kirkpatrick B. 1999. Forebrain connections of medial
agranular cortex in the prairie vole, Microtus ochrogaster. Exp
Brain Res. 126:336--350.
Remple MS, Henry EC, Catania KC. 2003. Organization of somatosen-
sory cortex in the laboratory rat (Rattus norvegicus): evidence for
two lateral areas joined at the representation of the teeth. J Comp
Neurol. 467:105--118.
Rockland KS, Ojima H. 2003. Multisensory convergence in calcarine
visual areas in macaque monkey. Int J Psychophysiol. 50:19--26.
Rockland KS, Van Hoesen GW. 1994. Direct temporal-occipital
feedback connections to striate cortex (V1) in the macaque
monkey. Cereb Cortex. 4:300--313.
Roger M, Arnault P. 1989. Anatomical study of the connections of the
primary auditory area in the rat. J Comp Neurol. 287:339--356.
Rosa MG, Krubitzer LA, Molnar Z, Nelson JE. 1999. Organization of
visual cortex in the northern quoll, Dasyurus hallucatus: evidence
for a homologue of the second visual area in marsupials. Eur J
Neurosci. 11:907--915.
Rutkowski RG, Miasnikov AA, Weinberger NM. 2003. Characterisation
of multiple physiological fields within the anatomical core of rat
auditory cortex. Hear Res. 181:116--130.
Sanderson KJ, Haight JR, Pearson LJ. 1980. Transneuronal transport of
tritiated fucose and proline in the visual pathways of the brushtailed
possum, Trichosurus vulpecula. Neurosci Lett. 20:243--248.
Shanks MF, Pearson RC, Powell TP. 1985. The callosal connexions of the
primary somatic sensory cortex in the monkey. Brain Res.
356:43--65.
Shapiro LE, Insel TR. 1990. Infant’s response to social separation
reflects adult differences in affiliative behavior: a comparative
developmental study in prairie and montane voles. Dev Psychobiol.
23:375--393.
Shi CJ, Cassell MD. 1997. Cortical, thalamic, and amygdaloid projections
of rat temporal cortex. J Comp Neurol. 382:153--175.
Simmons PA, Lemmon V, Pearlman AL. 1982. Afferent and efferent
connections of the striate and extrastriate visual cortex of the
normal and reeler mouse. J Comp Neurol. 211:295--308.
Stein BE, Stanford TR. 2008. Multisensory integration: current issues
from the perspective of the single neuron. Nat Rev Neurosci.
9:255--266.
Stiebler I, Neulist R, Fichtel I, Ehret G. 1997. The auditory cortex of the
house mouse: left-right differences, tonotopic organization and
quantitative analysis of frequency representation. J Comp Physiol
[A]. 181:559--571.
Stone J, Dreher B. 1973. Projection of X- and Y-cells of the cat’s lateral
geniculate nucleus to areas 17 and 18 of visual cortex. J
Neurophysiol. 36:551--567.
Suga N, Niwa H, Taniguchi I, Margoliash D. 1987. The personalized
auditory cortex of the mustached bat: adaptation for echolocation. J
Neurophysiol. 58:643--654.
Sur M, Nelson RJ, Kaas JH. 1978. The representation of the body surface
in somatosensory area I of the grey squirrel. J Comp Neurol.
179:425--449.
Suta D, Popelar J, Syka J. 2008. Coding of communication calls in the
subcortical and cortical structures of the auditory system. Physiol
Res. 57(3 Suppl):S149--S159.
Thomas H, Lopez V. 2003. Comparative study of inter- and intrahemi-
spheric cortico-cortical connections in gerbil auditory cortex. Biol
Res. 36:155--169.
Thomas H, Tillein J, Heil P, Scheich H. 1993. Functional organization of
auditory cortex in the mongolian gerbil (Meriones unguiculatus). I.
Electrophysiological mapping of frequency representation and
distinction of fields. Eur J Neurosci. 5:882--897.
Thomas HC, Espinoza SG. 1987. Relationships between interhemi-
spheric cortical connections and visual areas in hooded rats. Brain
Res. 417:214--224.
Tiao YC, Blakemore C. 1976. Functional organization in the visual
cortex of the golden hamster. J Comp Neurol. 168:459--481.
Tusa RJ, Rosenquist AC, Palmer LA. 1979. Retinotopic organization of
areas 18 and 19 in the cat. J Comp Neurol. 185:657--678.
Ungerleider LG, Galkin TW, Desimone R, Gattass R. 2008. Cortical
connections of area V4 in the macaque. Cereb Cortex. 18:477--499.
Veenman CL, Reiner A, Honig MG. 1992. Biotinylated dextran amine as
an anterograde tracer for single- and double-labeling studies. J
Neurosci Methods. 41:239--254.
Vidyasagar TR, Wye-Dvorak J, Henry GH, Mark RF. 1992. Cytoarch-
itecture and visual field representation in area 17 of the tammar
wallaby (Macropus eugenii). J Comp Neurol. 325:291--300.
Wagor E, Mangini NJ, Pearlman AL. 1980. Retinotopic organization of
striate and extrastriate visual cortex in the mouse. J Comp Neurol.
193:187--202.
Wallace MT, Meredith MA, Stein BE. 1992. Integration of multiple
sensory modalities in cat cortex. Exp Brain Res. 91:484--488.
Wallace MT, Ramachandran R, Stein BE. 2004. A revised view of sensory
cortical parcellation. Proc Natl Acad Sci USA. 101:2167--2172.
Wang Q, Burkhalter A. 2007. Area map of mouse visual cortex. J Comp
Neurol. 502:339--357.
Welker C. 1971. Microelectrode delineation of fine grain somatotopic
organization of (SmI) cerebral neocortex in albino rat. Brain Res.
26:259--275.
Wepsic JG. 1966. Multimodal sensory activation of cells in the
magnocellular medial geniculate nucleus. Exp Neurol. 15:299--318.
Wiesendanger M. 1999. Manual dexterity and the making of tools—an
introduction from an evolutionary perspective. Exp Brain Res.
128:1--5.
Winer JA, Sally SL, Larue DT, Kelly JB. 1999. Origins of medial geniculate
body projections to physiologically defined zones of rat primary
auditory cortex. Hear Res. 130:42--61.
Wing A, Haggard P, Flanagan J. 1996. Hand and brain: neurophysiology
and psychology of hand movements. London: Academic Press.
Wong P, Gharbawie OA, Luethke LE, Kaas JH. 2008. Thalamic
connections of architectonic subdivisions of temporal cortex in
grey squirrels (Sciurus carolinensis). J Comp Neurol. 510:440--461.
Wong P, Kaas JH. 2008. Architectonic subdivisions of neocortex in the
gray squirrel (Sciurus carolinensis). Anat Rec (Hoboken).
291:1301--1333.
Woolsey TA. 1967. Somatosensory, auditory and visual cortical areas of
the mouse. Johns Hopkins Med J. 121:91--112.
108 Connections of Sensory Cortex in Prairie Voles d
Campi et al.
atSerialsRecordsSectiononAugust21,2015http://cercor.oxfordjournals.org/Downloadedfrom