1. Patent and Access to Drugs – Myths and Realities
Rakhi Gupta
1. Introduction
1st
January 2005 marks the end of an era of copying patented drugs by Indian pharmaceutical
firms backed by the 1970 Patent Act in India. From this date onwards, pharmaceutical firms are
entitled to have product patent protection on their products which thereby prevents copying of the
patented drugs. This has generated a wide spread debate in India. It is feared that a stronger
patent1
regime would increase the drug prices and there by affect access to drugs. In a country
like India where about 65 percent2
of the population is unable to access drugs and 80 to 90
percent3
of private health expenditure is on modern drug, the issue of accessibility to drugs
becomes much more important. One important feature of the Indian pharmaceutical industry is
that it produces cheap drugs. Studies attribute this fall in price to the weak IP regime in India
(Lanjouw, 1998, Foreman 2002). During 1970s drug prices fell significantly. By the 1990s, the
cost of both patented and non- patented drugs in India was much lower than in the developed
world and even significantly less than in neighbouring Pakistan, where health and income
conditions were similar but patent protection existed4
. Comparison of prices of drugs between
India and countries with patent protection indicate that in some cases they are up to 41 times
costlier in countries with patent protection5
. In a country like India where health insurance
coverage is negligible and a large percentage of population is unable to access drugs, the issue of
the impact of a stronger patent regime on accessibility becomes much more important. Under this
backdrop, the paper aims to investigate the extent to which a stronger patent protection influences
access to drugs.
Access to drugs depends on many factors among which price is considered to be one of the most
important factors (WHO 2001, MSF 2001). And it is assumed and predicted by many that IPR
influences drug prices negatively6
(MSF 2001, Challu 1991, Nogues 1993, Bala and Sagoo 2000,
1
TRIPs (Trade Related Aspect of Intellectual Property Rights) complied patent protection which includes
both product and process patent protection.
2
WHO 2004, p. 62
3
WHO 1997, p. 33-34
4
Foreman, M. (2002) Patents, pills and public health: Can TRIPS deliver?
5
National Working Group on Patent Laws (1993) Patent regime in TRIPS : Critical Analysis, p. 13
6
“Negative” implies an increase in drug prices
1
2. Fink 2000, Watal 2000, Chaudhuri, Goldberg and Jia 2003, Ford 2004). The popular argument is
that a strong IPR regime promotes lack of competition. The question need to be asked here is
whether a product patent regime is solely responsible for the lack of competition in the market?
Even in the absence of a product patent regime, whether the drug market is competitive? Besides,
a stronger product patent regime may not be the sole factor that influences prices of drugs. There
are other factors like infrastructure, research and development (R&D) cost, demand, taxes that
also influence drug prices. Therefore looking only into IPR and drugs prices in isolation without
considering the other factors which most of the previous studies on IPR and access has done
won’t help us in understanding the reality. To assess the extent to which a product patent regime
influences drug prices we need to know to what extent other factors influence drug prices. Thus
this study tries to address this limitation of the earlier studies and by analyzing the interaction and
influence of different factors on drug prices, provides an indication on how and to what extent
stronger IPR influences drug prices.
It should be noted that Trade Related Aspects of Intellectual Property Rights (TRIPs) provides
flexibility in terms of Compulsory Licensing (CL) to tackle the high prices of drugs. Moreover,
Govt. of India also has implemented Drug Price Control Order since 1970 to keep the drug prices
of some medicines low. The question that needs to be answered is how far these two mechanisms
are effective in keeping the drug price low in the post 2005 era. An analysis of the effectiveness
of these two mechanisms in keeping the drug price low during the stronger patent regime would
help us in finding out the overall impact of the stronger patent regime on drug prices in India.
The paper is organized in seven sections. The next section concentrates on the data and
methodology. Section three defines access and elaborates different factors that influence
accessibility to drugs. Section four highlights different elements of drug prices and analyzes the
influences of these elements on drug prices. Fifth section provides regression analysis of
competition and drug prices. Section six is dedicated to analyzing the effect of TRIPs flexibility
and the drug price control regime of India on drug prices and the seventh section concludes the
paper with a summary of the findings.
2. Data and Methodology
2.1 Data
2
3. The paper uses panel data collected from the retail pharmaceutical audits of ORG-MARG7
and
information accumulated through primary survey of 30 pharmaceutical firms and interviews8
conducted by the researcher. The panel data includes detailed product-level data on Anti-malarial
and Anti-retroviral (ARV) drug prices and sales over a time period from January 1991 to 2004 for
anti-malarial drugs and January 1998 to 2004 for ARVs. We would like to mention here that the
actual number of firms in both the therapeutic sections is more than the number presented in the
ORG-MARG database. But in the absence of corresponding information on sales and price of the
missing firms, we base our analysis on the information provided by the ORG-MARG database.
As ORG-MARG database covers all the main players in the market, absence of few firms in the
database would not create much of a difference in the result.
The therapeutic segments of anti-malarial and ARV drugs have been selected for two reasons. 1)
A considerable number of people in India suffer from both AIDS and malaria and 2) these two
therapeutic segments provide us with a contrast. Therapeutic segments differ in terms of number
of available drugs, demand, patent status, competitiveness and therefore it can be expected that
the probable impact of product patent regime on accessibility would not be the same across
different therapeutic segments. Most of the anti-malarial drugs are off-patent whereas almost all
the ARVs are under patent. Although the patented drugs are available in India due to the absence
of product patent regime, these two segments by representing localized market with not so
effective demand9
(anti-malarial segment) and global market with effective demand especially in
the West (ARVs) help us to understand the characteristics and structure of the domestic market
across therapeutic segments.
It is important to note that the study is based on the information of pre product patent regime of
India. As the product patent regime started only in the recent past since 1st January 2005, there is
not enough information to analyze the influence of product patent regime on drug prices and
access. Besides, a new regime has to be in effect for a considerable time period before any
analysis on the impact of the said regime can be conducted. Therefore, by looking into the pre
7
ORG MARG, now known as ORG-AC Nielsen is the only source that collects this kind of data. It covers
about 260 firms including domestic and foreign firms in India and represents roughly 90% of the domestic
retail sales of pharmaceuticals. It collects data from a representative panel of thousands of retail chemists in
over 400 cities and towns. Govt. of India uses ORG data to formulate pricing policy and other decisions.
8
Officials from the Ministry of Chemical and Fertilizer (Govt. of India), National Pharmaceutical Pricing
Authority of India (NPPA), pharmaceutical firms, Indian Drug Manufacturers Association (IDMA),
Organisation of Pharmaceutical Producers of India (OPPI), Indian Pharmaceutical Alliance (IPA), NGOs,
patent attorneys and activists.
9
Backed by the money to pay for it.
3
4. patent drug market structure the study tries to understand the impact of different factors on drug
prices. Even in a product patent regime, some of the factors that influence drug prices like
infrastructure, taxes, R&D cost and to some extent demand would continue to influence drug
prices almost in the similar fashion as they did during pre product patent regime. Besides, the
impact of competition on prices can be measured even by using the information of the pre patent
era. One of the main arguments against a product patent regime is that it reduces competition and
thereby influences drug prices negatively. Therefore, by estimating the impact of competition on
prices by using pre patent information, this study would be able to provide an indication about the
fate of drug price during the post strong patent era.
2.2 Methodology
Past studies conducted to find out the impact of product patent on accessibility to drugs mainly
followed three different kinds of methodologies including time series analysis10
, cross section
analysis11
and simulation exercises12
The studies show mixed results although majority of the
studies conclude that product patent regime negatively influence accessibility to medicines. All
these studies are not without methodological problems. For example, a cross sectional analysis13
takes into accounts only those products which were available before the introduction of a stronger
patent regime. With a time frame of eighteen months and drugs from six categories, the study
concludes that product patent regime does not have a measurable impact on the real or normal
prices of existing drugs and thereby access to drugs. Eighteen month is too short a time period to
find out any impact of a new regime on the prices of drugs. More over, to capture the relationship
between product patent and price levels, price movement of new drugs not previously patented
and introduced after the introduction of a product patent regime need to be analyzed. International
price comparison of drugs is also not without pitfalls. It is problematic due to exchange rate
factors and varied purchasing power in different countries. A drug which is relatively inexpensive
in a country A as compared to country B, C etc. may be expensive for the local people of country
10
Challu 1991, Rozek and Berkowitz 1998
11
Bala and Sagoo 2000
12
Challu (1991) Estimated price increase for the market segment subject to patents is 273.2 percent,
Nogues (1993), The losses from consumer misallocation could be as high as US$7.7 billion, Fink (2000)
the price rise with the introduction product patent could be as high as 233.5 to 276.7 percent, Watal (2000),
The study predict a price rise of 242 percent with a constant elasticity-type demand function, Chaudhuri,
Goldberg and Jia (2003) welfare loss in India would be in order of US$ 713 million due to the withdrawal
of four domestic product groups in the fluoroquinolone sub segment, Ford (2004) predicts mean price
increases of over 200%with the introduction of product patent protection
13
Rozek and Berkowitz 1998
4
5. A in terms of purchasing power. Besides, price comparison between developed and developing
countries doesn’t help much in portraying a clear picture because of the differences in the
structure of demand. Demand structure in developing countries differs from that in the developed
countries due to a mix of factors including very low per capita health expenditure, lack of health
insurance coverage, dissimilarity in disease profile, difference in reasons that cause diseases and
conditions14
under which drugs are stored, transported and administered. Simulation exercises on
the other hand do not consider retail prices, taxes, whole sale markups which may increase the
price of drugs considerably between manufacturer and consumer.
This study tries to improve upon the methodological limitations of the past studies and follows an
empirical approach with two components: qualitative analysis and regression analysis. With the
help of the interviews, primary survey conducted by the author and secondary literature, the study
tries to find out the influence of different factors on drug prices. There are mainly four factors
namely R&D cost, hidden costs in the form of taxes, duties, mark ups etc. demand and
competition that influence drug prices, of which R&D cost and hidden costs are not considered
here mainly for two reasons:
- Although R&D cost may play an important role in determining the overall price of the
drug, it is assumed that R&D cost is not influence by the change in patent regime. It must
be noted here that the phenomenon described as “tragedy of anticommon”15
by Heller and
Eisenberg (1998) is induced by the strong patent regime and may increase R&D costs in
the post patent regime. But in the absence of any real information on R&D cost and the
influence of patent regime in increasing the R&D cost, it is assumed that R&D cost is not
influenced by the strong patent regime. It is assumed that the percentage share of R&D
cost in the final drug prices remains same in both the weak16
and strong IPR regime.
14
Lanjouw and Cockburn (2000)
15
Heller and Eisenberg (1998) in a study of biomedical industry in the US and US IP protection policy
show that patent’s overlapping property rights granting mechanism stifles further research and deter
innovation. Private firms operating in the biomedical industry are allowed to apply for patent on newly
identified DNA sequences, including gene fragments, before identifying corresponding gene, protein,
biological function or potential commercial product. Although a database of gene fragment is useful and
handy resource for discovery, patent right on a gene fragment can stifle further research. A commercial
product such as therapeutic protein or genetic diagnostic tests may require multiple fragments which are
owned by different owners. Therefore the firm which is engaged in R&D for developing a product needs to
acquire licenses from the owners of different gene fragments required for development of the product,
thereby making the whole process much more costly and time consuming which Heller and Eisenberg
(1998) describe as “anticommon”.
16
Process patent regime
5
6. - The percentage share of hidden costs in the final drug prices also remains same in both
the regime unless some changes are made by the responsible authorities in the taxes and
mark ups. It is assumed that hidden costs remain same is both the regimes.
The percentage share of the remaining two factors, demand and competition in the final drug
prices are not constant like R&D cost and hidden costs. They change depending on many factors.
Besides more than 90 percent of the firm surveyed by the researcher pointed out that competition
and volume of sales are two most important factors in determining the prices of drugs. In section
four, the study assesses the characteristics of demand, demand elasticity, the structure of
pharmaceutical market and competition in India by using the panel dataset. In section five the
influence of demand and competition on drug prices are tested using regression analysis. This
section provides an indication about the post product patent regime drug prices. Percentage
change in drug price due to loss of one firm from the competition and due to percentage change
in demand has been calculated using the regression analysis. Section five analyzes the influence
of CL and price control regime in preventing drastic increase in drug price using the information
gathered by primary survey, interviews and panel data analysis done in the previous sections of
the paper.
3. Access
According to WHO (2001), access to medicine depends on rational selection and use, affordable
pricing, sustainable financing, and reliable health and supply system. Rational selection and use
includes research and development of drugs as well as adequate development of drugs necessary
for the diseases of developing countries. A drug which is required to treat a particular ailment
must exist. It has been noted that innovations to treat rare diseases and especially diseases
prevalent in the developing countries is largely lacking17
. Bystrom et al (2001) estimates that
between 1975 and 1997, only 13 of 1223 new chemical entities found have useful
pharmacological properties for the treatment of diseases predominantly prevalent in poor
countries. Besides innovating new drugs there is a great need for the improvement of the existing
drugs which have been resistant especially in case of malaria and tuberculosis. In India although
prevalence of reported cases of malaria declined in between 1995 and 2003, the proportion of
Plasmodium falciparum cases, a serious form of malaria which is expensive to treat increased
17
MSF 2001
6
7. during the same period from 38.8 percent in 1995 to 47.5 percent in 200318
. Ministry of Health
and Family Welfare (2005a), India in its report fears an increase in the disease burden from
malaria in the future due to increasing resistance of the malarial parasite to available drugs. There
are many forces that influence innovation of new drugs, one of the most important being the
product patent regime. This issue has been discussed in great detail in another paper. Beside the
availability of drugs, there are other important factors that influence accessibility. The two
fundamental obstacles to accessibility of drugs are lack of finance and lack of appropriate human
resources as has been put forward by the Interim Report on Access to Essential Medicines (2004).
In a country like India, even if a drug is available, it may not reach the patient due to sheer
unavailability of a good distribution system or lack of doctors / nurses. A good distribution
system is needed to deliver medicines safely and in good condition. Drug may not be delivered
due to poor roads, unavailability of distribution network or inadequate geographical coverage of
pharmacies19
. Bale (2001) notes that a drug has three cost elements which include the cost of the
drug itself, the cost of effective distribution, administer and monitor its use and finances to pay
for the first two elements. The element of the cost of the drug can often be the smallest. A WHO
study of administering nevirapine (ARV) in South Africa notes that the cost of drug was about
0.1 percent of the entire cost of administering the drug program20
.
An important barrier to access is lack of proper health care delivery system/ infrastructure. India’s
health care service providing infrastructure is highly inadequate. 94 percent of the pharmaceutical
firms surveyed by the researcher believe that lack of proper health care is the main barrier to
access. Some information on the India’s health care infrastructure and India Govt.’s budgetary
allocation on public health has been provided in table 1 and 2. As can be seen from table 2 that
Govt. of India has devoted a negligible amount towards public health since the very first five year
plan and as a result, health care infrastructure as well as human resources have been scantily
developed in India. Public spending on health in India improved from 0.22 percent in 1950-51 to
1.05 percent during the mid 1980s. But it is stagnated at only 0.9 percent of the GDP in the
current years21
. In 2004, the nurse to population ratio is India was only 1: 1264 whereas in Europe
this ratio is 1: 100-200. The nurse to Doctor ratio in India was 1.3:1 as compared to 3:1 in most
developed countries and doctor to population ratio was at 1:167622
. Further, the availability of
18
Ministry of Health and Family Welfare (2005a), p. 31
19
European Economics 2001
20
Quoted in Bale 2001
21
Ministry of Health and Family Welfare (2005a), p. 71
22
Ministry of Health and Family Welfare (2005a), p. 57-58
7
8. doctors, nurses and even dispensaries are highly skewed in the rural, tribal and hilly areas as
compared to urban areas. Approximately 80 percent of all health care facilities are concentrated
in urban areas even though 70 percent of the population lives in rural regions23
. With this kind of
scanty infrastructure, even if the drugs are provided for free, a majority of Indians won’t be able
to access drugs. According to a study conducted by the Indian Institute of Public Opinion (2000)24
about 65.5 percent of the villages are without any medical facilities. When it comes to a disease
like HIV/AIDS, the situation is much worse. The number of available doctors to treat HIV/ AIDS
patients in India is as low as 25 only, according to an estimation presented in the TREAT Asia’s25
special report. The other two estimates presented in the report also do not provide much hope.
One estimate gives a figure of 1000 doctors and according to other estimate there are only about
500 trained doctors available in India to treat HIV / AIDS patients. A survey with an objective to
understand current AIDS treatment patterns in India conducted among 1269 doctors from 60
towns found that only 362 doctors are managing 90000 (1 doctor for 249 patients) HIV positive
patients26
. There are only presently 39 Anti-Retroviral Therapy (ART) Centers in the country
located mainly in the six high prevalence states of Karnataka, Tamil Nadu, Andhra Pradesh,
Maharashtra, Manipur and Nagaland27
.
Even if facilities are available in some places, they are not efficient especially the Govt. owned
and run facilities. Urban areas are relatively better off as many private facilities are available
especially in the big cities due to presence of a lucrative market. According to a study by VOICE
(2002)28
about 50 percent of the patients avoid government hospitals due to poor quality of
service, even though the facilities are highly subsidized and at times free to the users. As a result
heavy financial burdens are placed on all households, especially poor households, when illness
strikes29
. There is a dire need to improve the health care infrastructure facilities in India.
23
OPPI (2001)
24
The Indian Institute of Public Opinion (2000) A Draft Report on the Reach of Allopathic Medicines in
Four Geographic Regions of India. The study presents the result of a pilot survey conducted in the urban
and rural areas covering 73 cities / towns and 147 villages in the four States of Andhra Pradesh, Bihar,
Maharashtra and Uttar Pradesh. The study examines the reach and prescription of allopathic medicines in
32 therapeutic groups and their marketing mechanism in the urban and rural areas in the four states of
India.
25
AmfAR (2004) TREAT Asia Special Report: Expanded Availability of HIV/AIDS Drugs in Asia Creates
Urgent Need for Trained Doctors, AmfAR, Bangkok.
26
Over et al (2004), p. 12-14
27
Department of Chemicals and Petrochemicals (2005) Draft National Pharmaceuticals Policy, 2006
28
Bejon Misra (2002) A Study on Availability and Prices of Medicines in India, Voluntary Organisation in
Interest of Consumer Education (VOICE)
25 Over et al (2004), p. 23
2926
WHO (2000), Lee D, Balasubramaniam K and Ali HM. (1993)
8
9. We would like to mention here that inadequate health care infrastructure has a bearing on the
demand and thereby prices of drugs. This point would be discussed briefly later in the IV.C
section of the paper. It must be noted here that the separation of different components that
influence access to drugs are somewhat superficial as they interact at some level. Therefore, it is
logical to analyze the different factors that influence accessibility to drugs in some detail. But as
the focus of the study is to find out the impact of product patent regime on prices of drugs, we
limit ourselves mainly to factor of price or in other words affordability.
Price is a major barrier in accessing drugs. High drug prices in developing countries and even in
developed countries are of great concern. As estimated one third of the world’s population lack
access to essential medicines due in part of their cost30
. For example, in 2000, the cost of using
didanosine (ARV) in the Ivory Coast was about US$ 3.48 per patient per day whereas the GNP
per capita per day was only US$ 1.9431
. WHO (2004) notes that the treatment for peptic ulcer
costs almost twice the monthly wage of a government employee in Cameroon and therefore it is
not affordable generally. A study of HIV/ AIDS patients visiting non government provider in
South India estimates that the average drug cost for treating a HIV/ AIDS for six months is about
US$ 393. Another similar kind of study on Delhi, India also estimates an expense of US$ 650 per
annum per capita for treating a HIV/ AIDS patient with ARV drugs which is very high
considering average per capita income of an Indian32
. A study by Over et al(2004) reveals that
although the ARVs from generic manufacturers are available at less than $1 a day in India
(average monthly expenditure on ARVs is Rs. 2498/, around $56, Over et al 2004, p. 30) access
to these drugs are limited as even less than $1 a day is high for most Indians. Based on a survey
of 269 people with HIV/AIDS in four Indian cities, the study found that price is a key variable
affecting its demand. It is interesting to note that although all the firms surveyed by the researcher
find price as one of the important factors in affecting access to drugs, only 6 percent of these
firms think that price is the most important barrier.
The overall health spending in developing countries is very low. In some cases it is as low as
US$2 per capita per year. Therefore, in the developing countries there are not enough resources
available domestically to support quality health care33
. In many sub Saharan countries average
3027
Mossialos and Duke (2001)
3128
Quoted in Ajay Mahal and Bhargavi Rao (2005), p. 583
32
29 Bale (2001)
33
30 European Economics (2001)
9
10. annual income per capita is equivalent or less than $300 and annual healthcare expenditure is less
than $10 per capita per annum. Even if facilities and medicines are present, such low incomes
may prevent access to drugs34
. The health expenditure in India during 2001-02 was approximately
Rs 108,732 crore (US$ 23802.98 million), accounting for 4.8 percent of the GDP at the current
market price. Indian households on average spend around 5 percent-6 percent of their total
expenditure and 11 percent of their non-food consumption expenditure on health35
. In this kind of
a situation a slightest increase in price would exclude a considerable number of people from
accessing drugs. The problem is much grimmer in a country like India due to lack of insurance
coverage. Less than 4 percent of the population is covered by State Health Insurance and private
insurance in restricted to only those few who can afford it36
.
4. Elements of Drug Prices
There is no doubt that price deters access to drugs. In order to access the impact of product patent
regime of drug prices, we need to understand first the different dimensions of price. Price of any
commodity depends mainly on the input cost, market environment i.e., demand and level of
competition. Another important factor that plays an important role in final price determination of
a commodity is tariffs, taxes, whole sale and retail mark ups. Sometimes these tariffs, taxes and
mark ups can increase substantially the final price of a product. In case of drugs, little is known
on the input cost due to high secrecy maintained by the pharmaceutical firms and besides many
argues that most of the pharmaceutical R&D cost is sunk cost. Therefore it becomes difficult to
assign a particular input cost to a particular drug. The most important factors that influence the
price of a commodity are demand and competition.
4.1 Demand
An important factor that influences the price of any commodity including drugs is demand. In
India, a considerable number of people suffer from HIV AIDs and Malaria every year. There are
about 5.1 million HIV infected persons37
in India and around 20 hundred thousand people suffer
from malaria on an average every year38
. It must be noted here that official statistics grossly
3431
Ministry of Health and Family Welfare (2005a) p. 68-69
3532
OPPI (2001)
36
37
NACO estimate cited in Ministry of Health and Family Welfare (2005b), p. 136
38
Ministry of Health and Family Welfare (2005a), p. 15 and estimates provided by National Anti-Malaria
Programme
10
11. underestimate the true number of cases. Reliable data on the disease burden do not exist in India
as large number of patients visit private health care services and this kind of service providers are
not obliged to report cases to public health authorities. However, even we stick to the official
estimates only, it is evident that a major chunk of population suffers from HIV and malaria in
India and therefore there is a great demand for drugs to treat these people. Although there is a
great actual demand for drugs in India, effective demand, demand backed by money to pay for it
is low due to low per capita spending on drugs, lack of health insurance and lack of infrastructure.
A country’s health expenditure system affects domestic drug prices through the structure of
demand. Health expenditure systems vary greatly between rich and poor countries. As the
average per-capita income of a country rises, the share of its total health-care expenditures paid
out of pocket (that is, without public or private insurance) falls39
. In India most of the health
expenditure is met out of the pocket with Government’s contribution being nominal.
Government.’s involvement in the health care is among the lowest in India. Per capita public
expenditure on health in 2003-04 was only Rs. 214.62/ (about US$ 4.78)40
. According to NSS
(National Sample Survey Organization) survey conducted in 1993-94 and 1999-2000, average
percentage of household expenditure on health including diagnostic expenditure was only 5.15
and 5.71 respectively41
. Expenditure of drugs is one of the there main drivers of the health care
expenditure. Drugs form a substantial proportion of Out of Pocket (OOP) spending on health by
households. A NSS survey of 1999-2000 suggests that in rural India 83 percent of the OOP
spending in on drugs whereas it is 77 percent in urban areas42
. Although percentage wise a large
amount of OOP is spent on drugs, actual household spending on drugs is very low. A survey of
1000 household in four States in India carried out in 1998 by the Indian Institute of Public
Opinion (IIPO) show that average household expenditure of a low income family (annual income
of less than US$ 980), medium income family (annual income of US$ 980-4190) and upper
income family (annual income of more than US$ 4190) in rural India on medicine is only US$
4.2, 12.1 and 19.1 respectively43
. In India about 18.85 malarial cases per 1000 population belong
to lower class, 14.21 belong to medium class and 11.33 belong to upper class44
. In case of
HIV/AIDS, about 36 percent of patients receiving treatment in the private sector belong to
39
Hellerstein (2003)
40
Ministry of Health and Family Welfare (2005b), p. 243
41
Quoted in Ministry and Family Welfare (2005a), p. 68
42
Mentioned in Ministry of Health and Family Welfare (2005a), p. 64
43
Mentioned in European Economics (2001)
44
Ministry of Health and Family Welfare (2005a), p. 25
11
12. wealthy or middle class, 37 percent belongs to working class and 27 percent belongs to poor
class45
.
It is because of this kind of scanty spending on drugs and lack of infrastructure, domestic firms
like Cipla, Hetero drugs, Ranbaxy Laboratories and Strides Arcolab, producers of ARVs argue
that cost of medicines are so high46
. In India, the number of patients that receive free treatment
through the ART centers is only 16000. Another 16000 are treated by Railways and ESIC and
10000 by the private sector47
. The fact is that out of over 5 million HIV positive cases only .84
percent of HIV positives get any treatment and consume drugs. Another estimate (Over el al.
2004) suggests that only 2.2 percent of the HIV positive cases receive treatment. Indian generic
ARV manufacturers argue that an African patient pays on an average US$ 18048
per year for
ARVs manufactured by Indian generic firms whereas an Indian patient pays US$ 280 for the
same drug manufactured by the same Indian firms because the scale of economics have not yet
been demonstrated in India. Despite widely announced plans for scaling-up treatment to reach
three million people by the end of 2005, only 40,000 new patients were added to the treatment in
2004. Firms argue that the kind of large scale purchase which could bring down the price of
ARVs below US$ 100 per year can not be attained unless the barrier of inadequate healthcare
infrastructure and finance are removed. In case of malaria, this kind of a problem does not exist.
A considerable number of people suffer from malaria and although due to lack of infrastructure a
good number of people are unable to access the anti-malarial drugs, total number of people
having access to anti-malarial drugs are quite high. Besides, the technology associated with anti-
malarial drug manufacturing is old, well known and easy to handle. Therefore, this segment has
achieved the scale of economics.
Lack of health insurance also has bearing on the demand and the prices of drugs. Health
insurance empowers the consumer to access quality health care irrespective of their economic
status. Besides, consumers bargaining power falls with lack of insurance. Consumers negotiate
drug prices individually in most low-income countries, while in most high-income countries
45
Over et al. (2004), estimates calculated through a survey of physicians treating HIV/AIDS cases.
Estimate is based on the physician’s perception of wealth.
46
Huff (2005)
47
Draft National Pharmaceutical Policy 2006
48
ARV drug price manufactured by Indian generic firms is low in Africa because Indian firms get benefits
from exporting. These firms pay around 30% as tariff on importation of the some of the ARV APIs. After
manufacturing when the final product is exported, these firms can claim back the importation duty paid.
12
13. public or private insurance firms negotiate drug prices on consumers’ behalf. When a large share
of population pays from drugs out of pocket, it can be expected that the drug prices would rise.
In India four kinds of health insurance scheme exist. Private health insurance, employer based
schemes, insurance offered by the NGOs / community based health insurance and mandatory
health insurance schemes run by the government (ESIS, CGHS49
) cover less than 10 percent of
the population in the organized sector50
. The year 1999 witnessed a new era of health insurance in
India. With the passing of the Insurance regulatory Development Authority Bill (IRDA), India
opened the health insurance sector to the private players. Another decision in 2001 allowing
establishment of Third Party Administrators (TPAs) facilitated speedier expansion by providing
an administrative intermediate structure to the insurance industry. Currently about 12 general
insurance companies and 25 TPAs are operating in India. There are about 11.2 million private
insurance holders with almost 90 percent enrolled with the four public sector insurance
companies51
. A number of non-profit social insurance schemes operate in India where members
prepay a set amount each year for specified services52
. The premiums are usually flat rate, not
based on income. At present health insurance is a very small and insignificant part of health
financing with a total premium collection estimated at Rs. 1100 crore (around US$ 241 million)
though growing at 22 percent per year53
. A 1997 study (Ellis and others 200054
) indicates that
people living in rural areas receives the worst health insurance coverage in India followed by
informal sector workers. It must be noted here that without proper infrastructure, health insurance
scheme especially in the rural areas is of not much help. If the service is located at a distance
entailing huge indirect expenses in the form of loss of wages, transport cost etc., poor would not
49
ESIS (Employees State Insurance Scheme). Employees contribution in the scheme is 4.75% of wages
whereas employers contribution is 1.75% of wages. State governments contribute a minimum of 12.5% on
ESIS expenditure in their respective states. Employees working in establishments employing ten or more
persons (with power) or twenty or more persons (without power) and earning less than Rs. 6500 per month
are eligible for this scheme. CGHS (Central Government Health Scheme). Contribution by the employees
varies with the monthly income. A person with less than Rs. 3000/ of monthly income contribute Rs. 15/.
Contribution by the monthly income category of Rs. 3000-6000, 6001-10000, 10001 – 15000 and more
than 15000 is Rs. 40, 70, 100 and 150 respectively. Employees of mainly the Central govt. except for
railways, armed forces pensioners and Delhi administration are eligible for this scheme. Source: Mahal
(2001)
50
Chaudhuri (2005), p. 261. Altogether about 8.8% of the population is covered by health insurance, of
which 0.4% being covered by Private health insurance, 3.4% by Social insurance and 5% by Community
insurance
51
Over et al. (2004) and Ministry of Health and Family Welfare (2005a), p. 95
52
For details see Krasua (2000) who have listed about 26 non-profit social schemes in India.
53
Ministry of Health and Family Welfare (2005a), p. 69
54
Cited in Over et al (2004)
13
14. be attracted to health insurance and the fact is that distribution of health care facility in the
poorest of the districts in India is highly skewed.
A situation with very low expenditure on drugs, insufficient infrastructure and almost non-
existent health insurance generate low demand and thereby affect the drug prices adversely.
Besides, the demand pattern in the domestic pharmaceutical market sends a wrong signal. The
demand elasticity of anti-malarial and ARV drugs in India indicates that sales of these drugs are
not entirely dependent on prices. Economics suggest that as the price of a commodity increases,
demand for that commodity decreases. But in case of drugs a different kind of scenario is noticed.
In case of both anti-malarial and ARV drugs it is observed that well established firms charging
high prices as compared to the available substitutes in the market, enjoy highest share of market
revenue (see Table 3 and 4).
For a detailed analysis, both the therapeutic segments have been divided into sub categories. The
medicines which are mainly used to treat malaria in India are based on Chloroquine, Quinine,
Sulphadoxine + Pyrimethamine and Artemisinin. Artemisinin based drugs have recently been
introduced in India around 1996. Mefloquine is no longer used extensively in India to treat
malaria. Other drugs like Primaquine, Proguanil, Pyrimethamine is not used for clinical cases of
acute attack and not used alone55
. Chloroquine based drugs are sold most in India. In 1991,
revenue share of the chloroquine based drugs was 69.14 percent. Although the revenue share of
chloroquine based drugs has started to decline slightly since 1998 (68.04 percent in 1998, 56.30
percent in 2000 and 50.12 percent in 2004), still it is highest sold drug. A survey done by Liberty
Institute56
in 2002 among the NAMP (National Anti Malaria Programme) sponsored doctors and
private practitioners, finds that, chloroquine is highly preferred as it is cheap and it does not has
any major side effect although almost all malarial state in India is resistant to chloroquine57
. This
finding suggests that price is one of the most important barriers to access. At the same time, it is
very interesting to note here that although due to low price, chloroquine based drugs are
prescribed the most, it is the drugs of IPCA Labs, Bayer and Nicholas Piramal which charge on
an average 100 percent more than the lowest available price in the market enjoy maximum
revenue share in the market. Same trend is noticed for the other categories. Second most sold
anti-malarial drugs for a long period in India was Sulphadoxine+Pyrimethamine based drugs, a
55
Personal communication with Dr. Neena Walecha, Deputy Director, Malaria Research Centre, Indian
Council of Medical Research, Delhi
56
Barun S. Mitra and Richard Tren (2002), p. 44
57
NAMP (1997)
14
15. second line drug of chloroquine58
. This kind of 2nd
line drugs are less effective and more toxic.
When resistance is reported to the 1st
line drug, 2nd
line drug of this kind is prescribed. There are
reports of resistance to this 2nd
line drug also in Assam, West Bengal, Madhya Pradesh and
Karnataka59
. Sulphadoxine+Pyrimethamine based drugs are also as inexpensive as chloroquine
although the rate of revenue generation by this category has declined lately since 2000 pushing it
to the third place. Quinine based drugs are used for treating complicated malaria which is
expensive as compared to Chloroquine and Sulphadoxine+Pyrimethamine based drugs, but less
expensive than Artemisinin based drugs. Although the revenue share of this drug has improved
over time from 0.51 percent in 1991 to 8.70 percent in 1997 and 12.62 percent in 2004, it the
third most sold drug in India at present. Artemisinin based drugs are the most expensive among
the lot, but most effective to treat malaria. No report of resistance to this drug has been found. It
is used for treating Multidrug Resistant Falciparum Malaria (MDR)60
. Although it is the most
expensive anti-malarial drug, revenue share of this drug has increased consistently since its
introduction to the Indian market in 199661
and it is the second most sold anti-malarial drug at the
moment. In case of all the four categories of anti-malarial drugs it has been noticed that the firms
that charge more than the lowest available price in the market sometimes up to 650 percent (Table
3) enjoy the maximum share of revenue.
The trend is no different in the ARV segment. There are mainly three kinds of ARVs available in
India, i.e., Combination drugs, Nucleoside/Nucleotide Analogues and Protease Inhibitors. The
main market leader is Cipla which enjoys more than 90 percent of the revenue share.
Combination drugs are the most preferred drugs and sold the most as these kinds of drugs are
most effective. In terms of prices, not much of a difference is noticed among the drugs of all the
three categories. ARVs are highly expensive. For example, Duovir62
, a combination of
Lamivudine and Zidovudine and one of the highly sold drugs is sold at Rs. 1122/ (around US$
25) by Cipla (60 tablets). A similar kind of a trend where the firms with the maximum share of
revenue charges much more than the lowest available prices in the market that was noticed in the
anti-malarial drugs has also been observed in the ARV categories (Table 4 and 6). Firms with
58
Revenue share of Sulphadoxine+Pyrimethamine based drugs was 27.20%, 17.39%, 15.26% and 9.87% in
1991, 1997, 2000 and 2004 respectively.
59
Barun S. Mitra and Richard Tren (2002), p. 44
60
R. S. Satoskar, S. D. Bhandarkar and Nirmala N. Rege (2005)
61
Revenue share of Artemisinin based drugs has increased from 0.01% in 1996 to 12.95% in 2000 and
21.39% in the 2004.
62
Dosage for adults and adolescents (at least 12 years of age) is one tablet twice daily.
15
16. highest share of revenue sometimes even charge more than 340 percent (Table 4) than the lowest
price available in the market.
The question is why this kind of a trend is noticed in a country like India where a majority of the
population suffering from malaria and HIV/AIDS belong to low income group. We have already
suggested that price is one of the major barriers in accessing medicine. In this kind of a situation,
the drugs offering lowest value should be demanded the most. But the drugs with lowest prices
are not the most preferred drugs in India because of the three reasons. Number one reason is that
in case of drugs, the buyer (patient) and choice maker (doctor) are different. Drugs are not like
other commodities which are sold off the shelf. In order to buy a drug, patients have to first visit a
doctor and get a prescription. We must mention here that in India, many medicines can be bought
off the shelf without a valid prescription from a qualified and registered doctor. For diseases like
fever, normal cough and cold, even malaria, medicines can be bought without valid prescription.
Drugs that provide faster relief and common ailment medicines are easily available over the
counter (OTC)63
. Patients consult chemists for the medicine especially for common ailments even
in the cities. According to a report by VOICE (2002), 71 percent of the city chemists, 40 percent
of the town chemists and 80 percent of the block level chemists are consulted by the patients for
medicines. This high dependence on chemists does not necessarily mean that the drugs offered at
the cheapest price are sold the most. We have already seen that drugs with relatively higher prices
enjoy the maximum revenue share in the market.
The high dependence on chemists and doctors explains this unusual scenario of demand in the
pharmaceutical market and there is little evidence that these people especially the doctors are
highly price conscious. A survey among doctors by VOICE (2002) finds out that doctors
especially the city doctors are not much conscious about the economic condition of the patient.
Town and bock level doctors are relatively more aware of the economic condition of the patients.
Besides, there is hardly any neutral information source where doctors can get information about
drugs which in turn aggravates the situation. In India, promotion and advertisements by the firms
is the main source of such kind of information to the doctors. Lexchin (1995) points out that sales
representatives are frequently the only source of information about medicines in developing
countries where there may be as many as one representative for every five doctors.
Results of other similar kind of studies also suggest a heavy reliance of doctors on promotion for
63
VOICE (2002)
16
17. information on drugs64
. Firms spend a substantial amount on sales promotion65
. Table 5
summaries marketing expenses made by some of the anti-malarial and ARV producer firms in
India between 1991 and 2004. As we can see from the table that the leader firms (in bold) spend
more on marketing than their competitors. Lall (1980) suggests that a great deal of marketing
expenses is borne by the market leaders to gain upper hand on the lowly priced products of the
small competitors.
Even in the developed parts of the world like Europe and USA not much attention is paid to
educate the doctors and pharmacists about the influential capacity of the big pharmaceutical firms
through different forms of drug promotion. An international survey66
to examine the extent to
which medical and pharmacy students are educated about drug promotion finds out that
although in most cases, education on promotion was included within the required
curriculum, time allocation for such topic was negligible, only half a day or less. Another study67
finds out that doctors with private practice and who graduated long ago use promotion of the
pharmaceutical firms as a source of information.
The second reason for the peculiar demand pattern of drugs in the Indian drug market is the heavy
reliance on brands. In a country where counterfeit and inferior quality of drugs is common,
doctors and some times patients especially from a sound economic background place
considerable trust on known brand names. Govt. of India has tried to tackle the situation by
amending the Schedule M of the Drugs and Cosmetics Act in December 2001. With an objective
to ensure product consistency and quality, it has upgraded the Good Manufacturing Practices
(GMP) to the WHO GMP standards. Although it has become mandatory for all the firms to
upgrade their manufacturing facilities, many small scale units are reluctant to upgrade their
facilities in the fear of loosing small scale unit status and the benefits that are attached to small
scale units. A revised Schedule M guideline complied unit requires more than Rs. 25 million
64
A survey (Ahmed and Bhutta 1990) among the pediatricians in Karachi, Pakistan finds that 95% of the
interviewed doctors reply upon industry promotional material. Another study in Sri Lanka (Thomson and
Angunawela 1990) finds similar results. Similar kind of situation also prevails in the western world. In a
1974 FDA (Moser 1974) survey in the USA, 64% of all doctors, and 80% of general practitioners
and pediatricians reported using materials from sales representatives as a source of drug information.
Hibberd and Meadows (1980) finds that 85% of the UK doctors use commercial source to learn
about new drugs. Similarly, the study of Eaton and Parish (1972) show the heavy reliance of British doctors
on promotional materials as a source of information about new medicines.
65
Personal communication between author and about 25 pharmaceutical firms. Marketing practices of the
pharmaceutical firms include free sample, frequent visit by the representatives, glossy pamphlets, free
conference trips/ pleasure trips and expensive presents.
66
Mintzes (2005)
67
Norris et. al. (2005)
17
18. (around US$ 55000) investment whereas units with Rs. 10 million (around US$ 22000)
investment limit is eligible to be a small scale unit68
. More than 10 percent of the available drugs
in the Indian market is sub standard69
. Therefore, well known and established brands of leading
manufacturers are able to charge a significant price premium.
The third reason for the high demand of the relatively highly priced drugs is the lack of health
insurance. Although a patient with health insurance may not be worried about the high price of
drugs, it is against the interest of the health insurers if the highly priced drugs are used. In
countries with high health insurance, health insurers employ a variety of methods to influence
drug prices. One of the most commonly used methods by the insurers is to have a ‘formulary’ of
approved drugs70
.
4.2 Competition
Another important factor that influences the drug prices is competition. Literature suggests that
average drug prices fall with the entry of competition especially generic competition. Availability
of substitutes or competition influences the pricing strategy of pharmaceutical firms. By studying
148 new drugs introduced in between 1978 and 1987, Lu and Comanor (1998) find out that only
13 drugs had no close substitute in their therapeutic class and conclude that this phenomenon
affected the pricing strategy. Caves et al. (1991) estimates that in the United States, with just one
entrant, the average wholesale price of a generic was 60 percent of the branded drug, 29 percent
with 10 entrants and 17 percent with 20 entrants. By studying a sample of commercially
significant products in between 1984 and 1989, Grabowski (2002) finds that generic price
averaged 61 percent of the brand name product during the first month of the generic competition
which declined to 37 percent in two years after entry.
In India there are about 74 anti-malarial and 8 ARV drug producer firms71
. Therefore it can be
expected that Indian pharmaceutical industry is highly competitive and it has a positive impact on
the drug prices. In fact the Indian pharmaceutical industry is highly fragmented with no single
firm having more than 7 percent market share72
and the top ten players account for only 36
68
Chaudhuri (2005), For more information see Working Group on Drugs and Pharmaceuticals (2002) and
Mashelkar Committee (2003)
69
Chaudhuri (2005), p. 250
70
Chaudhuri (2005)
71
ORG-MARG Database
72
Grace (2004)
18
19. percent of the market share in contrast to the global scenario where top ten players account for 49
percent of the pharmaceutical market73
. Although Indian pharmaceutical industry appears to be
competitive, in reality only four (anti-malarial segment) and sometimes only one firm (ARV)
retain the dominant share in the market (Table 3 and 4). The market share of these firms can be as
high as 50 percent (anti-malarial segment) and sometimes even more than 90 percent (ARV). A
study on the various therapeutic segments in India finds out that out of 32 therapeutic classes
considered in the study, in 19 classes four or less than four firms retain dominant market share
ranging from 30 percent to more than 90 percent in few cases. In the remaining 13 classes, five to
eight firms have market share in the range of 30-70 percent. The element of oligopoly cuts across
the entire therapeutic segment whether it is essential drugs like anti-malarial, anti-tuberculosis or
inessential drugs such as vitamins, tonics etc74
. Indian drug industry is highly concentrated and
that explains why the drugs of the leading firms are sold the most in spite of being expensive than
the available substitutes. Even in a highly concentrated market like Indian pharmaceutical
industry, the effect of competition is visible to a certain extent. Table 3, 4 and Fig. 1-7 show how
the price differential between the highly sold expensive drug and lowest available substitute has
decreased with an increase in the total number of participating firms in their respective
therapeutic segments. Besides, the actual price of most of the ARVs and anti-malarial drugs has
fallen. Average mean (inflation adjusted) price of chloroquine based drugs has reduced by 32.03
percent in between 1991 and 2004 (Fig. 8). Similar trend is visible in the other two segments
except for quinine based drugs (Fig. 10 and 11). An overall increase in the prices of quinine based
drugs by 106 percent in between 1991 and 2004 is noticed, although in between 1997 and 2004,
the mean price of quinine based drugs fell by 37 percent75
(Fig. 9). Almost all the ARVs also
show negative growth in terms of prices (Table 6) and this has been possible due to competition
(Fig. 12, 13 and 14).
There is enough evidence to suggest that competition has a positive effect on the drug prices.
Therefore, it has been feared by many that lack of competition induced by product patent regime
would increase the drug prices, thereby making the drugs inaccessible to many. Pharmaceutical
firms argue that the product patent regime does not restrict competition completely. Even in a
product patent regime, monopoly power of patented drugs is constrained by competition from
medicines that treat the same disease condition. Although the time gap between the first and later
entrants varies across therapeutic sections, overall it has reduced over time (Table 7). In some
73
Ranade and Kapur (2001)
74
Ministry of Health and Family Welfare (2005b)
75
Calculation based on ORG-MARG database
19
20. cases the time gap is only 0.25 years. Even in many cases of ARVs, the time gap is just 1 year. As
can be seen from table 7 even in a product patent regime competition exists. Therefore it can be
expected that this kind of competition positively influences the drug prices. In USA, the ARV
drug prices have gone up in spite of the existence of competition. As there are still no patented
ARVs available in India till date, the study looks into the ARV drug prices in USA where most of
the ARVs are still under patent protection. Table 8 shows that in the Nucleoside Analog (NRTI)
segment of ARV, about 12 drugs exist produced by 4 firms which suggest that the NRTI segment
is highly concentrated. And it also explains why the drug prices have not fallen. In most of the
cases, price has increased in the range of 30 percent. In the Protease Inhibitor (PI) segment, there
is about 9 drugs produced by 6 firms and existence of more competitors in this segment show
some positive impact on price. Except for one drug (Norvir), the increase in drug prices is not
very high, in the range of 5-15 percent. Although the drug prices have gone up in most of the
cases, these drugs are not necessarily as expensive as it was few years back. Percentage of
average GDP required to purchase for example Invirase, a PI drug was about 21.69 percent in
1997 whereas in 2005, 18.57 percent of average GDP required to purchase the same drug (Table
8). Although a lesser amount of GDP is required to purchase many of the ARVs as compared to
few years back, still the drugs are very expensive and the presence of few competitors has not
helped much in terms of prices. We would like to mention here that although the competition
scenario in the ARV segment does not look very promising, ARV segment may be much better
off as compared to other therapeutic segments which do not enjoy a large market like ARVs.
Therefore, competition in those segments is negligible.
It is evident from the discussion that competition in the ARV segment has not helped much in
terms of reducing the drug prices except for few occasions where prices dropped. It is unless the
competition from generic firms appeared, the ARV prices did not drop. By keeping the drug
prices low, drug producing firms could have reached a larger population and make some profit
also. But the drug firms do not opt to do so. Vachani and Smith (2004) in their paper Socially
responsible pricing, lessons from the pricing of AIDS drugs in developing countries point out that
multinationals could have earned greater contribution in developing countries by reducing prices,
while also saving thousands of lives. Hellerstein (2003) finds that ARV prices had little
relationship to developing countries’ per-capita incomes in the year 2000 before the onslaught of
generics competition and political pressure in this market. Unless drug producing firms are faced
with some pressure in the form of generic competition or Compulsory Licensing, they do not
reduce the drug prices. The announcement by Cipla, a generic ARV producer firm from India, to
20
21. provide ARV triple drug combination therapy for treating HIV patients at US$ 340 per annum,
literally started a price war in the international pharmaceutical market for the ARVs. Another
announcement by Hetero drugs from Hyderabad to supply ARV triple combination therapy
forced multinational firms like Merck to reduce its price of two ARV drugs by 90 percent in some
of the African countries76
. Due to the competition from generic firms the annual price for triple
therapy came down from US$ 10000 to US$ 350 in a single year77
. In Brazil, ARV prices came
down by 82 percent within five years after Brazil initiated local generic production mainly with
the help of Active Pharmaceutical Ingredient (API) supply from India and provided universal free
HIV treatment to the Brazilians who needed it78
. It is the generics that exhibit high degree of price
competition.
Adelman et. al.(2005) argue that generic drugs are more expensive than the patented drugs in
developing countries. They used the ARV drug price data presented by MSF in its 2005 report79.
MSF has questioned the calculation methodology of the drug prices of this report. It is true that
copied drugs are expensive than the patented drugs in some cases, but it does not disprove the
fact that generic competitions helped in bringing down the ARV prices drastically in developing
countries especially in African countries. Except for drugs in the Protese Inhibitor group, generic
prices are lower than the originator price. There are very few generics in the Protese Inhibitor
group and therefore prices are high. Due to relatively low demand of these drugs, generic firms
are unable to achieve economies of scale and provide it at a cheaper rate. What Adelman et. al
failed to understand is the role of competition. It is coming up again and again that competition
helps in reducing the prices although it the price drop may not be substantially low in all the
cases. The originator firms were selling ARVs at a very high price even in the developing
countries before the generic firms entered the market. For example, the price of the ARV triple
combination drug Stavudine + Lamivudine + Nevirapine80
sold by the originator firms went down
by 93 percent81
in between January 2001 and March 2001 and further another 22.7 percent in
76
Grover (2001)
77
Oxfam (2002)
78
Orsi et al.(2003)
79
MSF (2005) Untangling the Web of Price Reductions: A Price Guide for the Purchase of ARVs for
Developing countries
80
Only two WHO recommended first line triple FDCs (Fixed Dose Combination) are available. And it is
the generic manufacturers that provide these triple FDCs. Originator firms have not made any tripe FDCs
as the patents on them are hold by separate firms. The two WHO recommended first line triple
combinations are 1) Stavudine (40mg.) + Lamivudine + Nevirapine and 2) Zidovudine + Lamivudine +
Nevirapine
81
As the mentioned triple FDC is not available as a single drug by any originator firm, prices of the three
separate pills have been added here.
21
22. between March 2001 and December 2003 due to the introduction of generic competition82
. The
generic version of the same drug is available at $168 (January 2005 price offered by the Indian
firm Hetero drugs)83
.
Evidence from India as well as outside India suggests that competition especially generic
competition plays a very important role in terms of influencing the drug prices.
5. Competition and Drug Prices
In the preceding sections we have seen how drug prices are related to different factors. In this
section we consolidate our understandings of such relationships using a simple regression
analysis.
The model to be estimated is the following:
lnP = 0 + 1lnS + 2lnS2 + 3F + ui
The dependent variable in the equation is the natural logarithm of drug prices. S represents sales,
S2 represents sales square and F represents total number of firms. We have added the parameter
of sales square to develop a better understanding on the impact of demand on drug prices. In the
previous section we have shown that drug prices are not demand elastic and relationship between
drug price and demand is not linear. Besides, the demand represented by sales does not represent
the actual demand. In the section above we have discussed why and how the actual demand is not
translated into sales.
The OLS estimate of the model is reported in Table 9. Column 2 reports the results of anti-
malarial segment and column 3 reports the results of ARV segment.
Table 9: Drug Price and Competition
Anti-malarial
Segment
ARV Segment
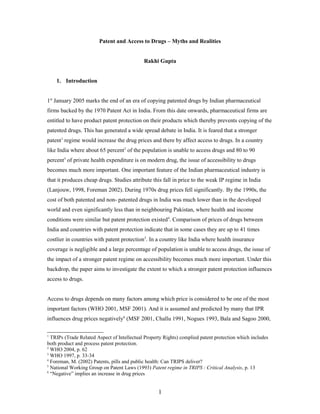
Sales .0703 -.4332
Sales square -.0007 .0227
No. of Firms -.0197 -.3364
No. of Observations 728 77
82
Calculated from the MSF 2005 data.
83
MSF 2005
22
23. The result of the model suggests that competition influences drug prices. The result of anti-
malarial segment suggests that with a decrease of one firm, drug prices may go up by 1.9 percent
and in case ARV the drug price may increase by 33 percent. It should be noted here that this
result gives an indication of the impact of competition and demand on drug prices. As there
would be lesser competition in the post product patent era, it could be expected that prices of the
drugs would be higher. It also suggests that lesser the competition, higher the impact on drug
prices as is evident from the result of ARV segment.
In this regard, we would like to mention here that lack of competition is not always a result of
product patent regime. In the preceding section, we have noticed that even in a weak patent
regime, pharmaceutical market could be uncompetitive. Besides, incidences of merger and
acquisition may also reduce competition. According to Dr. Biswajit Dhar, Professor and Head,
Centre for WTO studies India84
, Indian pharmaceutical market would be less competitive in the
future due to merger and acquisitions. CMIE database on merger and acquisition for the time
period 2001-2005, show 16 cases of mergers and acquisitions in the Indian pharmaceutical
industry. In the absence of market share information of all the acquired and acquirer firms before
and after merger, although it is difficult to measure the impact of consolidation on the drug
prices, one can have some idea about the degree of consolidation by looking into the name of the
acquirers which includes big domestic giants like Nicholas Piramal, Matrix Laboratories and
Cadila Healthcare. Acquisition by firms having big market share further limits the competition in
the market and thereby may affect the price of the drugs. The result above suggests the impact of
lack of competition on drug prices and lack of competition could be a function of many reasons
including strong product patent regime.
The result of the model on demand doesn’t provide us with a clear picture. The co-efficient of
sales for the anti-malarial segment is .0703 and co-efficient of sales square is .0007. This result
support our argument on demand presented in the previous section. In that section we have found
that many factors including lack of infrastructure, low paying capacity of the patients, lack of
insurance etc. affect demand and thereby prevent the manufacturers to achieve scale of economics
resulting into affecting drug prices. The result of the model supports our findings. It suggests that
price increases by 7 percent with a drop of 1 percent in demand and price drops as demand
reaches high level. But the result of the ARV segment is not as suggestive as the result of the
anti-malarial segment. The coefficient of sales is .0027 and co-efficient of sales square is -.4332
84
personal communication
23
24. which doesn’t support the finding that drug price increases with a drop in demand and it
decreases with high demand. One of the possible explanations for this kind of result could be
underdevelopment of the ARV sector and lack of information on demand. Still very little has
been documented about the demand of ARV drugs. Besides, the co-efficient of sales in the result
is not statistically significant. Therefore, the negative value generated by the regression should
not be taken into consideration.
The results of the model suggest that competition plays an important role in influencing the drug
prices. The result of the anti-malarial segment suggests that both competition and demand
influence drug price although influence of demand is more than competition, whereas in case of
ARV the result on the influence of demand is not statistically significant. Therefore, it is not
possible here to conclude which of the two factors influence the drug prices most. The result
suggests significant influence of competition on drug prices, and as product patent regime
decreases competition, we can conclude that lack of competition induced by product patent
regime would affect prices of new drugs in India.
6. TRIPs flexibilities, Drug Price Control Authority and Drug Prices
The TRIPs agreement has tried to deal with the probability of high drug prices due to product
patent regime induced monopoly power through Article 31 (f) which stipulates that a compulsory
license (CL) must be issued predominantly for the supply of the domestic market of Member
granting the license. This means the drug produced under a Compulsory License is to be used
predominately for the domestic market. Further in 2001 at the Fourth WTO ministerial
Conference in Doha, the grounds on which a country could issue a CL for a drug was broadened.
It gave the power to the countries to determine national emergency internally without the
interference of any multilateral authority. The provision of compulsory licensing gives the
countries enough power to tackle with high prices of drugs. India Govt. in its Patent Act of 1970
and 2005 patent amendment under Section 84 has provided the provision of CL. In India any
person after 3 years of the grant of patent can apply for CL if a) the patented invention has not
24
25. been satisfied85
, b) patented invention not available to public at a reasonable affordable price and
c) if the patented invention is not worked86
in the territory of India87
.
Past has seen some countries using compulsory license as a tool to reduce drug prices. Many
developing countries including Malaysia and Indonesia issued order to allow the importation and
local production of generic ARVs for use in public services. Govt. of Cameroon also allowed
import of generic versions of patented medicines for the supply of the non profit sector.
Zimbabwe, Mozambique and Zambia also issued compulsory licenses for the local production of
generic version of patented ARVS88
. One of the pioneers that set precedence in CL is South
Africa. In South Africa two Multinational Corporations (MNCs) namely Glaxo SmithKline and
Boehringer were selling a number of ARV drugs for HIV/AIDs at a much higher rate as
compared to the WHO generic price for the same drugs. These firms also defeated voluntary and
compulsory license negotiation under South African Patent law by demanding 25 percent royalty
on sales as compared to the international rate of 4-5 percent. Upon approached by the “Treatment
Action Campaign”, the Competition Commission of South Africa ruled that pharmaceutical firms
have violated the competition act and recommended that CL should be issued to market generic
versions in return of the payment of reasonable royalty. At the end these MNCs complied. In
India also Government of India has used the provision of CL in favor of public welfare in case of
Glivec89
. Upon the threatening of issuing a CL by the India government, Novertis, producer of
Glivec agreed to supply the drug for free to those patients with earning less than Rs. 3.25 lakh
(around US$ 7145) per annum90
. Novartis supplied Gleevec worth of Rs.325 crore (around US$
71.4 million) free to the cancer patients in India with earning less than Rs.3.25 (around US$
7145) lakh per annum. The real sell of Gleevec is only worth Rs.5 crore (around US$ 1 million)91
.
85
the grounds for non-satisfaction are : non availability, prejudiced trade, prejudiced commercial activity,
inadequate supply of patented article etc. For detail, see the Patent Act.
86
Patented invention has not worked in the India territory on a “commercial scale to an adequate extent or
is not being so worked to the fullest extent that is reasonably practicable” or the working of patent
invention in the Indian territory has been prevented or hindered by the importation of patented article from
abroad
87
The Patent (Amendment) Act, 2005, Section 84
88
MSF (2005)
89
Glivec, a blood cancer drug, got the first EMR (Exclusive Marketing Rights) grant in India. After being
granted with EMR, Novartis, began using the courts to “enforce” its EMR by seeking injunctions against
firms that manufactured, distributed or sold the drug (Cipla, Ranbaxy and Sun). Despite an appeal, Natco
Laboratories is now the only Indian firm permitted to manufacture a generic version of Glivec, which sells
for Rs 10,800 (for a box of 100) compared to Novartis’ US $ 3,600 (for a box of 100).
90
Personal communication with Mr. Charna, OPPI
91
Bob Huff (2005)
25
26. CL provides with a good option to tackle with the situation of high drug prices. But the question
remains is that how feasible compulsory license would be in the post product patent era in luring
the Indian producers in manufacturing generic version of patented drugs introduced after 1st
January 2005. Let us hypothetically assume that a CL has been issued by the Govt. of India to
produce a 2nd line ARV in India. As the situation stands in India now, although a large number
of patients suffer from HIV/AIDS, only negligible percentage of (1-2) patients are accessing HIV
therapy. In this kind of a situation would the generic firms be able to supply drugs at a much
lesser price than the price at which the patent holder sales the drug in the Indian market. A survey
of 103 Indian pharmaceutical firms92
show that only 25 firms think the provision of CL as an
economically feasible incentive to invest in the development of the generic version of the
patented product. The survey conducted by the researcher among the pharmaceutical firms in
India also shows similar kind of result. It is quite interesting to note that although 98 percent of
the surveyed firms think that CL is very good mechanism in keeping a check on the drug prices,
about 90 percent of them think that it’s not economically feasible to invest in the development of
generic version of the patented drugs in the post product patent era under CL. The previous
sections have shown that in the absence of effective demand due to poverty, lack of insurance and
health service providing infrastructure, it becomes quite difficult to achieve scale of economics
by the generic producers. The option of exporting the drug to outside India which helped the
generic ARV producers to achieve some scale of economics earlier is also not possible under the
new patent regime, there by reducing the efficacy of CL in tacking with the high drug price issue.
Now let us look into the Drug Price Control regime of India and find out how effective this
regime is in tacking the high price of drugs. Statutory control on drugs was first introduced in
1962 in India. The Drug Price Control Order (DPCO) was introduced for the first time by the
Govt. of India in 1970 with an objective to keep the prices of drugs at affordable limits to
consumers and at the same time ensure that producers receive reasonable returns. As a result 347
bulk drug came under price control in 1970s. Under the order producers were allowed to charge a
maximum amount of post manufacturing expenses. Over the year, however the number of
controlled drugs has been reduced to 142 in 1987 and 76 in 1995. With 76 drugs under price
control, about one fourth of the drug market is under price control93
. The price control is
implemented based on certain criteria like sales turnover, market monopoly and market
92
Padmashree Gehl Sampath (2005)
93
Ministry of Health and Family Welfare (2005a)
26
27. competition. The maximum retail price calculation for a pharmaceutical formulation is done
using the following formula94
:
Retail Price = (MC+CC+PM+PC) * (1+MAPE/100) + ED, where
MC= Material cost including cost of drugs and other pharmaceutical aids used including overages
and allowance for wastage
CC= Conversion cost – labour, energy, R&D etc.
PM and PC = Packaging materials and packaging charges
MAPE = Maximum allowable post manufacturing expenses including distribution and retail
margins (100 percent)
ED = Excise duty
A drug is subject to price control if annual turnover is the audited market is more than Rs. 40
million (around US$ 88000). A turnover above this minimum revenue level may be exempted if
there are at least five bulk producers and at least ten formulators, none with more than 40 percent
of the audited retail market. Any bulk drug with a turnover above Rs. 10 million (around US$
22000) with a single formulator with 90 percent or more of the market is subject to price control.
As a result of strict drug price control regime, a moderate price rise of less than 5 percent in
between 1994 and 2004 has been noticed in 19 formulations under DPCO. A study of 36 price
controlled drugs show that one fifth of the drugs are either stable or have shown a downward
movement95
. Pharmaceutical firms argue that DPCO is not a good mechanism in keeping the drug
prices low and it should be abolished. 98 percent of the surveyed firms want the mechanism to be
abolished and only 1 percent of the firms find the present drug price control regime to be
satisfactory. One of the main arguments put forward by the pharmaceutical firms is that this kind
of mechanism provides a disincentive in producing the drugs under price control. They argue that
the profit level of drugs under price control is extremely low and in cases negative, thereby
leaving no room for investing in further research on those drugs. In stead of the adversity posed
by price control, some of the big firms supply some of the drugs under price control with an
intention to maintain a larger market presence. During the survey conducted by the researcher,
more that 80 percent of firms agreed with the argument against DPCO stated above. But the
information on firms, producing drugs under price control contradicts this argument. Most of the
anti-malarial drugs except for Artemisinin based drugs are under price control. And this has not
94
Drug Price Control Order (1995), Section 7, Govt. of India
95
Ministry of Health and Family Welfare (2005b), p. 196-201
27
28. prevented more than 60 firms in producing anti-malarial drugs. Only 5 firms produce Artemisinin
based drugs although these drugs are out of the purview of price control. And most of the anti-
malarial drug producing firms is small.
One of the possible explanations for this kind of phenomena could be the absence of a product
patent regime. Technologies for producing anti-malarial drugs are old, out of patent in most of the
cases, well-known and easy to adopt. Besides, due to the absence of product patent regime, firms
could reverse engineer even the patented technology. Therefore small firms could survive by
selling drugs under price control even with a small profit. Under the present product patent
regime, DPCO may provide a disincentive to some firms in producing drugs under price control
especially for those drugs with relatively new and complicated technologies. Therefore, although
drug price control system could keep prices of some drugs low, it may make some of the
controlled drug a scare commodity in the market and it may also scare the potential patentable
pharmaceutical manufacturer. Besides, if a drug is not produced domestically and is wholly
imported96
controlling the price of that drug would be difficult under the DPCO and it may also
encourage transfer pricing.
7. Conclusion
The research suggests that many interrelated factors are responsible for drug prices. Change in
any of these factors may result into an increase in drug prices even in the post product patent era.
Competition and demand appears to be the most important factors in influencing drug prices. It is
difficult to pin point which among these two factors affects drug prices mostly. But there is no
doubt that competition plays a very important role in influencing drug prices. It appears that even
in the absence of product patent regime; Indian pharmaceutical market is not very competitive
due to marketing power of the big pharmaceutical firms, dependence on doctors, asymmetric
information in the hand of the buyers, limited bargaining power of the consumer etc.
Pharmaceutical market is extremely heterogeneous comprising a number of sub markets within
which firms tend to specialize and this phenomenon reduces competition in the market. The
structure of the pharmaceutical market is such that it has a tendency to reduce competition even
in a non product patent regime. Significant difference persists over time between prices charged
by the dominant firms and the small ones without affecting their market share. Element of
monopoly power exists. Peculiar nature of the market with effective decision maker (doctor)
96
Importation of drugs is possible now under the new product patent regime as TRIPs obliges non-
discrimination between imported and locally produced products)
28
29. completely separated from the buyer (patient) combined with inelastic demand and the need for
effective and reliable product does not provide effective price competition. It appears that in
future the domestic market would be more consolidated due to incidences of merger and
acquisition. A product patent regime would narrow down the competition more and thereby
would affect price of the drugs. While the pharmaceutical firms were asked whether the drug
prices would go up in the post product era during the primary survey conducted by the researcher,
about 98 percent of the firms agreed in affirmative. All the surveyed firms mentioned that only
the new drugs patented after 1st
January 2005 would be affected in terms of prices. Evidences
suggest that normal competition in the market does not affect much the prices of drugs. It is the
generic competition that makes a substantial difference in terms of reducing the drug prices.
Generic firms are able to provide the drugs at cheaper rate due to almost negligible R&D
expenditure. Therefore, the obvious choice should be to allow generic competition which would
enhance public welfare. But allowing generic competition may generate disincentive for the
innovative firms. Although this issue is out of the scope of this paper, one should not forget that
one of the main criteria for greater accessibility in the existence of the required drugs. The main
objective of any public policy should be a balanced approach. It should create enough incentive to
develop drugs by innovators in one hand and at the same time take effective measures to keep the
drug prices affordable.
We should note here that only the new drugs and their prices would be affected due to lack of
competition partly induced by the new product patent regime. Old drugs won’t face any increase
in price due to the provision made by the new Patent (Amendment) Act 2005 which ensures
availability of a larger number of generics especially the ARVs. The new law states that generic
copies of the patented drugs (patented abroad, not in India) marketed in India before 1st
January
2005 may continue in the Indian market even if the original drug has been granted patent
protection in India after 1st
January 2005, provided that domestic generic manufacturers pay
‘reasonable’ royalties to the patent holders. Besides, over 90 percent (by value) of the drugs
marketed today in India are off-patent including mostly the antibiotics, steroids, anti-diabetics,
anti-TB products, cardiovascular drugs, vitamin and minerals and protein supplements97
. A 1993
study by Redwood that tried to determine what proportion of drugs would be affected due to
patent protection in the years 1987–2001, if European pharmaceutical product patents had been in
force in India, finds that the combined sales value of the theoretically ‘patent-protected’ products
would have been Rs. 328 crores (approx US$110m), representing 10.9 percent of the total sales
97
OPPI (2004)
29
30. value of the Top 500 products at that time. In summary, prices of about 90 percent of the drugs on
the market in India will not be affected by the introduction of product patents in India98
.
Even if only new drugs patented after 1st
January 2005 would be affected in terms of prices due to
the new product patent regime, there should be some mechanism in keeping these drug prices low
to ensure the welfare of the people of India. Compulsory licensing and price control can be
effective in reducing drug prices. But it appears that provision of Compulsory Licensing would
not be much effective in keeping price of the patented drugs low. The provision of drug price
control on the other hand also does not look very promising in keeping drug prices low in the
future.
It is the peculiar nature of the pharmaceutical market that provides so much of power in the hand
of drug producers. Unless drug producing firms are faced with some pressure in the form of
generic competition or Compulsory Licensing, they do not reduce the drug prices. On the other
hand, lack of proper health care infrastructure denies the firms a wider reach especially in country
like India making it difficult for them to achieve scale of economics. Indian domestic MNCs are
supplying cheap ARVs to the outside world, but not to Indians just due to sheer lack of proper
healthcare infrastructure. We must mention here that blaming only the product patent regime for
the increase in drug prices is not entirely justified. Unless the market structure as well as the
health care infrastructure scenario is changed, drugs prices would be affected. Leaving the drug
price issue on market is not a good idea as drug market structure is quite different and therefore
govt. intervention is required. Government must find out ways to make the manufacturing of
generic version of patented drugs economically feasible for the domestic firms in the post product
patent era under CL. Government also must find ways to make the price control regime little bit
more profitable for the firms so that they don’t shy away from producing the drugs under price
control in future. Under the present situation abolition of the price control regime is not
suggested.
Another point the researcher would like to make here is that two features affect accessibility of
drugs. One is affordability and the other one is the price. Price and affordability is not
synonymous always. Even if the price of some drugs goes up, it does not necessarily mean that
the drug has been less affordable. As we have seen earlier that in USA some ARV drugs became
much more affordable as compared to previous years although the price of those drugs increased.
98
Grace (2004)
30
31. This became possible because the average resources required (measured in terms of average
GDP) to consume those drugs fell. Government of India should pay attention in improving the
economic condition of India and with the improvement of economy, problem of accessibility
would be lessened to some degree.
Table 1: India’s Health Infrastructure
1951 1961 1971 1981 1991 2000 2003
Hospitals Total 2,694 3,054 3,862 6,805 11,174 15,888
% Rural 39 34 32 27 22
% Private 43 57 71.2
Hospitals per
100000
population 0.74 0.69 0.70 0.99 1.32 1.54
Hospital/
Dispensary
Beds Total 117,000 229,634 348,655 504,538 664,135 719,861
% Rural 23 22 21 17 11.06
% Private 28 32 38.2
No. of beds per
hundred
thousand 64 83 95 93
Dispensaries Total 6,600 9,406 12,180 16,745 27,431 23,065
% Rural 79 80 78 69 53
% Private 13 60 57
No. of
dispensaries
per 100000
population 1.82 2.14 2.22 2.44 3.24 2.25
Primary Health
Centre, Sub
Centre and
Community
Health Centres
per 100000
population 0.20 0.61 6.03 13.82 17.81 15.89
Doctors per
100000
population 17.11 39.26 60.87
Nurses per
100000
population 4.99 21.03 81.01
No. Chemists
per 100000
population 48.68
No. of Medical
Representatives
per 100000
29.21
31
32. population
No. of Medical
Colleges per
100000
population 0.02
Source: Compiled by author from Ministry of Health and Family Welfare (2005b), p, 47
and OPPI Pharmaceutical Compendium (2004), p. 15
Table 2: India’s Budgetary Allocation on Health during Different Plan Period
Plan Period Health Outlay as % of Total Budget
1st Plan (19951-56) 3.3
2nd Plan (1956-61) 3
3rd Plan (1961-66) 2.6
Annual Plan (1966-69) 2.1
4th Plan (1969-74) 2.1
5th plan (1974-79) 1.9
Annual Plans (1979-80) 1.8
6th Plan (1980-85) 1.9
7th Plan (1985-90) 1.9
Annual Plans (1990-92) 1.6
8th Plan (1992-97) 1.7
9th Plan (1997-2002) 1.5
10th Plan (2002-07) 1.4
Source: OPPI Pharmaceutical Compendium (2004), p. 13
Table 3: Trend in price differential between the price charged by the firm with largest
sales and lowest available price in the retail formulations of Anti-malarial and ARV
drugs in India
Anti-malarial
Drug
Category
Year Percentage
price
differential
between
the prices
charged by
the firm
with
largest
share in
the market
and lowest
available
price in
the market
No.
of
firms
ARV Drug Category Year Percentage
price
differential
between the
prices
charged by
the firm
with largest
share in the
market and
lowest
available
price in the
market
No.
of
firms
Chloroquine Combination Therapy
1991 150 17 2001 74 3
1997 100 24 2002 342 4
2000 75 31 2003 159 4
32
33. 2004 100 27 2004 109 4
Quinine Nucleoside/Nucleotide
Analogues
1994 3100 5 2000 27 3
1997 650 9 2002 248 6
2000 625 15 2003 202 6
2004 650 16 2004 57 5
Sulphadoxine
+
Pyrimethamine
Protease Inhibitors
1991 67 14 2001 78 3
1997 25 17 2002 66 3
2000 0 19 2004 0 3
2004 0 15
Artemisinin
1996 Nil 1
1998 27 3
2000 26 4
2004 11 5
Source: Calculation by author based on sales and price data of ORG-MARG
Table 4: Market Concentration in Retail Formulation Sales of Anti-Malarial and ARV
Drugs in India
Year Share
of
Largest
Firm
(%)
Name
of the
firm
Share
of top
two
firms
(%)
Name of
the 2nd
largest
firm
Shar
e of
top
three
firms
(%)
Name of
the 3rd
largest
firm
Share
of top
three
firms
(%)
Name
of the
4th
largest
firm
Total
no.
of
firms
Share
of
Largest
firm
(%)
Nam
e of
the
firm
No.
of
firms
1991 34.2 IPCA
Labs
49.56 Bayer 60.1 Nicholas
Piramal
70.47 Lupin
Labs
37 100 Cipla 1
1998 39.88 IPCA
Labs
50.57 Bayer 61.26 Nicholas
Piramal
70.99 Plethico
Pharma
64 85.16 Cipla 3
2000 41.32 IPCA
Labs
53.94 Plethico
Pharma
61.87 Bayer 67.4 Nichola
s
Piramal
75 90.46 Cipla 7
2004 49.82 IPCA
Labs
57.59 Themis
Medicare
63.36 Bayer 67.75 Cadila 75
Source: Calculation by author based on sales data of ORG-MARG
Table 5: Marketing Expenses of Some of the Anti-Malarial and ARV Producing Firms
Name of
the Firm
Year Marketin
g expense
as % of
sales
Year Marketin
g expense
as % of
sales
Year Marketin
g expense
as % of
sales
Year Marketing
expense as
% of sales
Alembic 1991 3.69 1995 6.90 2000 5.51 2004 9.34
Anglo-
French
1991 1.29 1995 1.61 2000 4.11 2004 5.2
33
35. FDC Duovir Cipla -41.08 29 11
FDC
Triomu
ne Cipla -19.09 18 12
FDC Odivir Cipla 2.05 7
FDC Zidolam
Genix
Pharma -12.28 18 13
FDC Nevilast
Genix
Pharma 8.02 12
FDC
Lamista
r
Genix
Pharma -1.59 6
FDC
Viroco
mb
Ranbax
y
-
15.33 13 11
FDC
Virolan
s
Ranbax
y
-
11.13 14 12
FDC Virolis
Ranbax
y -9.9 6
Nucleos
ide
analog
(NRTI)
Lamida
c
Zydus-
Cadila -67.34 25 5
NRTI Lamivir Cipla -55.53 29 8
NRTI Stavir Cipla -90.22 32 2
NRTI Dinex Cipla
-
53.41 36 15
NRTI Stavex
Citadel
Aurobin
do
-
29.09 6
NRTI Hepitec
Glaxo-
Smithcli
ne -63.75 93 29
NRTI
Heptavi
r
Genix
Pharma
-
10.89 8 6
NRTI Virolam
Ranbax
y -7.66 7 5
Protease
Inhibito
r (PI) Indivan Cipla -26.92 75 44
PI Virodin
Ranbax
y 45
PI Viramid
Lupin
Labs -3.98 35
Source: Calculation by author from ORG MARG Data, Drug Today and CIA World
Hand Book
Table 7: Shrinking Monopoly Power of Patented Drugs including ARVs
35
36. Innovation drug
Year of
introduction
Year
gap
Year of
introduction
of follower
drug
Competing
innovations
Inderal 1965 13 1978 Lopressor
Tagamet 1977 6 1983 Zantac
Capoten 1980 5 1985 Vasotec
AZT 1987 4 1991 Videx
Mevacor 1987 4 1991 Pravachol
Prozac 1988 4 1992 Zoloft
Diflucan 1990 2 1992 sporanox
Recombinate 1992 1 1992 Kognate
Invirane 1995 0.25 1996 Norvir
Celebrex 1999 0.25 1999 Vivxx
NRTI AZT 1987 4 1991 Videx
5 1992 Hivid (ddc)
7 1994
Zerit (d4t)
(stavudine)
8 1995 Lamividune (3TC)
NNRTI Viramune 1996 1 1997 Rescriptor
2 1998 Sustiva
Protease Inhibitor
(PI) Fortovase 1995 1 1996 Norvir
1 1996 Crixivan
2 1997 Viracept
4 1999 Agenerase
Source: Compiled by author from different sources including 'Lazarus Drug': ARVs in
the treatment era, www.irinnews.org/webspaecials/ARV-era/48814.asp accessed on 22nd
March 2006, USPTO, Carmen Pérez-Casas (2000) and OPPI Pharmaceutical
Compendium 2004, p. 46
Table 8: ARV Related Information, USA
Class Brand
name
Patent Owner Year of
FDA
Approval
% Growth in Price (Inflation
Adjusted)
% of GDP Required for Yearly
Treatment
1994-
2005
1991-
2005
1997-
2005
1998-
2005
1991 1994 1997 1998 2005
Nucleoside
Analog
(NRTI)
Retrovir Glaxo-Smith
Kline
1987 31.39 10.31 5.87
NRTI Videx and
VidexEC
Bristol-Myers
Squibb
1991 32.37 9.04 9.37
NRTI Hivid Roche
Pharmaceuticals
1992 3.4 8.76 7.8
NRTI Zerit Bristol-Myers 1994 31.45 9.23 10.54
36
37. Squibb
NRTI Epivir Glaxo-Smith
Kline
1995 29.09 8.52 8.94
NRTI Ziagen Glaxo-Smith
Kline
1998 30.76 10.12 12.73
NRTI Combivir Glaxo-Smith
Kline
1999 20.54
NRTI Trizivir Glaxo-Smith
Kline
2000 33.27
NRTI Viread Gilead Sciences 2001 13.87
NRTI Emtriva Gilead Sciences 2003 8.81
NRTI Epzicom Glaxo-Smith
Kline
2004 21.67
NRTI Truvada Gilead Sciences 2004 22.69
Non-
Nucleoside
Analog
(NNRTI)
Viramune Boehringer-
Ingelheim
1996 26.59 10.82 11.81
NNRTI Rescriptor Agouron
Pharmaceuticals,
a Pfizer
Company
1997 9.03
NNRTI Sustiva Bristol-Myers
Squibb
1998 -4.06 14.66 13.53
Protease
Inhibitor
(PI)
Invirase Roche
Pharmaceuticals
1995 -1.09 21.69 18.57
PI Fortovase Roche
Pharmaceuticals
1995 7.34
PI Crixivan Merck and Co. 1996 3.18 17.91 15.92
PI Norvir Abbott
Laboratories
1996 54.83 27.54 37.63
PI Viracept Agouron
Pharmaceuticals
1997 13.26 22.15 21.62
PI Ageneras
e
Glaxo-Smith
Kline
1999 7.35
Pi Kaletra Abbott
Laboratories
2000 20.1
PI Reyataz Bristol-Myers
Squibb
2003 24.2
PI Lexiva Glaxo-Smith
Kline
2003 17.98
Source: Source: Calculation by author from the data source www.thebody.com, Accessed
on 23rd March 2006, Enid Vázquez and Tony Hosey (2005), WHO, UNAIDS (1998),
Katherine Floyd and Charles Gilks (2001) and Bureau of Labor Statistics, USA
Fig. 1
37
38. Price Differential and No. of Firms in the Chloroquine Segment of
Anti-m alarial Drygs
0
5
10
15
2 0
2 5
3 0
3 5
19 9 1 19 9 7 2 0 0 0 2 0 0 4
Year
No.offirms
0
2 0
4 0
6 0
8 0
10 0
12 0
14 0
16 0
%Pricedifferential
N o . o f f ir m s
P e r c e n t a g e p r ic e d if f e r e n t ia l
b e t w e e n t h e p ric e s c h a rg e d b y
t h e f irm w it h la r g e s t s h a r e in
t h e m a r k e t a n d lo w e s t
a v a ila b le p r ic e in t h e m a r k e t
Fig. 2
Price Differential and No. of Firms in the Quinine Segment of Anti-
malarial Drugs
0
2
4
6
8
10
12
14
16
18
19 9 4 19 9 7 2 0 0 0 2 0 0 4
Year
No.offirms
0
5 0 0
10 0 0
15 0 0
2 0 0 0
2 5 0 0
3 0 0 0
3 5 0 0
%Pricedifferential
N o . o f f ir m s
P e rc e n t a g e p r ic e
d if f e re n t ia l b e t w e e n t h e
p ric e s c h a rg e d b y t h e f irm
w it h la rg e s t s h a re in t h e
m a rk e t a n d lo w e s t a v a ila b le
p ric e in t h e m a rk e t
Fig. 3
38
39. Price Differential and No. of Firms in Sulphadoxine + Pyrim etham ine
Segm ent of Anti-malarial Drugs
0
2
4
6
8
10
12
14
16
18
2 0
19 9 1 19 9 7 2 0 0 0 2 0 0 4
Year
No.offirms
0
10
2 0
3 0
4 0
5 0
6 0
7 0
8 0
%Pricedifferential
N o . o f f irm s
P e rc e n t a g e p ric e d if f e r e n t ia l
b e t w e e n t h e p ric e s c h a rg e d b y
t h e f irm w it h la rg e s t s h a re in
t h e m a rk e t a n d lo w e s t
a v a ila b le p ric e in t h e m a r k e t
Fig. 4
Price Differential and No. of Firm s in the Artem isinin Segm ent of
Anti-m alarial Drugs
0
1
2
3
4
5
6
19 9 8 2 0 0 0 2 0 0 4
Year
No.offirms
0
5
10
15
2 0
2 5
3 0
%Pricedifferential
N o . o f f irm s
P e rc e n t a g e p r ic e d if f e re n t ia l
b e t w e e n t h e p ric e s c h a r g e d b y
t h e f ir m w it h la rg e s t s h a re in
t h e m a rk e t a n d lo w e s t
a v a ila b le p ric e in t h e m a rk e t
Fig. 5
39
40. Price Differential and No. of Firms in the Com bination
Therapy Segm ent of ARV Drugs
0
0 .5
1
1.5
2
2 .5
3
3 .5
4
4 .5
2 0 0 1 2 0 0 2 2 0 0 3 2 0 0 4
Year
No.offirms
0 .0 0
5 0 .0 0
10 0 .0 0
15 0 .0 0
2 0 0 .0 0
2 5 0 .0 0
3 0 0 .0 0
3 5 0 .0 0
4 0 0 .0 0
%Pricedifferential
N o . o f f irm s
% P ric e d if f e re n t ia l b e t w e e n
t h e p ric e s c h a rg e d b y t h e f irm
w it h la r g e s t s h a re in t h e
m a rk e t a n d lo w e s t a v a ila b le
p r ic e in t h e m a rk e t
Fig. 6
Price Differential and No. of Firms in the
Nucleoside/Nucleotide Analogues Segm ent of ARV Drugs
0
1
2
3
4
5
6
7
19 9 9 2 0 0 0 2 0 0 1 2 0 0 2 2 0 0 3 2 0 0 4
Year
No.offimrs
0 .0 0
5 0 .0 0
10 0 .0 0
15 0 .0 0
2 0 0 .0 0
2 5 0 .0 0
3 0 0 .0 0
%Pricedifferential
N o . o f f irm s
% P ric e d if f e re n t ia l
b e t w e e n t h e p ric e s
c h a rg e d b y t h e f irm w it h
la rg e s t s h a r e in t h e m a rk e t
a n d lo w e s t a v a ila b le p ric e
in t h e m a rk e t
Fig. 7
Price Differential and No. of Firms in the Protease Inhibitors
Segment of ARV Drugs
0
1
1
2
2
3
3
4
2 0 0 1 2 0 0 2 2 0 0 4
Year
No.offirms
- 10 .0 0
0 .0 0
10 .0 0
2 0 .0 0
3 0 .0 0
4 0 .0 0
5 0 .0 0
6 0 .0 0
7 0 .0 0
8 0 .0 0
9 0 .0 0
%Pricedifferential
N o . o f f irm s
% P r ic e d if f e r e n t ia l b e t w e e n
t h e p r ic e s c h a r g e d b y t h e
f irm w it h la rg e s t s h a r e in
t h e m a rk e t a n d lo w e s t
a v a ila b le p ric e in t h e
m a rk e t
40
41. Fig. 8
Average Mean Price and No. of Firms in the Chloroquine Segment of
Anti-m alarial Drugs
0
5
10
15
2 0
2 5
3 0
3 5
1991
1993
1995
1999
2002
2004Year
No.offirms
0 .0 0
0 .5 0
1.0 0
1.5 0
2 .0 0
2 .5 0
3 .0 0
3 .5 0
Averagemean
price
N o . o f F ir m s
A v e ra g e M e a n P ric e
(a d ju s t e d w it h c o n s u m e r
p ric e in d e x )
Fig. 9
Average Mean Price and No. of Firms in the Quinine Segm ent of
Anti-m alarial Drugs
0
2
4
6
8
10
12
14
16
18
1991
1993
1996
1999
2002
2004
Year
No.offirms
0 .0 0
1.0 0
2 .0 0
3 .0 0
4 .0 0
5 .0 0
6 .0 0
7 .0 0
8 .0 0
9 .0 0
10 .0 0
Averagemeanprice
N o . o f F ir m s
A v e ra g e M e a n P ric e
(a d ju s t e d w it h c o n s u m e r
p ric e in d e x )
Fig. 10
Average Mean Price and No. of Firms in the Sulphadoxine
+ Pyrimethamine Segment of Anti-malarial Drugs
0
2
4
6
8
10
12
14
16
18
2 0
1991
1993
1996
1999
2002
2004
Year
No.offirms
0 .0 0
0 .5 0
1.0 0
1.5 0
2 .0 0
2 .5 0
3 .0 0
Averagemeanprice
N o . o f F irm s
A v e ra g e M e a n P ric e
(a d ju s t e d w it h c o n s u m e r
p r ic e in d e x )
41
42. Fig. 11
Average Mean Price and No. of Firm s in the Artem isinin Segm ent
of Anti-malarial Drugs
0
1
2
3
4
5
6
1996
1998
2000
2002
2004Year
No.offirms
0 .0 0
5 .0 0
10 .0 0
15 .0 0
2 0 .0 0
2 5 .0 0
3 0 .0 0
Averagemena
price
N o . o f F ir m s
A v e ra g e M e a n P ric e
( a d ju s t e d w it h c o n s u m e r
p ric e in d e x )
Fig. 12
Average Mena Price and No. of Firms in the Com bination
Therapy Segment of ARV Drugs
0
0 .5
1
1.5
2
2 .5
3
3 .5
4
4 .5
2 0 0 1 2 0 0 2 2 0 0 3 2 0 0 4
Year
No.ofFirms
0 .0 0
10 .0 0
2 0 .0 0
3 0 .0 0
4 0 .0 0
5 0 .0 0
6 0 .0 0
7 0 .0 0
8 0 .0 0
AverageMean
Price
N o . o f F ir m s
A v e ra g e M e a n P ric e
(a d ju s t e d w it h c o n s u m e r p r ic e
in d e x)
Fig. 13
Average Mean Price and No. of Firms in the
Necleoside/Nucleotide Analogus Segment of ARV Drugs
0
2
4
6
8
19 9 9 2 0 0 0 2 0 0 12 0 0 2 2 0 0 3 2 0 0 4
Year
No.offirms
0 .0 0
2 0 .0 0
4 0 .0 0
6 0 .0 0
8 0 .0 0
10 0 .0 0
12 0 .0 0
Averagemean
price
N o . o f F irm s
A v e ra g e M e a n P r ic e
(a d ju s t e d w it h c o n s u m e r
p r ic e in d e x )
Fig. 14
42