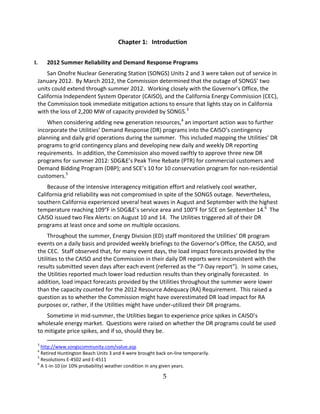
This report analyzes the performance of demand response programs operated by San Diego Gas & Electric and Southern California Edison in summer 2012. It finds that while some programs met or exceeded daily load reduction forecasts, on average the ex post results diverged significantly from forecasts due to inadequate forecasting methods, program design flaws, and non-performance. It also finds that comparing ex post results to resource adequacy forecasts is not a good indicator of performance, and that the utilities used demand response programs fewer times and hours than permitted peaker plant usage. The report provides recommendations to improve demand response program design, operations, forecasting, and coordination with grid operators.


![44
There is potential ‘‘free ridership’’ issue in SCE’’s PTR.
C. SDG&E’’s Peak Time Rebate/Reduce Your Use
1) Summary
Overall, customers are satisfied with the program. There is difference, however, in load
awareness and load reduction between customers who opted into receiving alerts and the rest
of the population. Only customers who opted into receiving utility notification significantly
reduced load. However, the entire population qualifies for bill credits. Awareness of the
program, reflected by the willingness to sign up for receiving alerts, seems to indicate more
willingness to reduce load. Staff identified an issue with ‘‘free ridership’’, where customers are
paid even though they didn’’t significantly reduce any load. Staff recommends changing PTR
from a default program to an opt in program, paying bill credits only to customers who opt in
to participate.
2) Background
D.08 02 034 approved the Reduce Your Use program, SDG&E’’s Peak Time Rebate (PTR) rate,
the first dynamic rate of such design approved by the Commission65
. The program has been
available since the summer of 2012, with a pilot in 2011.
The program is implemented as proposed: ‘‘A two level PTR incentive with a higher level
payment for customers who reduce electric usage below an established CRL [customer
reference level]66
with enabling demand response technology, and a lower level payment to
customers without such technology.’’67
Customers receive a bill credit of 0.75$/kWh with an additional credit of 0.50$/kWh for
customers with enabling technology. SDG&E’’s tariff lists programmable communicating
thermostats (PCTs), AC cycling, pool pump cycling as examples of technologies eligible for the
0.50¢/kWh additional incentive.68
Commission has approved the addition of In Home Displays
(IHD) to the list of enabling technologies in SDG&E’’s tariff.69
The utility may call events throughout the year without limit to the number of events called.
Events will take place between 11am and 6pm on days an event is called and participants
receive a day ahead notification of the event. Bill credits will be paid in each billing cycle based
65
SCE’’s Save Power Day program was approved in 2009 on D.09 08 028.
66
Defined as the ‘‘total consumption for the PTR event period averaged over the three (3) highest days from within
the immediately preceding five (5) similar non holiday week days prior to the event. The highest days are
defined to be the days with the highest total consumption between 11 a.m. and 6 p.m. The similar days will
exclude weekends, holidays, other PTR event days, and will exclude other demand response program event days
for customers participating in multiple demand response programs.’’ SDG&E PTR Tariff.
67
D.08 02 034 at 22.
68
SDG&E PTR tariff defines enabling technologies as to be ‘‘initiated via a signal from the Utility, either directly to
the customer or the customer’’s device, or via a third party provider to the customer or the customer’’s device
that will reduce electric energy end use for specific electric equipment or appliances, is included in a designated
Utility demand response program, and that is acceptable to and approved by the Utility, subject to the
verification of processes necessary to safeguard confidential and proprietary Utility and customer information.’’
69
D.13 04 017, OP 22](https://image.slidesharecdn.com/c001a13b-ff6c-41bb-82d4-23e00bb4a306-150719004611-lva1-app6891/85/StaffReport_2012DRLessonsLearned-48-320.jpg)


![81
PTR Com
& Res
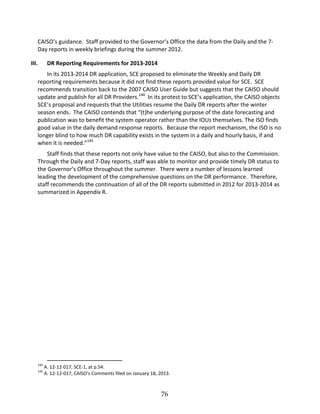
There are five major assumptions required to compute the expected PTR load reduction from
residential customers. 1) The meter deployment rate, 2) the rebate price, 3) the participation
rates, 4) the average load, and 5) the elasticity which determine the percent impact per customer
when combined with the prices.
Average load is based upon SDG&E’’s load research and daily load profile data.
Average daily energy use per hour in the peak and off peak periods
Elasticity of substitution between peak and off peak energy use
Average price during the peak and off peak pricing periods
Change in elasticity of substitution due to weather sensitivity
Average cooling degrees per hour during the peak period.
Change in elasticity of substitution due to the presence of central air conditioning
2012 Adjusted RA
The DR load impact for 2012 Adjusted RA is a monthly estimate of the expected load reduction
attributed to individual DR programs that accounts for current customer enrollment. This value is utilized
in load resource planning.
SCE’’s Methodology
Adjusted RA is calculated by taking the 2012 RA value and dividing by the 2012 RA enrollment to get
the average RA load impact per customer. The average RA load impact per customer is multiplied by the
number of ex post customers that were dispatched. The adjusted RA value accounts for the difference
between the number of customers forecasted for RA and the number of customers actually enrolled
during the ex post events; i.e. the adjusted RA represents what RA would have been if SCE had had
perfect knowledge of enrollment for 2012
SDG&E’’s Methodology
The adjusted 2012 RA load forecast is obtained by multiplying the 2012 RA impact per customer by
the number of current enrolled customers. SDG&E did not adjust its 2012 RA load forecast for weather or
other variables.
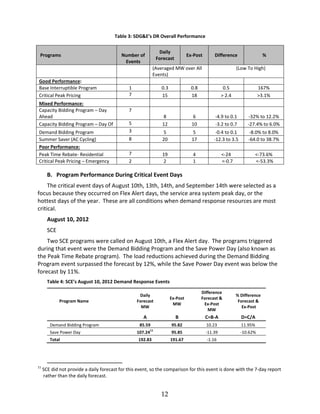
DR Daily Forecast and CAISO’’s 7 Day Report
The daily forecast is intended to provide an estimate of the expected hourly load reduction per DR
program during an event period.
The CAISO’’s 7 day Reports provide load reduction data that is calculated and reported to the CAISO
seven days after a DR event.
SCE’’s Methodology
AC Cycling
SCE’’s daily forecast for the Summer Discount Plan is calculated using an algorithm derived from a 1985
AC cycling load reduction analysis report. The algorithm is a linear equation:
MW Reduction = [a + b x (T x k)] x t](https://image.slidesharecdn.com/c001a13b-ff6c-41bb-82d4-23e00bb4a306-150719004611-lva1-app6891/85/StaffReport_2012DRLessonsLearned-85-320.jpg)