1. EEL4423L: WIRELESS CIRCUITS/SYSTEMS LAB
Lab 13-14 Essay : Frequency Down Conversion Process Date:04/22/2016
Name: Rahul Ekhande
Today, with the exponential increase in technology, the need of faster data transfer has also increase.
Data Signals are modulated using high frequency carriers and transmitted through space. These high
frequency RF carriers are in the range from 800 MHz to 2.5 GHz for cellular communication. It is then
received by an RF front end Receiver(Antenna) and sent for down conversion and is further sent to a signal
processing block to recover the message (binary) signal. In this essay we will focus our attention on the
RF front end Receiver block.
Up-conversion:
One of the most important need these days is to make the data transfer over longer distances. To achieve
this, we use the technique of communication in which the low frequency baseband signal is sent over high
frequency carrier signal as it can travel much further than the baseband signal.
Need of Up-conversion:
The first component in the down-conversion process is the Antenna where it receives the radiated
energy from the free space. In order to operate efficiently, antennae need to be in order of the
magnitude of wavelength of the transmitted signal.
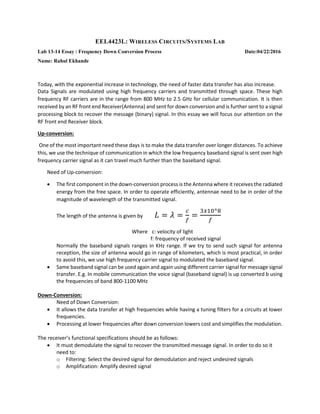
The length of the antenna is given by 𝐿 = 𝜆 =
𝑐
𝑓
=
3𝑥10^8
𝑓
Where c: velocity of light
f: frequency of received signal
Normally the baseband signals ranges in KHz range. If we try to send such signal for antenna
reception, the size of antenna would go in range of kilometers, which is most practical, in order
to avoid this, we use high frequency carrier signal to modulated the baseband signal.
Same baseband signal can be used again and again using different carrier signal for message signal
transfer. E.g. In mobile communication the voice signal (baseband signal) is up converted b using
the frequencies of band 800-1100 MHz
Down-Conversion:
Need of Down Conversion:
It allows the data transfer at high frequencies while having a tuning filters for a circuits at lower
frequencies.
Processing at lower frequencies after down conversion lowers cost and simplifies the modulation.
The receiver’s functional specifications should be as follows:
It must demodulate the signal to recover the transmitted message signal. In order to do so it
need to:
o Filtering: Select the desired signal for demodulation and reject undesired signals
o Amplification: Amplify desired signal
2. Down-conversion in RF Front end:
The up converted signal is radiated by the antenna in the space, which is then received by the RF
front end block. The block diagram of the RF front end block is shown below in figure.1 . It has the
following block in it
Receiving antenna
Pre-Amplifier
RF- filter
Mixer with VCO
IF Amplifier
IF filter
Figure. 1: RF Front End Block Diagram
Receiving Antenna:
It is the first component of a down conversion system is an antenna. The antenna is designed to receive
only certain frequencies. The frequency response of the antenna shows that the return loss goes very low
at its resonant frequency.
Below is the frequency response of antenna centers at 1.5 GHz (Lab 12). It shows the S11(return loss) Is
minimum at this frequency, making it to radiate or receive the energy efficiently at the given frequency.
Figure.2 : S11 plot for Antenna center at 1.5 GHz (Lab 12)
3. It is very important to design the antenna in such a way that it receives signals at the frequencies of
interest.
Pre-Amplifier:
The next component is a Pre-Amplifier. The signal coming through space received by the antenna suffer
significant attenuation because of multipath fading, propagation loss and shadowing. The power of the
signal received is in order of -90 dBm (10-9
Watts). For the signal to be processed further, it has to be
amplified. The Pre-Amplifier which is a Low Noise Amplifier provides the necessary amplification of the
signal.
Generally, a matching network is implemented between the antenna and amplifier connection in order
to have maximum power transfer from antenna to amplifier.
The noise figure plays an important role in defining the performance of the system about how much the
signal is degraded during the conversion process. Ideally SNR at the input and out should be same in order
to have high quality of signal, but because of addition of noise at each stage during down conversion the
SNR at output is low as that of input. This ratio is known as Noise figure (F) and the overall noise figure of
the system is given by the equation below at 290K:
𝐹 𝑡𝑜𝑡𝑎𝑙 = 𝑆𝑁𝑅 𝑖𝑛
𝑆𝑁𝑅 𝑜𝑢𝑡⁄ = 𝐹1 +
𝐹2 − 1
𝐺1
+
𝐹3 − 1
𝐺1. 𝐺2
+ ⋯
where F1,F2,F3: is the noise of each component in the system
G1, G2: gain of each component
As we can the F1, noise figure of the 1st
component mainly affect the overall noise figure of the system,
we use LNA as the 1st
component in the down conversion process.
RF bandpass Filter (Image Rejection Filter):
The ideal amplifier amplifies the signal, but practically along with amplification it also introduces
harmonics in the system. Below figure.3 shows the amplifier output response of given single frequency
input
Figure.3 : Amplifier I/O response
4. The harmonics generated by the amplifier can affect the further down conversion process of the system.
In order to avoid that we insert RF- filter. This filter allows only the desired RF band of signal to pass and
filter out the undesired harmonics. The BW of preselect filter is less than 2* FIF in order to attenuate image
frequency.
Let us assume that the system is set to down-convert an RF input signal of 915 MHz to a 70 MHz signal.
and local oscillator frequency is 985 MHz . Therefore, we have another signal of frequency 1055 MHz
which will down-convert to 70 MHz (1055-985) as well. This signal is called the image frequency. Similarly,
if the local oscillator frequency were to be 845 MHz the image frequency would be 845-70 = 775 MHz.
The image reject filter is used to remove the image frequency signal. So this filter is also known as Image
Rejection Filter.
Figure.4 : Amplifier I/O response
Above RF filter response from lab 13 we used an image reject band pass filter having a center frequency
of 915 MHz, a bandwidth of 20 MHz in the pass band. The upper frequency = 915 +10 = 925 MHz and the
lower frequency = 915-10 = 905 MHz were the frequencies at which the filter rolled-off in its frequency
response. The quality factor of the filter was 915/20 = 45.75. The image reject filter is positioned before
the mixer in the down-conversion system so that it blocks the image frequency signal from reaching the
mixer thereby preventing the mixer from down-converting it to the IF frequency.Below plot from Lab 14
shows the amplifier output and IF filter output, showing the harmonics filtering process by the RF filter.
(a) (b)
Figure.5 : a: Output of Amplifier b) O/P of RF filter
5. Mixer:
The next component in the system is a mixer. Mixers are built using diodes and are non-linear devices.
The mixer has 2 inputs, shown in below figure.6
Figure.6 : Mixer Output response
One for the incoming RF signal and another for the Voltage controlled oscillator (VCO) signal. The VCO is
a device that is used to produce the necessary reference signal against which the RF signal is subtracted
to get the IF signal by the mixer. The VCO can be tuned to produce the necessary value of reference signal
for the mixer. The mixer produces signal of various frequencies at its output. These signals are called
mixing products. They include the difference signal (Frf-Fvco), sum signal (Frf+Fvco) and the harmonics of
Frf and Fvco. Let us consider the case when Frf =915 MHz and Fvco = 985 MHz. The mixing products that
were observed majorly observed were 70 MHz (Fvco-Frf), 1900 MHz (Frf+Fvco), 915 MHz (Frf), 985
MHz (Fvco), 1830 MHz (2Frf), 1970 MHz (2Fvco). Below is the plot for mixer output from lab 14 ADS
simulation, showing the harmoices as discussed above.
Figure.7 : Output of mixer from Lab 14
The conversion loss of the mixer is = (RF input signal power level) – (output IF signal power level).
6. IF Amplifier:
The next component in the system is a second amplifier. The IF signal coming out of the mixer has a low
power level (-23 to -16 dBm). This amplifier is responsible for boosting the power level of the IF signal.
Below figure. 8. Shows the Plot from Lab 14 how the signal boosting of the mixer output. Along with If
signal boosting the amplifier also boost the harmonics generated by the mixer. These harmonics are
filtered out by the IF filter in preceding stage
Figure.8 : Amplifier I/O response
IF bandpass filter (Adjacent Channel Rejection Filter):
The last component used is an adjacent channel filter or an IF Band pass filter. This filter is used to select
the IF signal from all the mixing products of the mixer. In lab 13 we used an IF filter having a center
frequency of 70 MHz and bandwidth of 7 MHz. It rolled off at 66.9 MHz (lower frequency) and 73.8 MHz
(upper frequency). The quality factor of this filter was 70/7 = 10.
Figure.9 :IF Filter I/O response
The down-conversion system that was built in lab 13 had attenuators at various points between
components. They were introduced to prevent any of the components from getting damaged due high
powered signals. For example, we had a 30 dB attenuator before the first amplifier so that the IF signal at
the output of the system had a low enough power level before being measured on the SA thereby
7. preventing the SA from being damaged due to a high powered IF signal. As this filter filters out the
adjacent unwanted signal it is also known as Adjacent Channel Rejection Filter.
Below figure shows the Lab 14 overall RF front end ADS simulation schematic and the signals at each block
output.
Figure.10 : RF front end: ADS schematic for frequency down conversion
Figure.10 : RF front end: Block diagram of Frequency down conversion with output signals at each block