SlideShare a Scribd company logo
1 of 1
Download to read offline
www.postersession.com
VIRTUALIZATION CAPACITY
OF HYPERVISORS
Ø Pursuing Master’s in Computer Science : Data Science
at North Carolina State University
Ø Bachelor’s in Computer Science Engineering from LNM
Institute of Information Technology, India
Ø 3+ years experience in Software Engineering from
previous jobs and coursework
Ø Enjoy sketching and dancing in leisure time
Ø Groundbreaking data visualization software created by
Tableau Software
Ø Easy connection with huge variety of data sources
Ø Provides instantaneous insight by transforming data into
visually appealing and interactive dashboards
Ø GEC-SCS virtual infrastructure is represented in V-
Trends
Ø Aim is to provide an interactive dashboard for
breakdown of capacity of hypervisors across different
systems of GEC-SCS
Ø Comparison between available vs total capacity across
different sites and metrics.
Data Visualization using Tableau
PRIYSHA PRADHAN
Team: Engineering Data Center Services
Manager: Brad Flanary
Buddy: John Klassa
https://www.linkedin.com/in/priysha-pradhan-a0218396
Email-Id: priysha.pradhan@netapp.com, ppradha3@ncsu.edu
Phone : 9197935904
WHAT IS TABLEAU?
VIRTUALIZATION CAPACITY
OF HYPERVISORS
RESOURCE COST ANALYSIS
FOR AWS
Ø Amazon Web Services (AWS) provides various resources such
as Instances, volumes and snapshots
Ø Aim is to automate the process of collection of billing information
from Amazon for assistance in cost-reduction
Ø Pull the collected data in Tableau to create a dashboard for cost
breakdown of AWS resource utilization
MY BACKGROUND
CONTACT
Below dashboard provides a global and further drill-down view of VM
capacity across different virtual resources, broken down by site,
metrics and timeframe.
Below dashboard provides the complete breakdown of available and
provisioned hypervisors for each day across all sites after scaling on
the basis of average VM size selected.
Below dashboard provides a drill-down resource utilization and
cost information from Amazon according to organization hierarchy
by site and month.

More Related Content

Similar to Poster (20)

QiuchengWang_CSCV
QiuchengWang_CSCVQiuchengWang_CSCV
QiuchengWang_CSCV
 
Pradip_resume
Pradip_resumePradip_resume
Pradip_resume
 
Ram-Resume
Ram-ResumeRam-Resume
Ram-Resume
 
Adithya vinayak ayyadurai
Adithya vinayak ayyaduraiAdithya vinayak ayyadurai
Adithya vinayak ayyadurai
 
Anusha_CV_TSQL_3YR
Anusha_CV_TSQL_3YRAnusha_CV_TSQL_3YR
Anusha_CV_TSQL_3YR
 
THIYAGU PM 2014
THIYAGU PM 2014THIYAGU PM 2014
THIYAGU PM 2014
 
RESUME-New
RESUME-NewRESUME-New
RESUME-New
 
THIYAGU PM 2014
THIYAGU PM 2014THIYAGU PM 2014
THIYAGU PM 2014
 
THIYAGU PM 2014
THIYAGU PM 2014THIYAGU PM 2014
THIYAGU PM 2014
 
cv
cvcv
cv
 
Dharma_Resume
Dharma_ResumeDharma_Resume
Dharma_Resume
 
Resume_Nandhakumar
Resume_NandhakumarResume_Nandhakumar
Resume_Nandhakumar
 
RESUME_SaranyaNagaraj_A
RESUME_SaranyaNagaraj_ARESUME_SaranyaNagaraj_A
RESUME_SaranyaNagaraj_A
 
Human/Social Sciences/Cultural & Behavioral Dynamics and Advanced Analytics
Human/Social Sciences/Cultural & Behavioral Dynamics and Advanced AnalyticsHuman/Social Sciences/Cultural & Behavioral Dynamics and Advanced Analytics
Human/Social Sciences/Cultural & Behavioral Dynamics and Advanced Analytics
 
Mohammed Shafiur Rahman-Resume
Mohammed Shafiur Rahman-ResumeMohammed Shafiur Rahman-Resume
Mohammed Shafiur Rahman-Resume
 
nandini.resume
nandini.resumenandini.resume
nandini.resume
 
Pongobinath sivashanmugam resume
Pongobinath sivashanmugam resumePongobinath sivashanmugam resume
Pongobinath sivashanmugam resume
 
CURRICULUM VITAE Shashi
CURRICULUM VITAE ShashiCURRICULUM VITAE Shashi
CURRICULUM VITAE Shashi
 
3 job adda doc 1
3 job adda doc 13 job adda doc 1
3 job adda doc 1
 
NAGARAJU RESUME 2016
NAGARAJU RESUME 2016NAGARAJU RESUME 2016
NAGARAJU RESUME 2016
 

Poster

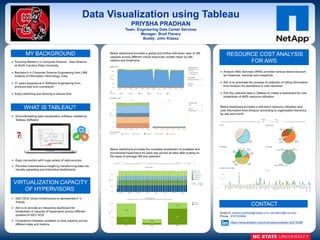
  • 1. www.postersession.com VIRTUALIZATION CAPACITY OF HYPERVISORS Ø Pursuing Master’s in Computer Science : Data Science at North Carolina State University Ø Bachelor’s in Computer Science Engineering from LNM Institute of Information Technology, India Ø 3+ years experience in Software Engineering from previous jobs and coursework Ø Enjoy sketching and dancing in leisure time Ø Groundbreaking data visualization software created by Tableau Software Ø Easy connection with huge variety of data sources Ø Provides instantaneous insight by transforming data into visually appealing and interactive dashboards Ø GEC-SCS virtual infrastructure is represented in V- Trends Ø Aim is to provide an interactive dashboard for breakdown of capacity of hypervisors across different systems of GEC-SCS Ø Comparison between available vs total capacity across different sites and metrics. Data Visualization using Tableau PRIYSHA PRADHAN Team: Engineering Data Center Services Manager: Brad Flanary Buddy: John Klassa https://www.linkedin.com/in/priysha-pradhan-a0218396 Email-Id: priysha.pradhan@netapp.com, ppradha3@ncsu.edu Phone : 9197935904 WHAT IS TABLEAU? VIRTUALIZATION CAPACITY OF HYPERVISORS RESOURCE COST ANALYSIS FOR AWS Ø Amazon Web Services (AWS) provides various resources such as Instances, volumes and snapshots Ø Aim is to automate the process of collection of billing information from Amazon for assistance in cost-reduction Ø Pull the collected data in Tableau to create a dashboard for cost breakdown of AWS resource utilization MY BACKGROUND CONTACT Below dashboard provides a global and further drill-down view of VM capacity across different virtual resources, broken down by site, metrics and timeframe. Below dashboard provides the complete breakdown of available and provisioned hypervisors for each day across all sites after scaling on the basis of average VM size selected. Below dashboard provides a drill-down resource utilization and cost information from Amazon according to organization hierarchy by site and month.