1. 1
EE323 Digital Control Systems
Mini-Project Marking Rubric
A: Presentation
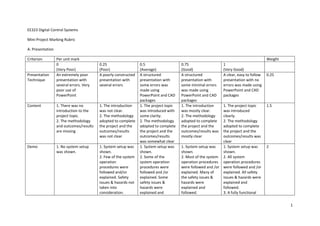
Criterion Per unit mark Weight
0
(Very Poor)
0.25
(Poor)
0.5
(Average)
0.75
(Good)
1
(Very Good)
Presentation
Technique
An extremely poor
presentation with
several errors. Very
poor use of
PowerPoint
A poorly constructed
presentation with
several errors
A structured
presentation with
some errors was
made using
PowerPoint and CAD
packages
A structured
presentation with
some minimal errors
was made using
PowerPoint and CAD
packages
A clear, easy to follow
presentation with no
errors was made using
PowerPoint and CAD
packages
0.25
Content 1. There was no
introduction to the
project topic.
2. The methodology
and outcomes/results
are missing
1. The introduction
was not clear.
2. The methodology
adopted to complete
the project and the
outcomes/results
was not clear
1. The project topic
was introduced with
some clarity.
2. The methodology
adopted to complete
the project and the
outcomes/results
was somewhat clear
1. The introduction
was mostly clear.
2. The methodology
adopted to complete
the project and the
outcomes/results was
mostly clear
1. The project topic
was introduced
clearly.
2. The methodology
adopted to complete
the project and the
outcomes/results was
clear
1.5
Demo 1. No system setup
was shown.
1. System setup was
shown.
2. Few of the system
operation
procedures were
followed and/or
explained. Safety
issues & hazards not
taken into
consideration.
1. System setup was
shown.
2. Some of the
system operation
procedures were
followed and /or
explained. Some
safety issues &
hazards were
explained and
1. System setup was
shown.
2. Most of the system
operation procedures
were followed and /or
explained. Many of
the safety issues &
hazards were
explained and
followed.
1. System setup was
shown.
2. All system
operation procedures
were followed and /or
explained. All safety
issues & hazards were
explained and
followed.
3. A fully functional
2
2. 2
3. Most of the
system is not
functioning
according to the
requirements
followed.
3. A partially
functioning system.
Some parts are
working according to
the requirements.
3. A near functional
system. Several parts
are working according
to the requirements.
system. All parts are
working according to
the requirements.
Question &
Answers
1. The group was
unable to clarify the
content and result.
2. None of the
questions were
answered
1. Clarification of the
contents and results
was given by the
group but it was not
clear.
2. Only few
questions were
answered
appropriately.
1. Clarification of the
contents and results
was given by the
group with some
clarity.
2. Some questions
were answered
appropriately.
1. Clarification of the
contents and results
was mostly clear.
2. Most of the
questions were
answered
appropriately.
1. The group was able
to clarify the content
and result in a clear
manner.
2. All questions were
answered well.
1.5
Total Mark
3. 3
B: Report
Criterion Per unit mark Weight
0
(Very Poor)
0.25
(Poor)
0.5
(Average)
0.75
(Good)
1
(Very Good)
Structure &
Presentation
1. An extremely poor
structured report with
several errors &
omissions (e.g. in
references,
appendices,
acknowledgements,
figures & tables
labels).
2. Very poor clarity &
use of English –
several grammatical
errors make it very
difficult to read &
understand
1. A poorly
structured report
with errors &
omissions (e.g. in
references,
appendices,
acknowledgements,
figures & tables
labels).
2. Poor clarity & use
of English – many
grammatical errors
make it difficult to
read & understand
1. A structured report
with some errors &
omissions (e.g. in
references,
appendices,
acknowledgements,
figures & tables
labels).
2. Clarity & use of
English is average –
some grammatical
errors that create
confusion for the
reader
1. A well-structured
report with minimal
errors & omissions
(e.g. in references,
appendices,
acknowledgements,
figures & tables
labels).
2. Clarity & use of
English is good – only
minor grammatical
errors creating
minimal confusion
1. A well-structured
report with no errors
& omissions (e.g. in
references,
appendices,
acknowledgements,
figures & tables
labels).
2. Clarity & use of
English is exemplary –
easy to read and
understand
0.25
Introduction 1. The report objective
is missing.
2. There is no
awareness in the
wider context of the
project
3. Background
knowledge (literature
review) is missing
1. The report
objective is not clear.
2. Awareness in the
wider context of the
project is not clear
3. Background
knowledge
(literature review) is
minimal
1. The report
objective is expressed
with some clarity.
2. There is some
awareness in the
wider context of the
project.
3. Some background
knowledge (literature
review) is presented.
1. The report
objective is mostly
clear.
2. Awareness in the
wider context is
mostly clear.
3. Background
knowledge (literature
review) is clear and
almost sufficient
1. The report objective
is expressed clearly.
2. Awareness in the
wider context is
expressed clearly and
is exemplary
3. Background
knowledge (literature
review) is clearly
expressed, sufficient
and exemplary
1
4. 4
Methodology 1. No evidence that
the fundamental steps
of a formalized design
process have been
applied
2. No design details of
the solution (control
theory design method
e.g root locus, bode
plots, etc) for the
project.
3. No details of how to
implement (or
replicate) hardware
control system are
given.
1. Limited (very few)
evidence that the
fundamental steps of
a formalized design
process have been
applied.
2. Limited (very few)
design details of the
solution (control
theory design
method e.g root
locus, bode plots,
etc) for the project.
3. Limited (very few)
details of how to
implement (or
replicate) hardware
control system are
given.
1. There is some
evidence that the
fundamental steps of
a formalized design
process have been
applied.
2. Some design
details of the solution
(control theory
design method e.g
root locus, bode
plots, etc) for the
project are provided.
3. Some details of
how to implement
(or replicate)
hardware control
system are given.
1. There is mostly
complete and
sufficient evidence
that the fundamental
steps of a formalized
design process have
been applied.
2. Almost sufficient
and complete design
details of the solution
(control theory design
method e.g root
locus, bode plots, etc)
for the project are
provided.
3. Almost sufficient
and complete details
of how to implement
(or replicate)
hardware control
system are given.
1. There is well-
documented
(sufficient &
complete) evidence
that the fundamental
steps of a formalized
design process have
been applied.
2. Sufficient and
complete design
details of the solution
(control theory design
method e.g root locus,
bode plots, etc) for
the project are
provided.
3. Sufficient and
complete details of
how to implement (or
replicate) hardware
control system are
given.
2.25
Results 1. Details of system
testing in simulation &
hardware (tables/
graphs/ figures/
photos/ videos) are
not provided.
2. System not working.
1. Limited (very few)
details of system
testing in simulation
& hardware (tables/
graphs/ figures/
photos/ videos) are
given. Both have
1. Some details of
system testing in
simulation &
hardware (tables/
graphs/ figures/
photos/ videos) are
given. Both have
1. Mostly sufficient &
complete details of
system testing in
simulation &
hardware (tables/
graphs/ figures/
photos/ videos) are
1. Well-documented
(sufficient &
complete) details of
system testing in
simulation & hardware
(tables/ graphs/
figures/ photos/
1.25
5. 5
major omissions or
one is incomplete
while the other is
not provided.
2. Several and major
parts of system not
functional.
some missing details
or one is complete
while the other is not
provided.
2. Some parts of the
system are
functional.
given. Some minor
omissions.
2. Most parts of the
system are working.
videos) are given.
2. All parts of the
system are working.
Discussion 1. There is no
indication of the
extent to which the
project objectives
have been met.
2. The design
implementation has
not been critically
evaluated.
1. The extent to
which the project
objectives have been
met is very unclear.
2. A limited (hardly
any) critical
evaluation of the
design
implementation has
been done.
1. The extent to
which the project
objectives have been
met is somewhat
clear.
2. Some critical
evaluation of the
design
implementation is
provided.
1. The extent to which
the project objectives
have been met is
mostly clear.
2. A detailed critical
evaluation of the
design
implementation that
is mostly clear is
provided.
1. A clear statement
on the extent to which
the project objectives
have been met is
given.
2. A detailed and clear
critical evaluation of
the design
implementation is
provided.
1
Finale 1. Conclusions &
future
work/suggestions are
missing.
2. Abstract is missing
1. Conclusions,
future
work/suggestions
are very unclear and
insufficient. There
are major omissions
2. Abstract is very
unclear and
insufficient. There
are major omissions.
1. Conclusions, future
work/suggestions are
somewhat clear but
not sufficient. There
are some omissions.
2. Abstract is
somewhat clear but
not sufficient. There
are some omissions.
1. Conclusions, future
work/suggestions are
mostly clear &
sufficient. Some
minor omissions.
2. Abstract is mostly
clear & sufficient.
Some minor
omissions.
1. Conclusions, future
work/suggestions are
clear and well-
documented
(sufficient &
complete)
2. Abstract is clear and
well- documented
(sufficient &
complete)
1
Total Mark
6. 6
C: Management
Criterion Per unit mark Weight
0
(Very Poor)
0.25
(Poor)
0.5
(Average)
0.75
(Good)
1
(Very Good)
Initial Plan 1. The scope of work
tasks and schedule
(Gantt Chart) is
missing.
2. The plan does not
include methodology,
final report & final
presentation.
3. The responsibilities
table is missing
1. A list of tasks to be
accomplished is
provided in the
scope of work tasks
and schedule (Gantt
Chart) but there are
several tasks/items
missing.
2. Several parts of
methodology, final
report & final
presentation are
missing.
3. A very unclear
table (matrix) of
group member
responsibilities
(leading and/or
assisting tasks) is
provided.
1. A list of tasks to be
accomplished is
provided in the scope
of work tasks and
schedule (Gantt
Chart) but there are
some omissions.
2. The plan includes
some of the
methodology, final
report & final
presentation.
3. A table (matrix) of
group member
responsibilities
(leading and/or
assisting tasks) is
provided but the
responsibilities are
not clear.
1. A mostly complete
list of tasks to be
accomplished is
provided in the scope
of work tasks and
schedule (Gantt
Chart).
2. The plan includes
most of the
methodology, final
report & final
presentation.
3. A mostly complete
& clear table (matrix)
of group member
responsibilities
(leading and/or
assisting tasks) is
provided.
1. A clear, complete &
easy to follow list of
tasks to be
accomplished is
provided in the scope
of work tasks and
schedule (Gantt
Chart).
2. The plan includes all
parts of the
methodology, final
report & final
presentation.
3. A complete & clear
table (matrix) of group
member
responsibilities
(leading and/or
assisting tasks) is
provided.
0.5
Work Done
each week vs
weekly plan
Carry forward (i.e. insert) the average marks across the duration of the project for the weekly assessments and divide by
three (3)
1st
week (8-9) 2nd
Week (9-10) 3rd
Week (10-11) 4th
week (11-12) 5th
week (12-13) 6th
week (13-14)
Total marks / (3 x number of weeks) =
1
Total Mark
7. 7
D: Teamwork Effectiveness
Criterion Per unit mark Weight
0
(Very Poor)
0.25
(Poor)
0.5
(Average)
0.75
(Good)
1
(Very Good)
Teamwork 1. The project
appears to have
been carried out by
only minimal (1-2)
members
2. The work load and
variety on each
member is very
unfairly distributed
with only one or
two members
doing all the
technical tasks.
3. No evidence of
leadership role
being assumed by
each member for
different tasks.
4. Scheduled meetings
minutes are not
recorded and
efforts are
unknown
1. The project was
carried out by most
(3-4) members
2. The work load and
variety on each
member does not
seem to be fairly
distributed and
more than one
member has been
assigned trivial non-
technical tasks (e.g.
writing the report)
3. Hardly any evidence
of leadership role
being assumed by
each member for
different tasks.
4. Scheduled meetings
minutes are rarely
recorded and the
efforts are
scattered.
1. The project was
carried out by most
(3-4) members
2. The work load and
variety on each
member does not
seem to be fair and
one member has
been assigned trivial
non-technical tasks
(e.g. writing the
report)
3. Leadership role being
assumed by each
member for different
tasks is somewhat
apparent
4. Scheduled meetings
minutes are often
recorded and the
contribution of each
team members are
NOT identified
1. The project was
carried out by all
(5) members
2. The work load
and variety on
each member
seem fair
3. Leadership role
being assumed
by each member
for different
tasks is apparent
but not clear
4. Scheduled
meetings minutes
are usually
recorded and the
contribution of
each team
members are
identified
1. The project was
carried out by all (5)
members
2. The work load and
variety on each
member is fairly
distributed
3. Leadership role being
assumed by each
member for different
tasks is clearly
evident
4. Scheduled meetings
minutes are always
recorded and the
contribution of each
team members are
identified
1.5
Total Mark