Guarding Fast Data Delivery in Cloud: an Effective Approach to Isolating Perf...
Megalodon-Challenge-Solution
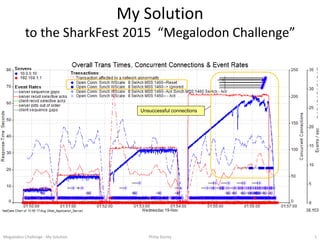
1. My Solution
to the SharkFest 2015 “Megalodon Challenge”
Unsuccessful connections
Megalodon Challenge - My Solution Philip Storey 1
2. Megalodon Challenge
This is an analysis of the network and application activity involved in the “Megalodon
Challenge”, distributed at SharkFest 2015 by Jasper Bongertz.
https://blog.packet-foo.com/2015/07/the-megalodon-challenge/
The observations, commentary and recommendations are presented first.
The supporting evidence is provided in subsequent slides - for readers who would like
to follow along with the detailed analysis.
First the answer to the question posed in the Challenge.
“At a certain point in time during the test there would be unanswered page requests, but it was unclear if it
was a network problem, an application framework problem, something in the application logic itself or maybe
even something else entirely.”
After that, an extended analysis to examine the server, application and network
bottlenecks in the two flows.
There are numerous behaviours that defy explanation. For now, all we can do is report the observations and
suggest potential alternative reasons for the behaviours.
This analysis was performed by Philip Storey, a freelance network & application performance analyst and troubleshooter living in Sydney,
Australia. Contact Phil at: Phil@NetworkDetective.com.au
Megalodon Challenge - My Solution Philip Storey 2
3. Megalodon Challenge
This is a very interesting case study, containing many elements and application behaviours that
are difficult to explain.
The tool used to perform the analysis is “NetData-Pro”. Its graphical visualisation capabilities –
combining many different attributes superimposed on one chart - make interesting behaviours
“eye-catching”. This allows problems to be identified much more quickly.
All the data can be visualised at once, even with multi-GB capture files. Each of the capture files
here are about 2 GB each.
The author has been a user of NetData-Pro for around 6 years.
The capture files had been modified by “TraceWrangler” – an excellent free utility that can perform many
“sanitisation” functions. Here it had substituted IP addresses, MAC addresses and replaced the payload content
with the repeated string, “Payload Removed!”.
Find it at - https://www.tracewrangler.com
Even with no real application payload data, we can still observe several application behaviours
that are quite intriguing.
“NetData-Pro” is a commercial product, from Measure IT Pty Ltd in Sydney (Australia).
The Principal is Bob Brownell: Bob@NetData-Pro.com
Megalodon Challenge - My Solution Philip Storey 3
4. Diagram (As Provided)
Load Generator
172.28.190.238
Load Generator fires
transaction input into
the Web Server.
Web Server connects
to the Content Server
to retrieve much of the
content.
A
Expect only traffic with:-
- Source = 192.168.1.1
- Destination = 192.168.1.1
- Broadcast
To be captured here.
Expect only traffic with:-
- Source = 10.0.0.1
- Destination = 10.0.0.1
- Broadcast
To be captured here.
Load Balancer sends
“Keepalive” monitoring
requests on port 443 as well
as Pings.
B
Added the Load Generator and flows based on the observations. As we’ll see later, it is very unlikely that
Tap-B is actually where it is drawn here.
Megalodon Challenge - My Solution Philip Storey 4
5. Observations
1) TraceWrangler had been used to sanitise the packets and substitute the payloads.
(This means that we couldn’t use the powerful layer-7 analysis functions of NetData. We nevertheless are
able to discover details about server performance by using the generic “request/response” decoder to
identify individual transaction timings and categorise them by request/response sizes).
2) It appeared that there were 4 load test runs, each time “doubling” the load.
3) There are many packet losses consistently throughout the capture period (in regular time
periods).
4) There are regular instances of Syn and/or Syn-Ack packets going missing.
5) All the losses (in both directions) occurred between the capture tap(s) and the Content Server.
6) There are two different types of packet loss behaviour, one consistently throughout the four
test runs and another that appears only under heavier loads.
7) There are more frequent instances of Syn/Syn-Ack losses during the fourth test run.
8) The answer to the Challenge is that failed connections occurred during the fourth, biggest
volume, test run.
• The Content Server terminated 11 connection requests by issuing a Reset after a minute.
• The server also “ignored” 47 connection requests, i.e., there was no response to the repeated Syns.
9) The Content Server appears to begin to suffer “stress” during the third test run and then more
so during the fourth (heavier) test run.
This stress appears to be related to a limit on the server application availability to take
requests off the incoming TCP stack.
Megalodon Challenge - My Solution Philip Storey 5
6. Performance Observations
10) There are constant, regular periods of 5 seconds where 2.5 secs have packet losses, then 2.5
of no losses. This repeats for the whole 10 minute capture.
• All connection setups during the “lossy” 2.5 sec periods take longer than those in the “non-lossy” 2.5
sec periods - even those that are not affected by lost packets.
• So the same device may be responsible for both behaviours.
• The lost data packets are of all payload or message sizes.
11) There is a different type of packet loss period during the fourth test run. Here, there are
instances of Syn/Syn-Ack losses that aren’t within the other “lossy” 2.5 sec periods.
• These are the instances that cause the failed connections and transactions.
• Their frequency of occurrence ramps up “exponentially” at the end of the fourth test run.
• There is not an equivalent increase in data packet losses.
12) The first transaction in every connection is a 127-byte request with 3031-byte response
(which has the flavour of an SSL handshake).
• These take progressively longer during test runs (with a minimum of 0.5 secs in the fourth test run).
• Probably because the Content Server application can’t take the requests off the inbound TCP queue
quickly enough - due to some form of load/stress.
• Improving these transactions will have the biggest effect on the overall performance.
13) The second transaction in every connection is a 158-byte request with 51-byte response
(which has the flavour of an SSL cypher exchange).
• These are usually very fast, but many always take ~300 ms and ~500 ms of server “thinking” time.
• These times are not load related – as they occur during all four tests.
• These should be examined because a third or half a second is significant.
• Only 128 out of 36472 return the 51 bytes in one packet. 36344 deliver 2 packets of 6+45, often with
large times between those 2 packets.
Megalodon Challenge - My Solution Philip Storey 6
7. Performance Observations (Cont.)
14) There are regular “gap” periods of 0.3 seconds, every 4.5 seconds or so (unrelated to the
2.5/5 sec “lossy” periods) where BOTH the Web Server and Content Server applications seem
to stop communicating or responding.
• The only packets in either direction during these 0.3 sec “gaps” are TCP (Acks or retransmissions) -
not application data or new connection requests.
• If it was within just one server, we might call it “garbage collection” or similar. I have no explanation
for these periods to be synchronised between two different servers.
15) The failed connection requests do not appear to be related to client ephemeral port
“recycling” – even though, due the relatively high rate of new connections, they are reused
every 170 seconds or so. The Web Server restarts at 49155 – which is interesting because the
MS Windows “standard” has been 49152 since 2008, implying that it has been slightly
modified in this environment.
16) The responses from the Content Server are not delivered with maximum efficiency (i.e., as a
stream of full sized packets). Rather, the flows consist of some “blocks” of good flows, but
interspersed with many and various smaller packets. This occurs even in the lighter test runs.
This could be due to the application being unable to keep up in delivering data to the outgoing TCP stack.
Or perhaps there is another device in the path that is causing this? Packets of size 29 bytes are very
common. Because of this, NetData’s generic “request/response” decoder has categorised transactions
based on the packets flowing each way. The large 52 KB responses look like this for example:
Request: blk[154]; blk[1284] – (Response) blk[4xx]; blk[2x] (5); blk[1xxxx]; blk[1xxxx]; blk[2x] (5); blk[1xxxx]; blk[1xxx];
blk[2x]; blk[3x]; blk[2x]
Which means that the request was in 2 packets of [154]+[1284] and, in this case, the response totalling 52590 bytes came
back in packets of [445]; 5 x [29]; a large block of [17128] {11 x [1460] + [1068]}; another [15708]; 5 x [29]; [17520]; [1404];
[29]; [37]; [29].
Thus, the thousands of common 52 KB and 983 byte responses have been categorised separately, even though they are
likely to be the same. The colour groupings in the charts were created by colour coding the transactions only by their
request signatures.
Megalodon Challenge - My Solution Philip Storey 7
8. Performance Observations (Cont.)
17) The TCP connections from the Load Generator to the Web Server ramp up to the respective
maximums very quickly (forming an almost vertical line for the “concurrent connections”
chart).
However, the connections from the Web Server to the Content Server step up more slowly,
about 1 extra connection per second.
The effect of this is most apparent in test run 4, where the 200 connections from the Load
Generator are initiated all at once (with the respective 200 transaction requests). The 200
requests are queued up and it takes the Web Server 12-18 seconds to work its way through
them all. This is because the Web Server begins with only 100 or so connections to the
Content Server – hence can only handle 100 back-end transactions in parallel. It takes ~100
seconds before the connections have ramped up to match.
Could this be due the Web Server making a decision to increase its available application
threads only once every second? Would the performance be improved if the Web Server
initiated more connections sooner?
18) The vast majority of Load Generator transactions (into the Web Server) are a 325+ byte
request with a response of 286,650 bytes.
These keep coming as fast as they can. There are no randomised gaps that might simulate
real users.
The queuing effect of these transactions is much more significant in the fourth test run.
19) The packet losses in these flows all occur between the tap(s) and the Load Generator. The
regular 5 second “loss” + “no loss” periods are not apparent in these flows. The losses are far
fewer in number and seem more random.
Megalodon Challenge - My Solution Philip Storey 8
9. Final Observation: Tap Locations
20) The location of the tap for the capture file named “Content Server” does not appear to be in
the location described in the Megalodon Challenge information.
Based on the client-server flows, MAC address (even though they were “Wrangled”), TTL
values and flows, the Tap-B “Content Server” location appears to have been on the same TCP
segment as the “Web Server” (which I’ve called Tap-A). Tap-B captured all the same client-
server flows as Tap-A.
The two capture files are very similar – and could almost be mistaken as being identical – but
they did contain minor differences.
– Some packets common to both captures had ever-so-slightly timing differences.
– There are some packets that are in one capture but not the other (mostly at the beginning and end –
so likely due to Wireshark start-stop timing differences).
– Where these packets are missing in either capture file, they appear to have been dropped by
Wireshark rather than actually lost in the network.
To save this PPT file becoming overly large, the evidence for this is included in a separate
report, “Megalodon-Challenge-Comparing-The-Two-Captures”.
The diagram on the next slide is my guess as to where Tap-B might have been located.
This is also assuming that the diagram as originally provided was accurate. It is possible that the Load
Balancer is not in that exact location.
Megalodon Challenge - My Solution Philip Storey 9
10. The 47 “Ignored” connections and 11 “Reset” connections would result in failed transactions
from the Web Server. These are the cause of the observed problem as stated in the
“Challenge”:
“At a certain point in time, the web application server would not get a reply for some of its
requests anymore.”
Those connections terminate abnormally because the client Syn packets, server Syn-Ack packets
and client Acks get lost somewhere between the capture points and the Content Server.
The evidence for this conclusion is presented in the “Evidence Trail” in the following slides.
B
Challenge: The Answer
A
Packet losses are here.
Or here.
Firewall ??
Megalodon Challenge - My Solution Philip Storey 10
11. Recommendations
1) The source of the packet losses be investigated and fixed.
Both kinds of losses need to be identified. The reported problem though, is due to the Syn/Syn-Ack losses
which are load related.
Candidates for the cause of the losses could be:
• Load Balancer (if in the path from Web to Content Server).
• A firewall (if there is one in the Web to Content Server path).
• Switches (e.g., duplex mismatches).
• Faulty TCP settings in the Content Server (e.g., duplex mismatch).
• Faulty NIC card(s) in the Content Server.
• Faulty Ethernet Cables.
• Internal Content Server resource limits (since load plays a part).
2) The exact network topology be determined.
All devices in the Web Server to Content Server path need to be identified so that they can be examined so see
if they play a part in the observed behaviours. Simultaneous packet captures in more locations then need to be
performed in order to narrow down the “suspects” and eliminate each component as the cause of the problem
behaviours.
In a standard multi-tier architecture, load balancers and firewalls are likely to be in this path.
Megalodon Challenge - My Solution Philip Storey 11
12. Recommendations (Cont.)
3) That a capture be taken at the Content Server.
The capture that was supposedly taken by Tap-B at the Content Server does not appear to be correctly located.
It seems to have been taken on the same VLAN/segment as the Web Server capture.
A capture here would prove whether or not the observed packet losses are due to the Content Server.
4) Increase the range of ephemeral ports used by the Web Server to connect to the
Content Server.
The ports begin at 49155 and are being “recycled” in just over 3 minutes due to the large number of short
running connections. If the starting number was reduced to nearer to 20000, the duration between “recycles”
would stretch out to 6 minute
5) Investigate the Content Server’s application behaviour of breaking up the responses
into very small packets.
For example, why would the vast majority of the Content Server’s second transaction type return a 51 byte
response as two packets of [6] + [45] rather than a single packet of [51]? Finding and fixing this behaviour
could have a significant impact of the overall performance of the system.
The starting point for this investigation would be to look at the application’s TCP output buffering settings.
Megalodon Challenge - My Solution Philip Storey 12
13. Evidence Trail
The following slides provide the evidence of the observed behaviours.
1) First we look at all the client-server connection pairs within the packet capture files.
We can get a high level view of flow volumes, retransmission rates and other
statistics for both directions of each flow.
2) Then we look at all the actual connection setups and other transactions, all at once
on a single chart. Here the “problem” behaviours stand out. We also get a
visualisation of the whole 7 minutes where the four different test runs are clearly
visible and separated. Visual correlations can be observed between the Load
Generator traffic and the Web-to-Content Server traffic.
3) We then “zoom-in” to investigate the troublesome connections. We can use
“Packet Timing” views to see the packet behaviours in a time-of-day setting.
4) By choosing the right chart overlays, we can then observe the packet loss
behaviours and how they correlate (or don’t) with other behaviours.
This is where some surprising behaviours are observed!
Megalodon Challenge - My Solution Philip Storey 13
14. Overview - Dialogues (Web Server Capture)
This is a high level view
of the clients (on the
left) and servers (on
the right).
Line thickness relates
to traffic volumes.
Line colour indicates
Packet Retransmission
rates in each direction.
We clearly see the two
pairs of three servers
with the traffic that we
are interested in.
Megalodon Challenge - My Solution 14Philip Storey
This is the Web Server
acting as a server,
receiving connections.
This is the Web Server
acting as a client,
initiating connections.
15. Overview - Dialogues (Web Server Capture)
Megalodon Challenge - My Solution 15Philip Storey
Lots of Syn & data
retransmissions from
the Web Server to
Content Server.
Hovering on the lines
produces these popups,
providing more details of
the traffic flows.
From this we get the
idea that lost packets are
likely to play a part in our
“troublesome”
behaviours.
Lots of “gaps” in the
flow from the server
(meaning packets were
lost on the way back).
16. Overview - Dialogues (Content Server Capture)
Megalodon Challenge - My Solution 16Philip Storey
The capture file name
appears here in all
charts.
This is the same chart
but from the capture file
named “Content Server”).
Given that it contains
traffic from the Load
Generator to the Web
Server (top flow) and
also given that the
underlying details are
very close to the previous
slide, the conclusion is
that this capture was not
taken at the Content
Server, i.e. Tap-B was
located elsewhere and
on the same
VLAN/segment as Tap-A.
17. All Connection Setups
This chart shows the connection details for the full 7 minutes. The solid red & blue lines display the “concurrent connections”
into each server. The “rectangular” red shapes indicate that the Load Generator quickly ramped up connections to the Web
Server (first ~25, then ~50, ~100 & ~200 - RHS scale). These appear to be 4 test runs, each time doubling the number of
concurrent connections. The blue Content Server connections ramp up at a slower rate. The red and blue markers represent
connection setups (with height being setup time - LHS scale). The horizontal black lines in each setup also show duration.
Megalodon Challenge - My Solution 17Philip Storey
The most “interesting” activity seems to be here, during the heaviest test.Some connections are not successful.
18. Setups Zoomed to Test Run Four
This is now zoomed-in to only the 4th test. Also, only Web Server to Content Server traffic is shown (Load Gen traffic removed).
The connections were ignored or rejected towards the end when the concurrent connection count worked its way towards the
200 mark. The dashed lines plot the packet loss rates (which have a clearly visible regularity about them).
NetData makes problem behaviour “eye catching”. Those Resets and “ignored” connections certainly stand out here.
Megalodon Challenge - My Solution 18Philip Storey
14,320 connection
setups on this chart.
Horizontal bands of “error”
types at 3, 6, 9 & 12 secs.
A band of “ignored” TCP
setups.
Setups that were “Reset”
by the server.
19. Connection Statistics (Test 4)
This table shows the statistics of the items that were plotted on the previous slide. That is, just test run four.
The 14,320 setups were mostly normal – but 11 were “Reset” and 47 “Ignored”.
The 258 with no Window Scaling are those where the first 2 client Syn packets were lost but the 3rd one
made it through (and the server’s Syn-Ack also made it through).
As we will see, if the first 2 Syn packets don’t make it, the client’s third attempt does not specify a Window
Scale factor. The Microsoft TCP Stack developer should get brownie points for that. If the first 2 Syns failed,
perhaps the developer thought a modified “dumbed down” 3rd Syn might work?
Megalodon Challenge - My Solution 19Philip Storey
20. Reset “Rejected” Connections
Megalodon Challenge - My Solution 20Philip Storey
The “rejected” connections look like this. [Client packets along the bottom row, server packets along the top row.]
The client sends a Syn that gets no response, so retransmits another after 3 seconds, no response, so a third Syn after a
further 6 seconds. 60 seconds after that, the server responds with a Reset.
If the server “rejected” the request due to some known limitation, we would expect to see the Reset much sooner.
The inference here is that the server actually sent a Syn-Ack in response to one or more of the client Syn packets (because the
server is aware of the connection). These Syn-Acks were all lost on the way back (so no corresponding client Ack). This forced
the server to hold the connection open until it timed-out. Packet losses in both directions are responsible for this error.
One or more of the client’s Syns must have got
through – but all the server’s Syn-Acks must have
been lost on the way back from the server.
A further observation is that Syn 3, unlike 1 & 2, does not specify a Window Scale factor. 4 packets on this whole chart..
21. Packet Timing (Normal Transactions)
These chart types provide a visual representation of the packet times. Shapes & colours highlight different packet types (see
legend). Blue diamonds are Acks. Vertical position of black squares indicates size of data packets .
The 3-way handshake is usually quick. The first transaction is always a 127 byte request with a 3031 byte response. Then
more request/response transactions, followed by a client “Final”, server Ack, server data and client “Reset”.
Megalodon Challenge - My Solution 21Philip Storey
Connection ID.The next slide zooms-in to these final four milliseconds.
22. Packet Flow (Normal Transactions)
This is the final part of the connection in the previous slide. The tail-end of the second transaction is in the
blue area. Note the small packets (29 bytes is common). The client sends a 29 byte data packet – but with a
Final packet (which the server Acks). The server responds with a 29 byte packet – and the client
immediately replies with a Reset. All the connections look similar to this.
Megalodon Challenge - My Solution 22Philip Storey
Client sends a “Final”. Server Acks it… … then sends 29 bytes after
about 1.8ms.
Which triggers a Client
“Reset”.
23. Packet Table (Normal Transactions)
Some readers may be more comfortable with this table of the packets from the last two slides.
Megalodon Challenge - My Solution 23Philip Storey
24. The “Lost Syn” Connections
We’ve already seen what the “rejected” connections look like
(Multiple lost Syn or Syn-Ack packets then a server Reset after
60-70 seconds).
In the following few slides we’ll examine the packet timings and
behaviours for the 3, 6, 9 and 12 second connection setups as
well as the “ignored” connections.
Megalodon Challenge - My Solution Philip Storey 24
25. Packet Flow (3 Second)
This is an example of one of the 3 second connection setups. The initial client Syn is ignored but the 2rd Syn
(after 3 seconds) is answered. After that the first [127-3031] transaction takes under 1 second then 3 more
transactions in 0.7 sec before the usual termination, Fin-Ack-Data-Reset.
Megalodon Challenge - My Solution 25Philip Storey
Did the client’s Syn get lost on the way to the server?
Or was a server Syn-Ack lost on the way back to the client?
The “real” work was done in
well under a second.
26. Packet Flow (6 Second)
This is an example of the 6 second connection setups. The initial client Syn is ignored but the 2rd Syn (after
3 seconds) is answered. Note the matching Window Scale factors.
After that the normal transactions take a total 1 second before the usual termination, Fin-Ack-Data-Reset.
Megalodon Challenge - My Solution 26Philip Storey
A server Syn-Ack was lost on
the way back to the client?
Did the client’s Syn get lost on the way to the server?
Or was a server Syn-Ack lost on the way back to the client?
Prompting a 2nd Syn-Ack
three secs later.
27. Packet Flow (9 Second)
This is an example of one of the 9 second connection setups. Both the initial client Syn and the
retransmitted Syn are ignored but the 3rd Syn (after a further 6 seconds) is answered.
The fact that the server’s Syn-Ack has no Window Scaling may be a hint that the first two client Syn packets
were indeed lost on the way (rather than the server’s Syn-Acks being lost on the way back).
Megalodon Challenge - My Solution 27Philip Storey
Did the client’s two Syns get lost on the way to the server?
Or were the server’s Syn-Acks lost on the way back to the client?
28. Packet Flow (12 Second)
This is an example of the 12 second connection setups. It is like a 9 second one, but with the extra 3
second delay from the server. Note the matching “No Window Scaling”.
Megalodon Challenge - My Solution 28Philip Storey
Was a server Syn-Ack (expected here) lost
on the way back to the client?
These two client Syns were likely lost on the way to the server?
29. Packet Flow (“Ignored” Connection)
This is an example of the “21 second” connection setups. All of the client’s 3 Syn packets are ignored (or lost). There is no
response from the server at all. This would have resulted in failed transactions from the client’s viewpoint.
Alternatively, the server’s Syn-Acks could have been lost on the way back (but we have no evidence that the server knew
about this connection).
Another possibility is that the capture terminated before we saw the server’s 60-second Reset.
Megalodon Challenge - My Solution 29Philip Storey
30. Lost Syn Behaviour
This is a similar chart as the above – but showing about 60 connections all at once. Socket labels 1-59 are the client rows for
the corresponding server rows 60-119. These are the “ignored” and “rejected” connections – so only Syn, Syn-Ack and Reset
packets appear.
The first batch of yellow circled Syns and Retransmitted Syns end up with (yellow circled) server Resets after around 70
seconds.
Subsequent “batches” of unanswered Syns/Retrans (light blue circled) occur with exponentially increasing frequency – but
have no responses. Could it be that the capture was stopped before we got to see the server’s Resets? Making “ignored” the
same as “rejected”?
Megalodon Challenge - My Solution 30Philip Storey
These are the same connections.
No server packets in these connections.
Client Packets
Server Packets
31. Packet Loss Behaviour
Now that we know that packet losses are the reason for the failed transactions, we now need to
examine the form the losses took in order to narrow down the possible causes.
There are two different loss types - regular data packet losses and Syn losses under heavier loads.
Both types occur between the taps and the Content Server (not between the two taps).
The following slides present various different views of the behaviour.
Data Packet Losses.
• The packet losses are not random. They occur for 2.5 seconds in every 5 second time period.
• They are not related to load (they occur regularly across all 4 test runs).
• They are not related to transaction payload size.
Syn Packet Losses.
• Occur mostly towards the end of the test period – increasing as load increases.
• Some Syn losses do occur during the 2.5 second “lossy” periods
• Can occur in contiguous groups (as already seen in the previous slide).
• They are not related to traffic load (i.e., they can occur when there is no other simultaneous
network activity).
• They are related to server stress (successful connections at the same time have slower
responses).
• If not server stress, then some stress in an intermediate device such as a firewall or load
balancer.
Megalodon Challenge - My Solution 31Philip Storey
32. Two Kinds of Packet Loss Behaviour
The packet losses are not random. They occur for 2.5 seconds (or half) of every 5 second period.
As the legend says, the pink background represents times where lost data packets were observed. These form fairly
consistent bands across the whole 7 minute time period. The blue dashed line shows that Syn/Syn-Ack losses ramped up
during the fourth test run. So general losses are not load related, but Syn losses do increase up to 20+ per sec when under
load (apparently due to a different loss mechanism).
Many of the 178,465 transactions are affected by the losses (pink squares) and times are generally longer in test run four.
Megalodon Challenge - My Solution 32Philip Storey
33. Packet Losses Correlate with Slow Setups
The blue markers here represent TCP 3-way handshakes (other transaction types are not shown). The pink background is
where there are packet losses in general (in transactions not plotted here). Connection setups are all milliseconds quicker in
periods without packet loss.
Whatever causes the regular losses might also slow down TCP setups – OR – whatever slows down setups might also cause
packet losses?
Megalodon Challenge - My Solution 33Philip Storey
All the setups within the “non-lossy”
periods (white background) are faster…
… than setups during the “lossy” (pink
background) periods.
Also observe the Syn/Syn-Ack losses
in white areas (i.e., not correlated with
the other losses).
34. Packet Loss Behaviour (Response Size Doesn’t Matter)
The transactions with light blue markers have response messages longer than 52 KBytes, and all other
transactions have messages shorter than 5 KB. Transactions with pink squares are those containing packet
losses and retransmissions.
There doesn’t appear to be any correlation of packet loss with response message length.
Megalodon Challenge - My Solution 34Philip Storey
These large and small sized transactions contain no losses. Large and small both contain losses.
35. Syn Losses Occur in “Batches”
Yellow bars are successful connection setups, green are setups with lost Syn/Syn-Acks. Horizontal length
of bars represents duration (x-axis is time-of-day). Entire chart is only a third of a second wide.
Concurrent setups had been handled successfully – but with slightly increasing delays – and then a large
batch of Syn/Syn-Ack packets were lost (no successful setups in that time). Then good connections again.
The connection arrival rate (slope of left edges) was not unusually high.
Megalodon Challenge - My Solution 35Philip Storey
36. Port Numbers are “Recycled”
There are so many TCP connection requests that the same client ephemeral port
numbers get reused two or three times each during the 4 test runs.
The Web Server (acting as client) starts its port numbers at 49155 and it takes just
over 3 minutes to cycle through the ports 49155-65534.
This doesn’t appear to be the cause of the failed connection attempts.
It can be a problem when new connections are attempted on a port that was used
recently and is still in the server’s Time-Wait state.
If workloads are expected to become as high as the load test, then to eliminate this as
a potential future problem, we could suggest to the customer that they configure the
Web Server to begin its port number sequence with a lower starting value than 49155.
This would extend the time period between reuse of the same client port numbers.
Megalodon Challenge - My Solution Philip Storey 36
37. Connections Table
This is a small portion of the Connections table, sorted by client port number. It shows the 10 “Server Refused” connection
requests that began very close together. Observe that other requests around the same time were successful.
A secondary observation is that all the port numbers appear twice, showing that they were “recycled” after 171 seconds (2:51
min). The earlier connections that used these port numbers were successful.
Megalodon Challenge - My Solution 37Philip Storey
38. Connections – Client Port Numbers
Megalodon Challenge - My Solution 38Philip Storey
This is the Connections Table, sorted by client port number. We can see that the Web Server begins at 49155
when it “recycles” its ephemeral port numbers.
Also that new connections are being made very rapidly (just a few milliseconds apart).
As we observed in the previous slide, it takes just over 3 minutes to cycle through the ports 49155-65534.
Here’s where the port
numbers “recycle”.
39. Client Port Recycling
Here is an example of a client port number (56901) that was used 3 times during the 4 test runs.
This chart is 6 minutes wide, making each individual connection “compressed” into a very narrow column.
I’ve popped-up just one packet in each one in order to see the exact times.
We can see that the recycle time is just over 180 secs.
Megalodon Challenge - My Solution 39Philip Storey
40. Additional Application Performance Observations
Megalodon Challenge - My Solution 40Philip Storey
So far we’ve covered the cause of the transaction failures – which was needed to
answer the question(s) posed in the original “Megalodon Challenge”.
Some other interesting application behaviours became apparent in that analysis.
Next, we’ll examine other interesting performance characteristics of the applications and
network components.
I’ve never come across some of these behaviours before – and for some I can’t even
hypothesise the mechanism(s) that might cause them.
I hope you also find these interesting.
If you have ideas as to the potential causes – or if you have experienced similar
behaviours in your packet analysis career, please let me know!
Phil@NetworkDetective.com.au.
41. Commentary
A typical connection request to the Content Server involves:
• TCP 3-way handshake.
• First data exchange: 127 byte request – 3031 byte response (possibly an SSL key exchange).
• Second data exchange: 158 – 51 (possibly SSL cypher or user authentication?).
• Third data exchange: 14xx – 52K/983/~1K (likely the main HTTP GET/POST or similar request).
• Termination by: Client 29-bytes data - Final – server Ack – server 29-bytes data – client Reset.
(which has the flavour of an SSL “Alert” session termination).
There usually seems to be just one “real” request in each connection (HTTP GET/POST?). This
allows us to use the “total connection duration” as a proxy for server application response
time.
Further, comparing the time components of the “SSL handshake” versus the “HTTP
request/response”. The “SSL key exchange” takes significantly longer during the heavier load
tests.
The Content Server appears to struggle during the heaviest load test.
This could be due to:
• Server limit on application threads available to process these functions (most likely).
• Server limit on TCP connections (not apparent in capture).
• A difficulty with client port recycle times (not apparent in capture).
• Load balancer limitations
The packet losses could be caused by the load balancer, other network equipment or the Content
Server itself.
Megalodon Challenge - My Solution Philip Storey 41
42. Performance Recommendations
1) The Content Server configuration be investigated and rectified for any limitations on:
– Concurrent threads for HTTP/HTTPS processing.
– TCP connections (e.g. a maximum concurrent connection limit).
– Port “recycling” ability.
Although port “recycling” doesn’t appear to be an issue, our observed 170 seconds is less than the TCP “TIME_WAIT”
maximum of 240 seconds. The Web Server could be reconfigured to use a larger range of ephemeral ports for its outgoing
connections. That is, begin the cycles with a client port number lower than 49155.
This would protect against the possibility of running into a future server “TIME_WAIT” connection problem if real life loads
ever increase above the levels of the fourth test run.
2) The application behaviour be investigated, with a view to improving performance.
– The first & second transaction in every connection are the same.
– They appear to be SLL related.
– If so, then the 3031-byte certificate is delivered in full for every connection.
– Investigate the possibility of utilising any of the SSL “session reuse” options so that subsequent
connections don’t always incur this setup overhead.
3) Investigate reducing the number of connections.
– After the same first & second transactions, there is usually just one other transaction in every
connection.
– If the Web Server application could be modified to perform more than one request per connection,
then the “per connection” overheads (transactions 1 & 2 - which can be significant) would be
significantly reduced.
Megalodon Challenge - My Solution Philip Storey 42
43. Performance Recommendations (Cont.)
4) Investigate the mechanism that causes the regular “gap” periods of 0.3 seconds, every 4.5
seconds or so. BOTH the Web Server and Content Server applications seem to stop
communicating or responding – but the TCP stacks still operate properly.
This represents approximately 6% of the total time.
• Why would this mechanism occur simultaneously in both servers?
5) Investigate the reason for the Content Server responses not being delivered with maximum
efficiency (i.e., as a stream of full sized packets).
This could be related to internal server resource limitations, meaning that the only “fix”
would be to move to a more powerful server.
6) Investigate the reason for the Web Server ramping up its outgoing connection count only at
one second intervals.
It is apparent at the beginning of all test runs – but more visible in test run 4 - that the Load
Generator’s connections are all initiated at once (with the corresponding number of
transaction requests). However, the Web Server begins with around half the number of
connections to the Content Server. This means that the initial Load Generator transactions in
each run are always slower than the subsequent transactions.
If more back-end connections were initiated up front, this queuing effect would be reduced.
Megalodon Challenge - My Solution Philip Storey 43
44. Performance Evidence Trail
We’ll first look at the Web Server to Content Server traffic flows, connections and
transactions.
These have been broken down and examined for each of the four test runs, showing
the differing behaviours under the different loads.
Later on, there is an investigation into some interesting application “sleeping”
behaviour that seems synchronised between these two servers.
Megalodon Challenge - My Solution Philip Storey 44
45. Content Server Connection Total Durations
This chart shows the connection duration details (to the Content Server) for the full 7 minutes. The blue
markers now represent total durations of TCP connections (not just the setup times). Longer durations are
higher up on the chart (LHS scale). The dashed line now represents “connections per second” (RHS scale).
Connections are longer after 1:54:30, suggesting that the server takes longer to respond to requests.
We need to zoom down to see the data for most connections more clearly.
Megalodon Challenge - My Solution 45Philip Storey
The most “interesting” activity seems to be here, during the heaviest test. No. of connections on the chart.
46. Content Server Connection Total Durations
The LHS scale is now just 6 seconds high. We can see that there are very short (near zero) connections
during tests 1. However, during test 2, there is some “white space” indicating longer times.
In tests 3 & 4, very few connections are under half a second (forming a “cloud base” on the chart) – and there
are many more above 3-4 seconds.
Note that the server seems incapable of processing more than ~100 connections per second (RHS scale).
Megalodon Challenge - My Solution 46Philip Storey
This is the point that the server begins to suffer “stress”. Processing rate remains fairly constant at ~100 / sec.
47. Every Connection Has Same First & Second Transaction
This snippet from the top of the Statistics table shows the transactions in order of frequency. It also shows the colours (LHS)
that will be used on the following slides. It is sorted by the “Count” column.
The pink transaction in the top row (127 byte request – 3031 byte response) is the first one in every successful connection. The
orange one (158 – 51) is always the second transaction. The transactions with 52 KB (pale blue) and 983 byte responses (red)
are very common (but are spread throughout this table due to their varying packet size characteristics).
Megalodon Challenge - My Solution 47Philip Storey
48. The First Transaction in Every Connection
This chart plots only TCP connection setups (blue) plus just that one transaction type (solid pink square).
The hollow pink squares surround transactions containing packet losses.
The 2 popups show an example of a connection that suffered two 3 second delays, one in the 3-way setup
“transaction” and one in the data delivery transaction.
Megalodon Challenge - My Solution 48Philip Storey
This is the point that the server begins to suffer
“stress”. Always with this first transaction type.
These are all 3 second
TCP setups.
On the next slide, we’ll see the packets
in this connection + transaction.
49. 3 Sec Setup + 0.5 Sec Trans + 3 Sec Retrans = 6.5 Secs
In this example, we see a lost Syn adding 3 seconds, then a data packet (black square) being retransmitted
(pink square) - adding a further 3 seconds to what was a half second response. This is because the client’s
Ack (blue diamond) was lost on the way back to the server. (The pink loop shows the data->retrans linkage).
Note the client’s Duplicate Selective Ack (green diamond) informing the server that the retransmission was
unnecessary.
Megalodon Challenge - My Solution 49Philip Storey
This Syn (or the Syn-Ack) didn’t get
through. The 2nd of each both made it.
This Ack didn’t get
to the server.
So the server resent
the data packet.
Triggering a
D-Sack.
Server sent a
data packet.
50. The Second & Other Transactions
Megalodon Challenge - My Solution 50Philip Storey
The orange [158 – 51] transactions are often 300m,
500ms or more – independently of load.
These are all 52 KB responses, taking
longer when affected by packet losses.
This chart plots all the transaction types. The orange ones are always the second transaction in every connection. They make
an interesting pattern of horizontal bands across all tests, showing that there is some mechanism causing regular occurrences
of 300ms, 500ms and 900ms responses. Most are very fast though. The pale blue transactions are the 52 KB transactions, red
are 983 bytes. Only the pink ones seem to be significantly affected by load.
As usual, the hollow pink squares surround transactions containing packet losses.
51. The Transaction Groupings in Every Connection
This is a snippet of the Transactions table, sorted by connections (ConnID).
We see the regular groupings of:
[TCP Setup], [127—3031], [158—51], [Varying Transaction], [29—29] (closure).
The timing durations are also broken up into request/server/response for each transaction.
Megalodon Challenge - My Solution 51Philip Storey
Transaction colour as shown in the charts. Just one connection in this table.
52. Just the First Transaction
This chart now plots just the 36,829 instances of the first common transaction type. The pink outlines here surround those
transactions containing packet losses and retransmissions.
The solid black line is “Transactions in Progress” – which shows how many of these transactions were being processed in
parallel at any one time. The dashed black line effectively counts “Transactions per Second”.
We see that around 100 is the maximum for both values. Improving this transaction would improve performance across all tests.
Megalodon Challenge - My Solution 52Philip Storey
But sometimes 3 or 4 seconds
is due to the server “thinking”.
Packet losses can account for
many of the longer durations.
The fact that they all take significantly longer
during the heavier tests is readily apparent.
53. Duration of the First Transactions
This frequency histogram of the [127]—[3031] transactions shows that most of them are under a second – with
an average of half a second.
On the next slides are the same transaction charts and histograms – broken down by the individual test runs.
There we see the increasing times as the test runs get progressively “heavier”. Even better, we also see how
the transaction times vary.
Megalodon Challenge - My Solution 53Philip Storey
54. Response Time Histogram (Test Run 1)
Megalodon Challenge - My Solution Philip Storey 54
In test run 1, we see that most first transactions
are very fast but the server takes a little longer to
handle some transactions.
90% of the 4204 are under 0.03 secs and the
average is just 0.0215 secs.
Packet losses add 0.3, 0.5 and up to 0.9
seconds to each transaction.
55. Response Time Histogram (Test Run 2)
Megalodon Challenge - My Solution Philip Storey 55
Even in test run 2, we now see that the server
takes longer to handle each of these
transactions when it is already processing more
than 10-15 of them. The see the “waves” as the
load moves up and down.
Even so, 90% of the 6816 are under 0.3 secs
and the average is 0.125 secs.
Packet losses add 1.5 to 3 seconds to each
transaction.
56. Response Time Histogram (Test Run 3)
Megalodon Challenge - My Solution Philip Storey 56
In test run 3, we now see the initial “waves” but
then the rise up off the bottom as the number of
parallel transactions rises above 50. We still
have “waves” but with a higher base.
Even so, 90% of the 11,489 are under 0.8 secs
and the average is 0.515 secs.
Packet losses still add 1.5 to 3 seconds to each
transaction.
57. Response Time Histogram (Test Run 4)
Megalodon Challenge - My Solution Philip Storey 57
In test run 4, we see the rise up off the bottom
straight away as the number of parallel
transactions rises quickly to 80. We still have the
“waves” with a higher base.
Even so, 90% of the 14,167 are under 1.0 sec
and the average is 0.8 secs. Interestingly, the
shape of the histogram chart is narrower than
test 3.
Packet losses still add seconds to each affected
transaction.
58. Response Time Histogram (2nd Transaction)
Megalodon Challenge - My Solution Philip Storey 58
Above we see that there are 2 “types” of the
second transaction. Both types can be slow,
many due to losses + retransmissions.
To the right, we see the majority are fast – but
about 1000 of them are slow, dragging the mean
out to 120ms.
Below we see that they aren’t noticeably
affected by load. The slower ones are consistent
- not due to a random mechanism.
59. Second Transaction Types
Megalodon Challenge - My Solution Philip Storey 59
The difference between the two “types” of the second transaction is whether the response is delivered in two packets or just
one (which we would expect for just 51 bytes). Out of 36472, only 128 have a single packet response.
Below is one example of each type. First, the [158] request gets the full [51] after 300ms, second, the request gets [6]
immediately, but the remaining [45] takes ~500ms, forcing a client delayed Ack at the 200ms mark.
60. Test Run 1: First & Second Transactions
Megalodon Challenge - My Solution Philip Storey 60
Now plotting only the first and second transaction types – and only during test run 1.
The mechanism that causes the “slow” responses to form horizontal bands at the ~300ms and ~500ms times clearly affects
both of these transaction types in the same way.
If these are the two components of an SSL setup, then perhaps the SSL mechanism should be examined more closely.
61. Application “Sleep” Behaviour
The client and server (Web Server and Content Server) applications experience
regularly occurring “gaps” – where they both seem to “sleep” (i.e., stop processing at
the respective application layer for around 300 ms).
The “gaps” happen around every 4.5 seconds but vary between 4 to 6 seconds.
During these “gaps”, the TCP stacks at each end are still working, but the applications
are not. Thus, the only packets observed during these gap periods are TCP type
packets (Syn, Syn-Ack, Ack).
Any transactions that are in progress when a “gap” begins are carried over until the
“gap” ends. Effectively adding 300 ms to all such transactions.
If it was just at one end, we might infer some sort of regular garbage collection routine
in a server. However, I have no explanation for a mechanism that synchronises such
behaviour across 2 separate servers. Something to do with virtual servers perhaps?
Megalodon Challenge - My Solution Philip Storey 61
62. Application “Sleeping” Behaviour
In the orange ovals, we see very regular time periods where application activity stops (for both the Web Server and Content
Server at the same time). No connections or transactions begin or end in these “gaps”, all existing transactions span across
the “gaps”. The “gaps” occur at regular intervals, not correlated with the pink-background packet loss periods.
On the next slide we’ll zoom-in to the 5th gap here – and see that the only packets within the “gaps” are at the TCP level
(Syns, retransmissions or Acks) – not at the application level.
Megalodon Challenge - My Solution 62Philip Storey
The “gaps” (inside the yellow ovals) occur at very regular
intervals – across the whole 10 minute period.
Why would BOTH the client and server applications go to
“sleep” at the same times?
63. Application “Sleeping” Behaviour
Zoomed-in to a total half second period, we see a ~300 ms period (light green box) where no transactions begin or end, all in-
progress transactions span across the “gap” (as indicated by the black horizontal lines).
The popped-up “transaction” inside the “gap” is actually a 3-sec TCP connection setup – where we had a retransmitted Syn
from 3 seconds ago (this is TCP acting, not an application).
Megalodon Challenge - My Solution 63Philip Storey
These transactions
completed before the “gap”.
Why would BOTH the client and server applications go to
“sleep” at the same times?
These transactions began
before or after the “gap”.
This unlucky transaction would be
very quick if it didn’t span the “gap”
64. Application “Sleeping” Behaviour
A Packet Timing view (client packets along the bottom, server along the top – 138 connections) of the same time period
shows no data packets in the ~300 ms “gap”. Only TCP level Syn-Ack and Ack packets (blue diamonds) occur inside the
“gap”. These are server “delayed Acks” for client data packets that were transmitted before the “gap”.
That one data packet in the green area is a 127-byte first request that the client TCP stack must have had ready-to-go in
response to the server’s Syn-Ack.
Megalodon Challenge - My Solution 64Philip Storey
Packets are flowing constantly in
both directions.
Packet flow continues as
normal.
One 127-byte data request here – associated with
that server Syn-Ack (see next slide).
65. That Single Data Packet
This Packet Timing view of the connection containing that one data request packet (circled). We see that the client began the
connection 3 seconds earlier – and the data is the first data packet in the connection.
It is the normal 127-byte request and we see a 200 ms delayed server Ack then the 3031-byte server response over a second
later.
Megalodon Challenge - My Solution 65Philip Storey
Packets are flowing constantly in
both directions.
Packet flow continues as
normal.
One 127-byte data request here – associated with
that server Syn-Ack (see next slide).
66. Load Generator to Web Server
Next we’ll look more deeply into the Load Generator to Web Server traffic. This is the
“front-end” where the Web Server to Content Server is the “back-end”.
There are some differences in behaviours of the Load Generator to the Web Server,
particularly in the connection setups.
There are more concurrent connections here – and they are initiated all at once.
However, there are far fewer total connection initiations across each test run because
once initiated, each connection here triggers multiple sequential transactions (10 –
20).
Each front-end transaction here must correspond to multiple back-end connections
and transactions.
Megalodon Challenge - My Solution Philip Storey 66
67. Commentary
A typical connection request from the Load Generator to the Web Server involves:
(Note that these use port 443, so less need to hypothesise about SSL).
• TCP 3-way handshake.
• First data exchange: [61] byte request – [4513] byte response (SSL certificate?). All very fast.
• Second data exchange: [267]+[59] – [59] (SSL cypher?).
• Several (sometimes 20) large transactions: [362] – [286650].
• Termination by: Client 399-bytes data - Final – server Ack – server tens/hundreds KB data – client Reset.
All the connections are initiated at, or near, the very start of each test run.
There are therefore far fewer connections and SSL setups – and they are fast because they occur
before the load ramps up.
The responses to the Load Balancer’s data requests do get progressively slower though, because
the back-end requests to the Content Server get slower.
All the observed packet losses are between the tap(s) and the Load Generator. There is no regular
pattern to these loses though (unlike the Content Server flows). The losses could be caused by a
firewall, load balancer or other network device on the way to the Load Generator.
The transactions at the start of test run 4 take longer than transactions later in the test run
because the Web Server begins with only 100 or so connections to the Content Server. The 200
transactions that initially arrive from the Load Generator are queued up. As more Content Server
connections are initiated over time, more back-end transactions can be handled in parallel
(making the front-end transactions faster due to spending less time in the queue).
Megalodon Challenge - My Solution Philip Storey 67
68. All Load Generator Transactions
Here are all 4 test runs, showing only the Load Generator traffic. There are just 5,722 transactions here – and
that includes connection setups. We see the connection lines rapidly rising to 25, 50, 100 & 200 respectively
for each of the 4 test runs. The packet loss behaviour is more random (not every 5 secs). The transaction/sec
figures (RHS scale) are greater at the beginning of each test run (presumably as all the connection setups
fire off at once). There are far fewer pink and orange transactions (SSL certificate & cypher).
The transactions are significantly slower in test run 4 where the load is greatest.
Note: The packet losses are all “upstream” (i.e., between the tap and the Load Generator).
Megalodon Challenge - My Solution 68Philip Storey
69. Load Generator - Statistics Table
This snippet from the top of the Statistics table shows the transactions in order of response size. It also shows the colours
(LHS) that will be used on the following slides. The pink transaction (61 byte request – 4513 byte response) is the first one in
every successful connection. The orange one (158 – 51) is always the second transaction. Other transactions are closures or
requests with 286 KB responses.
Megalodon Challenge - My Solution 69Philip Storey
70. A Load Generator Connection
This “Waterfall” (or Gantt style) chart displays all the transactions within one of the connections. Notice the
first & second very fast SSL setup transactions, then the repeated same large responses taking from 2.5 to
11 seconds. A new one begins immediately after the previous one completes.
The yellow indicates that this is all server “thinking” time (96.3% of the whole chart). Note the other timing
breakdowns too.
Megalodon Challenge - My Solution 70Philip Storey
SSL setup? Same request/response repeatedly, directly after each other. The ending request gets a large response.
71. Example of Packet Losses
This Packet Timing chart is from the middle of a transaction containing losses and retransmissions. Top row is the Web Server
here, bottom row is the Load Generator. The hollow red squares surround packets that were seen in this capture – but we know
were not received by the client (because we also see SAcks). This means that the packets were lost between the tap and the
Load Generator (through the Load Balancer?). The “loops” connect packets with their retransmissions.
Of interest is the small cluster of retransmitted packets, where the original [1448] byte single packet is re-sent in two packets of
[798]+[650]. I’ve seen this behaviour in F5 load balancers – but here were are supposedly at the Web Server interface.
Megalodon Challenge - My Solution 71Philip Storey
1x1448 -> [798]+[650]All packets are 1448 bytes (payload).
72. Example of Packet Losses (Zoomed)
This is two views of the same packet flows – a small portion of the flow from the previous slide. Some retransmissions come
very quickly in response to the Selective Acks.
Megalodon Challenge - My Solution 72Philip Storey
1x[1448] -> [798]+[650]
Retransmissions
73. Connection to Web Server from Load Generator
This is the one instance in the Load Generator traffic where an initial Syn was lost. We saw the Syn-Ack
from the Web Server (circled) – but the Load Generator did not get it. The Load Generator retried its Syns
many time very quickly (but the Web Server was now ignoring them because it already saw the first one).
The second Syn-Ack from the Web Server (after a 300ms retransmission timeout) made it through.
Megalodon Challenge - My Solution 73Philip Storey
This Syn-Ack went missing on the way. But this Syn-Ack made it.These retrans Syns were ignored.
74. Front-End & Back-End Together
Finally we’ll look at a few slides showing both front-end and back-end activities all
together.
• The first slide shows the whole time period.
• Second slide just test run four.
• Third slide just the start of test run four.
There are approximately 10 times more Web Server to Content Server transactions
than Load Generator to Web Server.
Each front-end (red) transaction here must correspond to multiple back-end
connections and transactions (blue).
If we had the original payloads, we would perhaps be able to match the reds up
exactly with their corresponding blues.
The slow ramp up of blue connections is worth some further examination by the
application owner.
Megalodon Challenge - My Solution Philip Storey 74
75. This Chart Tells the Whole Story!
The red transactions, connections & “TIP” lines represent the Load Generator (front-end) activity. The blue is
the Content Server (back-end). The four test runs are clearly visible and we see the correlation of red & blue.
Megalodon Challenge - My Solution 75Philip Storey
But only ~100 of both to the Content Server.
The red transactions must be queued up
(since only 100 can be worked on at once).
Therefore, the initial red
transactions take longer
then the subsequent ones.
Load Generator connections
ramp-up very quickly to ~200.
There are ~200 “Transactions in
Progress”.
76. Test Run Four - Whole Story!
Zoomed-in to test four. All the initial red requests arrive at once, but the responses take several seconds to
get worked through. New requests take their place as they complete. Newer ones are (mostly) processed
more quickly (because we have more parallel blue connections).
Megalodon Challenge - My Solution 76Philip Storey
All these transactions begin together. But end over many seconds. All these later transactions are faster.
77. Start of Test Run Four
Zoomed-in even more - to the start of test four. All the initial red requests arrive at once, but the responses
take several seconds to get worked through. New requests take their place as they complete. Each red
transaction involves many blue ones – so even though the blues are faster, their times add up to make the
reds.
Megalodon Challenge - My Solution 77Philip Storey
All these transactions begin together. But end over many seconds. As each finishes, another begins.