Teaching Sustainability and Social Justice: A Resource for High School Teache...
PCarr_Dissertation
1. 1
Behavioural change: An assessment of its relationship with
climate change knowledge, opinion and sources of information
among urban Tanzanian youth active in formal education in Dar es
Salaam
This dissertation is submitted in partial fulfillment of the requirements for Masters of
Science in Development Practice – Trinity College Dublin/ University College Dublin
Paul Carr
Student Number: TCD – 12322281 UCD - 14205899
Supervisors: Dr. Gayle McGlynn & Dr. Conor Buggy
August 2016
Word Count: 10,754
2. 2
DECLARATION
I, Paul Carr, do hereby declare that this is entirely my own work, except where
otherwise stated, and that it has not been submitted as an exercise for the award of
degree at this or any other University. I agree that the Library may lend or copy this
dissertation on request. This permission covers only single copies made for study
purposes, subject to normal conditions of acknowledgement.
Name: Paul Carr
Date: August 31st 2016
Signed ________________________
3. 3
Executive Summary
Climate change is arguably the greatest issue facing society today. Societal change is
needed in countries such as Tanzania which are highly vulnerable to the effects of climate
but have limited capacity to adapt. This societal change requires a change in behaviour
which can facilitate climate change mitigation and allow for adaptation measures to be
successful. This research aims to inform literature on climate change and behavioural
change by answering the following question: What is the relationship between behavioural
change and climate change knowledge, opinions and sources of information among urban
Tanzanian youth active in formal education in Dar es Salaam? Specifically, this research is
focused on youth active in the formal education system at both secondary and tertiary level.
This research was undertaken utilising a mixed methods approach. Quantitative data was
gathered via surveys on secondary school students and semi-structured focus groups with
University students, allowing for triangulation of results. A sequential design approach was
taken, where the qualitative data provided further insight into findings from the quantitative
data. Surveys were conducted on 296 secondary school students while focus groups were
completed with 46 participants.
Secondary school student survey results show that students have a reasonable knowledge
about climate change, but that significant gaps exist in the understanding of climate change
science. Despite knowledge gaps, students’ are enthused by the topic of climate change, are
eager to learn more about the various aspects of the topic, and see themselves as positive
agents in tackling climate change. Students’ gather awareness and knowledge of climate
change from a broad range of sources. Results indicate a strong positive relationship
between increased knowledge and more positive opinions on climate change. While the
source of climate change information appears to be an important factor in influencing
knowledge, engagement with sources of climate change information is dependent on many
factors, while a broad range of sources are utilised under different contexts.
The majority of the literature related to understanding knowledge, opinion and sources of
information on climate change are based in Western Society, while the links between these
aspects and behavioural change are seldom evaluated. This study can contribute to a better
understanding of the influence of these individual aspects as well as building a picture of
how to contribute towards positive behavioural change. This research could be utilised to
inform public policy on climate change communication, as well as curriculum development
within formal education.
4. 4
Acknowledgements
I would like to sincerely thank Dr. Conor Buggy and Dr. Gayle McGlynn for their
advice, input and guidance as well as their warmth and support over the last year
and more. I am extremely grateful to the staff of the Dar es Salaam University
College of Education, particularly Dr. Emiliana Mwita, Dr. Consolatata Chua and Dr.
Luka Mkonongwa, who gave their time and efforts so graciously in order to assist this
research. In addition, this research would not have been possible without the support
of the staff and teachers at the Chang’ombe Secondary Demonstration School. Dr.
Susan Murphy has provided invaluable support and advice on this project, and for
that I am extremely grateful. Yunwen Bao, my colleague, friend and statistical genius
made this dissertation possible and without her I would have been lost in a sea of
data.
To my classmates; to some incredible women – my Mother Evyln, my Sister Helen
and Aunt’s Breid and Bernie; to the rest of my family and friends, thank you for the
unmentionable amount of support, inspiration, guidance and learning you have
provided me over the past two years.
Lastly, I would like to thank the DUCE and secondary school students for their
participation, help and support. Mostly, I want to thank them for their determination,
enthusiasm and selflessness in facing the issue of climate change for which they did
not cause, but they will be forced to bear the burden of.
5. 5
Acronyms
AR5 The fifth assessment report by the Intergovernmental panel on climate
change
CFC Chloroflourocarbons
DUCE Dar es Salaam University College of Education
GHG Greenhouse Gas
IPCC Intergovernmental Panel on Climate Change
UN United Nations
UNFCCC United National Framework Convention on Climate Change
WMO World Meteorological Organisation
6. 6
Table of Contents
1. Introduction.................................................................................................................. 9
1.1. Climate change...................................................................................................................9
1.2. Climate change – knowledge, behaviour, policy.......................................................9
1.3. Research question and target demographic ..............................................................9
1.4. Purpose and rationale.....................................................................................................11
1.4.1. Climate change in Tanzania ......................................................................................11
1.4.2. Youth and climate change .........................................................................................11
1.4.3. Climate change and behavioural Change..............................................................12
2. Literature Review .................................................................................................................13
2.1. Key concepts.....................................................................................................................13
2.2. Surveys on climate change awareness and education .........................................13
2.3. Surveys of views, attitudes and emotions towards climate change..................14
2.4. Surveys on sources of climate change information...............................................14
2.5. Climate change and behavioural change ..................................................................15
2.6. Approaches to increasing positive behavioural change.......................................16
2.7. Sources of climate change information and behavioural change ......................16
2.8. Barriers to positive behavioural change....................................................................17
3. Methodology .............................................................................................................. 19
3.1. Methodological approach ..............................................................................................19
3.2. Secondary school student surveys ............................................................................19
3.3. DUCE student focus groups/ surveys ........................................................................21
3.4. Data gathering procedures & ethical considerations.............................................22
3.5. Limitations .........................................................................................................................22
4. Results........................................................................................................................ 23
4.1. Secondary school student surveys ............................................................................23
4.1.1. Demographics...........................................................................................................23
4.1.2. Climate change knowledge ...................................................................................24
4.1.3. Personal opinions and attitudes on climate change ......................................26
4.1.4. Sources of climate change information.............................................................28
4.1.5. Knowledge/ opinion score and tests ..................................................................29
4.1.6. Associations between knowledge and opinion ...............................................30
4.1.7. Associations between knowledge/ opinion score and additional factors 32
4.1.8. Correlations between knowledge/ opinion score and sources of climate
change information .................................................................................................................34
4.2. DUCE student focus groups .........................................................................................34
7. 7
4.2.1. Demographics...........................................................................................................34
4.2.2. Sources of climate change information.............................................................35
4.2.2.1. TV/ Radio ................................................................................................................35
4.2.2.2. Internet/ social media..........................................................................................36
4.2.2.3. Other sources .......................................................................................................37
4.2.3. Trust in information sources ....................................................................................37
4.2.4. Additional observations .............................................................................................38
5. Discussion.................................................................................................................. 39
5.1. Levels of climate change knowledge/ awareness (sub-question 1)...................39
5.2. Perceptions/ attitudes/ personal views on climate change (sub-question 2)..40
5.3. Sources of climate change information (sub-question 3).....................................40
5.4. Relationship between climate change knowledge, opinion and behavioural
change (research question) ......................................................................................................41
5.4.1. Knowledge/ opinion and behavioural change......................................................41
5.4.2. Sources of climate change information and behavioural change ..................42
5.4.3. Theories on knowledge acquisition........................................................................43
5.5. Barriers to behavioural change....................................................................................44
5.6. Limitations and suggestions for further research ..................................................45
6. Conclusion & Research Implications ....................................................................... 47
Bibliography...................................................................................................................... 49
Appendices ....................................................................................................................... 58
8. 8
List of Tables
4.1 Student age and form............................................................................................... 23
4.2 Student gender breakdown ...................................................................................... 23
4.3 Students’ who self-identify as having learnt about climate change at school ............ 24
4.4 Students’ attitudes and perceptions towards climate change ................................... 27
4.5 Summary of knowledge/ opinion scores................................................................... 30
4.6 Pearson correlations between categorised knowledge scores and opinion scores... 30
4.7 Association tests on knowledge/ opinion scores and gender/age and form.............. 31
4.8 Pearson correlations between knowledge/ opinion score and gender/age/grade ..... 32
4.9 Test on associations and correlations between knowledge/opinion score and "have
you learnt about climate change in secondary school?" ........................................... 33
4.10 Tests on associations and correlations between knowledge/ opinion score and “what
are the biggest problems in Tanzania....................................................................... 33
4.11 Pearson correlations between sources of information on climate change and
knowledge/ opinion score......................................................................................... 34
4.12 DUCE student age ................................................................................................... 35
4.13 DUCE student gender.............................................................................................. 35
4.14 DUCE student breakdown of where they grew up .................................................... 35
4.15 DUCE student year of study..................................................................................... 35
List of Figures
4.1 Students’ identification of GHGs.................................. ¡Error! Marcador no definido.
4.2 Breakdown of students’ answers to knowledge questions........................................ 26
4.3 Students’ perception of whether climate change affects them .....¡Error! Marcador no
definido.
4.4 Students’ perception of the biggest problems in Tanzania ..........¡Error! Marcador no
definido.
4.5 Breakdown of students reply to "How do you feel about climate change".......... ¡Error!
Marcador no definido.
4.6 Sources of Climate Change Information...................... ¡Error! Marcador no definido.
9. 9
1. Introduction
1.1. Climate change
Climate change is likely the greatest environmental challenge we face today (UNESCO,
2015a). The Intergovernmental Panel on Climate Change (IPCC) have reported on
successive occasions irrefutable evidence of increased atmospheric and ocean
temperatures. (IPCC, 2014a; IPCC, 2007; IPCC, 2013). This rise in global temperatures is
attributed largely to greenhouse gas emissions from fossil fuels consumption (IPCC, 2014a).
The fifth assessment report (AR5) by the IPCC reports that atmospheric temperatures since
1880 have risen by an average of 0.85 degrees Celsius (IPCC, 2014a) and that global
surface temperature by the end of the 21st
century is likely to exceed 1.5˚C in comparison to
the period between 1850-1900 for most scenarios and is likely to exceed 2˚C for many
scenarios. Climate change will have wide ranging effects on numerous aspects of
sustainable development including health, economic growth, biodiversity, agriculture and
natural resources, among others (UNESCO, 2015a; IPCC, 2014f).
1.2. Climate change – knowledge, behaviour, policy
Central to the drive to adapt to and mitigate climate change is the role of educators and
communicators (Houghton, 2009). There is an increasing recognition of the need to improve
climate change awareness and education (UNFCCC, 2014b; OECD, 2009; Eriksen et al,
2007). Climate change education is seen as a valuable tool to increase climate change
awareness and adaptive capacity in society while promoting behavioural change (UNFCCC,
2012; UNFCCC, 2014b; OECD, 2009; UNESCO, 2014a). Education and the general
dissemination of climate change knowledge have traditionally been of low priority globally
(OECD, 2009). However, in recent decades there have been numerous international
dialogues, frameworks and agreements which identify the importance of climate change
education and communication (Appendix 1). Particular importance has been emphasised on
improving climate change knowledge and awareness in developing countries, such as
Tanzania (Paris Agreement, 2015, art 11).
1.3. Research question and target demographic
10. 10
The central question this research intends to ascertain is: What is the relationship between
behavioural change and climate change knowledge, opinion and sources of information
among urban Tanzanian youth active in formal education in Dar es Salaam? The research
will seek to assess the nature of these relationships via statistical testing on quantitative
secondary school surveys and utilizing qualitative focus groups to help inform and
contextualise the results from those surveys. The central question will be informed by
addressing the following sub-questions.
Sub Question 1: What are the levels of awareness/ knowledge of climate change?
Sub Question 2: What are perceptions/ attitudes/ personal views on climate change?
Sub Question 3: What sources of information are engaged with to gain information
about climate change?
As referred to in the research question, this study is focused on urban Tanzanian youth who
are active in the formal education system both at secondary school and university level. Both
the secondary school and University are public institutions, which accounts for a large
percentage1
(Ministry of Education, Science, Technology and Vocational training, 2016) of
those enrolled in formal education in Tanzania. The net enrolment rate in Tanzania for
secondary education as of 2013 was 32% while the net enrolment in tertiary education was
3.7% (Demographic & Health Survey, 2013). The school which was chosen for this study is
Chang’ombe Demonstration Secondary School, while University students were enrolled in
the Dar es Salaam Univesity College of Education (DUCE). Both institutions are located
within the city of Dar es Salaam, Tanzania.
Chapter 2 of this study will assess the review previous climate change surveys before
assessing literature related to climate change knowledge and behavioural change, various
approaches to climate change awareness raising and education and trends in media and
climate change information dissemination. Chapter 3 will detail the methodology that was
utilised in order to gather quantitative and qualitative data. Chapter 4 will examine the results
gathered from completion of surveys and focus groups. Following this, chapter 5 will discuss
the results comparatively with research on this topic. Finally, chapter 6 will present the
potential implications of this study before presenting conclusions.
1
In 2015 there were 1,436,973 students enrolled in public secondary schools vs. 337,410 in private secondary
schools. In the 2014/15 academic year, there were 150,541 students enrolled in public Universities vs 73, 539
for private Universities.
11. 11
1.4. Purpose and rationale
1.4.1. Climate change in Tanzania
Developing countries such as Tanzania are particularly vulnerable to the impacts of climate
change due to a number of factors, such as their reliance on natural resources coupled with
a limited capacity to deal with the impacts of climate change (World Bank, 2014; OECD,
2009). The effects of climate change in East Africa on precipitation patterns have already
been evident, with extreme weather events such as droughts and floods being more frequent
in the last 30-60 years (IPCC, 2014b, p12). Warming over land in Africa has increased by
0.5-2˚C over the past 50-100 years (IPCC, 2014b, p7). In addition, increased incidences of
extreme weather events have incurred economic losses from the exposure of assets such as
crops and shelter (IPCC, 2014d, p4; OECD, 2009).
The impacts of climate change will have a broad range of impacts in Tanzania, both in the
near and distant future (IPCC, 2014a; CAN, 2015; WWF, 2006). In this century, it is likely
that temperatures in Africa will rise more quickly than in other areas of the globe (IPCC,
2014b, p3). If a high emissions scenario occurs, temperatures will rise by more than 2˚C by
2050 and rise by more than 4˚C by the end of the century (IPCC, 2014b, p8), while under a
low emissions projection temperatures are expected to rise by 2˚C by 2100 (IPCC, 2014b,
p8). Projected precipitation patterns vary with some areas in Tanzania experiencing an
increase in precipitation, while others face decreasing precipitation rates under a low-
emission scenario (IPCC, 2014b, p10-11). Parts of Tanzania will likely experience more
extreme wet days with heavier rainfall and increased risk of flooding by 2050, which will be in
part attributable to changes in cyclone patterns in the Indian Ocean (IPCC, 2014b, p12, CAN
2015). Climate change will also have significance in relation to water availability, health and
food security (IPCC, 2014a, p21; OECD, 2009; WWF, 2006).
1.4.2. Youth and climate change
Youth are a critical demographic in forging a more sustainable future and need to be
targeted as change agents to improve behaviour related to climate change (Narksompong &
Limiirakan, 2015). Education is a key capacity building tool for young people and
communities as a whole, as it allows individuals to make informed decisions (UNESCO,
2014b). It is recognised that youth are key educational drivers particularly in non-formal
12. 12
learning, and can become empowered for positive action on climate change, by taking
advantage of their role as drivers of change (Narksompong & Limiirakan, 2015). The youth
of today and future generations are those that will be most affected by climate change, and
thus must be appropriately equipped with knowledge, values and skills to mitigate and adapt
to climate change (UNESCO, 2014c). Tanzania is a country with a rapidly growing
population and a very high percentage of young people2
(Tanzanian National Bureau of
Statistics, 2016), making them key actors in driving the climate change adaptation and
mitigation process in the future.
1.4.3. Climate change and behavioural Change
It is argued that societal change is needed in countries such as Tanzania which are highly
vulnerable to the effects of climate but have limited capacity to adapt (IPCC, 2014b, p44,
UNESCO, 2015a). This societal change requires a change in behaviour which can
encourage climate change mitigation and allow for adaptation measures to be successful.
While much research has been conducted in the industrialised world on the individual
elements that inform this study – climate change knowledge, opinion and information
sources – there is a lack of research focused on sub-Saharan Africa. More acutely, there is
distinct gap in research and literature on the relationships between the abovementioned
factors and how they can influence behaviour. This observation is particularly true of sub-
Saharan Africa. When considering the vulnerability of Tanzania to climate change, the
importance of youth in tackling climate change and the distinct shortage of research on the
complexities of behavioural change in relation to climate change, this research finds itself in
a research space with considerable opportunity to inform academia and policy.
2
According to the most recent population and housing census from 2012, 35.1% of the population were
‘youth’, defined by the Tanzanian government as those aged 15-35, while 43.9% of the population were under
15.
13. 13
2. Literature Review
2.1. Key concepts
The IPCC defines climate as the “average weather, or more rigorously, as the statistical
description in terms of the mean and variability of relevant quantities over a period of time
ranging from months to thousands or millions of years” (IPCC, 2014f, p119). The typical time
period for measuring climate is 30 years, as identified by the World Meteorological
Organisation. According the most recent IPCC report, climate change refers to “a change in
the state of the climate that can be identified… by changes in the mean and/or the variability
of its properties and that persists for an extended period, typically decades or longer.” (IPCC,
2014f, p120) The report also notes that these changes can be as a result of “natural internal
processes or external forcings” (IPCC, 2014f, p120).
The United Nations defines youth as “those persons between the ages of 15 and 24 as
youth without prejudice to other definitions by Member States” (UN, 1981), while many
scholars argue that age based definitions of youth are not reflective of differing cultural or
social contexts (Tyyskä, 2005). This study assessed, via surveys and focus groups,
respondents between the ages of 12 and 30, with 83% of respondents falling within the 15-
24 age bracket.
2.2. Surveys on climate change awareness and education
Current studies with a focus on secondary school students’ knowledge and awareness of
climate change have shown a variety of contrasting results (Acikalin, 2013; Punter et al,
2011; Rajeev Gowda et al, 1997). Across a broader range of climate change knowledge and
awareness surveys which also includes adult respondents, we can note considerable
locational, socio-economic and other situational divergence in results. Despite this, there are
a number of general trends which can be noted. In a broad review by Lorenzoni and Pidgeon
(2006) of studies which look at public views on climate, there appears to be widespread
awareness of anthropogenic3
climate change, but limited understanding of its causes or
solutions to tackle it. More specifically, results consistently indicate considerable confusion
about the concepts of ‘the greenhouse effect’ and ‘global warming’ (Boyes & Stanisstreet,
1994 & 1997; Dawson, 2015; Fisher, 1998; Jean-Baptiste et al, 2007; Koulaidis & Christidou,
3
Anthropogenic: of, relating to, or resulting from the influence of human beings on nature –
Source: Miriam Webster Dictionary
14. 14
1999; Punter et al, 2011), with a great deal of misunderstanding in respect to the role of acid
rain and the ozone layer in climate change (Acikalin, 2013; Boyes et al. 1993; Pruneau et al.,
2001) and frequent confusion in differentiating between weather and climate (Rajeev Gowda
et al., 1997). In respect to causes of climate change, there is relative consistency in the
understanding that deforestation enhances global warming (Acikalin, 2013; Jean-Baptiste et
al., 2007), while there is inconsistency in understanding the role of the combustion of fossil
fuels in causing climate change (Boyes & Stanisstreet, 1993).
The understanding of the effects of climate change are notably region and context specific.
Surveys from many regions show a clear understanding of particular climate change
impacts, which have or will have clear effects on livelihood activities of the respondents
(Asekun-Olarinmoye et al, 2014; Becken et al, 2013; Olayinka et al., 2013; Shepardson et al,
2011; Mertz et al, 2009). The literature which considers peoples understanding of methods
of climate change mitigation and adaptation, have noted a broad range of results with a
reasonable understanding of the role of transport (Pruneau et al, 2001), land use (Acikalin,
2013, Jean-Baptiste et al., 2007) and energy production (Shepardson et al., 2011).
2.3. Surveys of views, attitudes and emotions towards climate change
Despite the relative abundance of surveys which have communicated results on climate
change views, attitudes and emotions among respondents in developed countries, gaps
remain in academic literature with a sub-Saharan African context. According to a Pew
Research Center (2015) poll, 49% of Tanzanians were “very concerned” about climate
change. Research from a largely Western perspective indicates that respondents have a
view that climate change would have little impact on their lives and also that they have little
personal agency in mitigating climate change or adapting to its effects (Lorenzoni & Pidgeon,
2006; Pruneau et al, 2001 & 2003). More specifically, several surveys reveal climate change
is a lower priority for most people in comparison to other personal and social issues
(Eisenack, Tekken & Kropp, 2007; Lorenzoni & Pidgeon, 2006). In contrast, studies on
American university students found that there are high levels of concern about climate
change (Wacholz et al., 2014; Cordero et al., 2008).
2.4. Surveys on sources of climate change information
Studies which assess engagement of audiences with various information sources in
developing countries are minimal. One study on climate change awareness in an urban
environment in Nigeria reports that broadcast media, print media and electronic media (e.g.
15. 15
internet) are the most prominent ways of receiving information on climate change (Olayinka
et al., 2013). Research that does exist primarily looks at agricultural workers engagement
with the media to inform climate change adaptation. Two such studies by Mwalukasa (2013)
and Ndhlovu (2016) which explore farmers’ access to climate change information in
Tanzania and Zimbabwe respectively, highlight the role of radio as a primary tool of
information dissemination. This is consistent with research by Luganda (2005), which
establishes radio as the primary medium for communicating climate change in rural Africa.
The important role of social ties with other farmers, which facilitate sharing of information on
climate change issues is emphasised in Mwalukasa’s (2013, p269) study. Ndhlovu’s (2016)
study recognises personal observations; broadcast and online media and print as the main
sources of climate change information – after radio. Despite the apparent prevalence of
broadcast media for receiving climate change information, Mwalukasa (2013) contends that
technologies such as radio and TV remain out of reach financially for many.
2.5. Climate change and behavioural change
Transitioning to a society which can effectively mitigate and adapt to climate change will
require social and behavioural change (Jackson, 2005, Moloney et al., 2010). Many studies
argue that the encouragement of behavioural change through the dissemination of
knowledge both within the education system and outside it, is a fundamental aspect of
coping with climate change (Jackson, 2005; IPCC, 2014b; OECD, 2009; UNFCCC, 2014b;).
It is argued that the optimal objectives of education and communication about climate
change are to involve people in mitigation and adaptation actions (Somerville & Hassol,
2011). Efforts to achieve attitudinal or behavioural change have traditionally failed to focus
on these elements and instead have adopted an ’information deficit’ model, with a focus on
climate change science, assuming that the right information will change attitudes, and in
turn, behaviour (Shove, 2010). However, concentrating almost exclusively on climate
science ignores many of the crucial cross-disciplinary aspects of climate change and an
increase in education level is not sufficient to evoke environmentally positive actions or
engender positive behavioural change (Heimlich & Ardoin, 2008; UNESCO, 2014d).
Despite a large body of research which supports the model that education can change
attitudes and attitudes will alter behaviour, there is considerable research indicating that
behavioural change relies on a range of complex and nuanced factors which are not
accounted for by this rationale (Leiserowitz et al., 2005). Mearns (2012) argues that
behaviour is highly resistant to change, while Bandura (1997) and Campbell (1963) agree
that information and admonition are among the least effective methods of influencing
16. 16
behaviour. Literature on environmental psychology help to further understand these
complexities by postulating that knowledge, experiences, feelings, social networks,
demographics and trust in institutions can all be influential in shaping attitudes and
behaviours (Blake, 2001; Kollmuss & Agyeman, 2002).
2.6. Approaches to increasing positive behavioural change
With these complexities and challenges in mind, Heimlich & Ardoin (2008) asserts that
effective communication should adopt an approach that addresses knowledge deficits, but
also awareness, state of mind, competences and participation (or action). Research has
shown that climate change science is inherently difficult to understand (Pruneau et al, 2001).
Localised social, economic, environmental and cultural differences are important aspects to
account for when communicating about climate change (UNESCO, 2014c). However it
should also be considered that in some cases traditional knowledge may no longer be
accurate due to the increased unreliability of climatic conditions as a result of climate change
(Red Cross/ Red Crescent, 2007). An additional aspect which can be considered when
communicating climate change information is to account for “what it is that each individual
has reason to value”, (Hart et al, 2012, p28) in relation to possibilities for mitigation and
adaptation. By utilising a capabilities approach as a theoretical framework for information
dissemination, the freedom to achieve wellbeing is centred on what people are able to do
and to be and therefore the kind of life they are ‘able’ to lead (Sen, 1993). This framework
can assist in developing communications which supports mitigation and adaptation with
tangible personal value and can improve wellbeing for individuals and communities. Finally,
accounting for and integrating observational learning is a valuable component of climate
change knowledge acquisition, where people acquire an understanding of climate change
through directly experiencing its effects and vicariously by witnessing the actions and
consequences of other peoples’ actions (Bandura, 1989).
2.7. Sources of climate change information and behavioural change
According to Christians & Glasser (2009), the media has a normative role in informing and
educating its audience on climate change. Since the 1980’s when anthropogenic climate
change first emerged as an issue, Moser (2010) contends that the question of how to
communicate the issue has been topical. Traditionally the approach to climate change
information dissemination saw lay people as illiterate, with the need of formal education to
address this (Miller, 2001; von Roten, 2006). Contemporary methods tend to emphasise
17. 17
public engagement with increased value placed on local knowledge and is contextually
sensitive (Miller,2001).
Social media in particular, is emerging as an important tool for disseminating information
about climate change. It is identified that there is considerable untapped potential in
empowering youth for positive action on climate change by utilising the benefits of
information and communication technologies (UNESCO, 2014c). Community and social
media have a particularly important role to play in empowering marginalized and vulnerable
groups (UNESCO, 2015b). New media has increased both access and frequency of access
to information for the public and has an ever increasing presence in sub-Saharan Africa
(Porter et al, 2016). Moser (2004) asserts that communication is more effective when there
is a relationship between the message bearer and receiver. Within this paradigm, social
media could be viewed as an important tool of social constructivism. Social constructivism
posits that knowledge and learning are constructed by connecting new information or
experiences with already acquired knowledge through dialogue and interaction with others
(Vygotsky, 1978). Interaction is key, with the theory being very much focused on ‘real world’
learning which also takes cultural nuances into account. Social media, as platforms that
facilitate collaboration, interaction, and exchange of user-generated content, provide an ideal
platform for the social construction of knowledge (Surowiecki, 2005). Youth utilise these
technologies for considerable periods of time, allowing users to take ownership of
information and become active in the knowledge creation and sharing process; thus
empowering users (Churcher et al., 2014; McLoughlin & Lee, 2008; Lave & Wenger, 1991).
2.8. Barriers to positive behavioural change
Awareness raising and attempts to bring about attitudinal change with the objective of
altering behaviour can face many social, psychological and behavioural barriers (Maiteny,
2002; Southerton et al, 2011; Winefield, 2005). Individual barriers include a lack of
knowledge; distrust in information sources; externalising responsibility; uncertainty;
scepticism; financial constraints; unaligned values, habits or beliefs; limited connection to
nature; disempowerment; lack of agency; reluctance to change lifestyles and the perception
of climate change as a distant threat (Kollmuss & Agyeman, 2002; Maiteny, 2002;
Southerton et al, 2011; Winefield, 2005). In addition, many of the present day impacts of
climate change do not appeal to sensory perception, where impacts are hidden, invisible or
‘too far away’ to be of importance in everyday life in many contexts (Pruneau et al, 2001).
Similarly, climate change is seen as psychologically distant in time and space for many
groups (Jones et al. 2016; Spence et al. 2012).
18. 18
Trust in information sources is a key determinant to whether communication is effective in
shaping attitudes and opinions (Happer & Philo, 2013). This can be challenging in light of a
body of literature which posits that people often have to rely on untrustworthy media sources
(Rajeev Gowda et al., 1997; Gayford, 1998; Gayford, 2002). Mwalukasa’s (2013) study
assessed levels of trust farmers placed on differing information sources, returning results
that identified friends, neighbours and other farmers as the most trusted source and
television, posters and workshops, among others, as the least trustworthy. Buys et al.’s
(2014) rural Australia study reports that politicians, government and the media in general are
sources of information that are not trusted.
19. 19
3. Methodology
3.1. Methodological approach
This research was undertaken utilising a mixed methods approach. Quantitative data was
gathered via surveys and semi-structured focus groups allowed for triangulation of results
(Lowe, 2007). The research was initially designed as cross-sectional quantitative study
which sought primarily to assess climate change knowledge. Following preliminary analysis
of data from this process, it was deemed necessary to complement the research with
qualitative data through semi-structured focus groups with third level students (Teddlie &
Tashakkori, 2009). Following the gathering of surveys, this research undertook an inductive
reasoning approach in order to “search for pattern from observation and the development of
explanation – theories – for those patterns” (Bernard, 2011, p7). A mixed method approach
serves to add strength to the research design and attempts to better explain observations
from quantitative analysis (Creswell & Plano Clark, 2011). Further, a sequential design
approach was taken, where the qualitative data provided further insight into findings from the
quantitative data (Morgan, 1998). The primary data gathering for this study was undertaken
between May and July 2015.
3.2. Secondary school student surveys
Surveys were initially the main research instrument and were employed due to their ability to
gather data on respondents demographic, opinion, knowledge and experiences (Rowley,
2014), as well as the possibility of acquiring a large sample size quickly and systematically
(Schutt, 2009). Surveys were developed upon review of a broad range of previously used
and researched knowledge and awareness surveys (Adetayo, 2013; Brown et al., 2012;
CEED, 2011; Curry et al., 2007; Rajeev Gowda et al., 1997; Whitmarsh, 2003), and following
review of Tanzanian secondary school syllabi and text-books in Geography, General
Studies, Chemistry and Biology at both Ordinary (O) level and Advanced (A) level, which
were identified as those with climate change content. In addition, attempts were made to
simplify the survey instrument as much as was reasonable to allow for students of ages
twelve to twenty to complete. Recommendations from Stone (1993) on reliable survey
design and McAvoy et al. (1996) on appropriate and unbiased assessment criteria were also
accounted for in survey design. The survey instrument developed for this stage of the
research was amended from an earlier stage of the study undertaken between May-July
20. 20
2014 to enable some level of comparison; however significant changes were also made to
reflect a different demographic and to account for errors or improvements which were
identified from that stage.
The survey instrument was developed initially in English (Appendix 2), the official language
of instruction at secondary school in Tanzania. Upon arrival in Tanzania, the instrument was
reviewed and amended further by staff within DUCE and finally submitted to a number of
teachers who work directly with secondary level students at the DUCE affiliated secondary
school. Language and content were assessed for their appropriateness to the survey
demographic (Fink & Kosekoff, 1985) and included the use of Likert scales to assess the
strength of attitude or feeling towards statements (Bell, 2005, p142). Teachers at the
secondary school recommended changing the document to Swahili (Appendix 3), the native
language of Tanzania, and the medium of instruction in (public) National schools in
Tanzania. The survey was translated to Swahili and further reviewed and amended by
DUCE staff and teachers at the secondary school before being piloted among students in
Form 1 (n=25) (ibid, p147). All students in this group were subsequently excluded from
further surveys. The delivery of surveys was accompanied by an explanatory briefing for
students in Swahili (Appendix 4). Surveys took approximately 20 minutes to complete.
There were approximately 450 students at the secondary school at the time of research.
Students from both junior cycle (O-level) and senior cycle (A-level) were included in the
survey sample. A target sample of students from form one to five was utilised. Form six
students (n = 40) were excluded from the sample due to timetabling restraints that conflicted
with national examinations, leaving a sample size of approximately 410 students. An
appropriate sample size was calculated following the ‘sampling error formula’ (Krejcie &
Morgan, 1970) which indicated that a sample size of 254 was required to deliver results with
a 99% confidence level and a confidence interval of 5.0. A convenience sampling method
(Creswell, 2012, p142) was employed, where eligible students were those in attendance
during the survey data gathering period. 296 surveys were completed between May 18th
and
25th
, 2015. Surveys were assigned an identification number following completion, alleviating
double entry issues and a data dictionary was employed to ensure efficient data entry and
follow data validity and reliability procedures. Completed surveys were coded (ibid, p176)
and input into an excel spreadsheet. Following data screening and cleaning, 11 surveys
were excluded due to 10% or more of the questions being invalid (ibid, p182). A final sample
size of 285 surveys were analysed using Statistical Package for Social Sciences (SPSS)
version 20 and STATA version 13 between June 2015 and July 2016. Data was analysed
using both descriptive and inferential statistical methods (ibid, p181).
21. 21
3.3. DUCE student focus groups/ surveys
Following initial analysis of secondary school students’ surveys, it became clear that
students gathered information about climate change from a broad range of sources outside
the classroom. A better understanding of youth engagement with various traditional and
contemporary information sources was required in order to better understand and interpret
results. Focus groups provided an appropriate platform to allow for student interaction and to
assess “how people think about an issue – their reasoning about why things are as they are,
why they hold the views they do” (Laws, 2003, p299). Focus groups were used to foster
interactive dialogue and debate in order to extract personal opinions, attitudes and group
trends (Barbour, 2007) in relation to their engagement with different sources of information
about climate change. Focus groups were semi-structured, allowing participants to drive the
conversation to some extent (Morgan, 1998). The questions for the focus groups (Appendix
5), were developed in direct response to trends that were noted upon early stage analysis of
the secondary school students’ surveys taking into account aspects which are crucial to
focus group design (Barbour, 2007).
Given ethical restrictions of conducting interviews or focus groups with the original survey
respondents (who were largely under the age of consent), it was decided to conduct focus
groups with teacher trainee students between ages 19 and 30 who were studying at DUCE.
Focus groups were conducted between June 3rd
and 10th
2016. A snowball sampling method
was utilised to identify focus group participants (Creswell, 2012, p143), where an initial group
was identified using a nonprobability sampling method (ibid), with this group then assisting in
sourcing additional participants. 6 focus groups were conducted, each with 6-10 participants.
In order to account for any potential gendered differentiation in responses and to ensure a
facilitative and relaxed atmosphere (Hayes, 2000, p395), 2 groups were entirely male, 2
entirely female, and 2 mixed male and female. Focus group responses were transcribed and
analysed manually, with comparisons noted among respondents4
. All focus group
respondents also completed a short survey (Appendix 6) to ascertain their demographic and
educational background and ensure a representative sample of the DUCE student body was
obtained, thus limiting selection bias. Survey responses were coded, input into Microsoft
excel and analysed using SPSS version 20.
4
Full focus group transcripts, transcript summaries and word map can be found at:
https://www.dropbox.com/sh/c7bh2z7qwf9r9zr/AAD8y27RCc0xZcTOFuz6EPwta?dl=0
22. 22
An inductive thematic analysis (Lodico et al., 2010) was conducted on the focus group
transcriptions. Interviews were analysed by categorising answers according to question and
coding text according to common themes and trends (Miles & Huberman, 1994, p56). An
inductive approach aims at generating meaning through the identification of patterns and
relationships in order to build and inform conclusions or support a theory (Neuman, 2003).
3.4. Data gathering procedures & ethical considerations
Procedures which dictate the processes for survey, interview and focus group dissemination
and return and data confidentiality and security were followed according to the guidelines as
set out by the Trinity College Dublin ethics committee. Approval was sought and granted for
the completion of this research from this committee. As this research involves gathering
information from children ages 12-18, there are a number of steps that have been taken to
ensure compliance with ethics guidelines. The researchers had no direct access or
interaction with children, with questionnaires being delivered and collected by secondary
school teachers. In addition, to ensure confidentiality, all questions were anonymous and
unidentifiable. Informed consent was obtained from all focus group participants (Appendix 7)
and their rights to self-determination were ensured by communicating with participants that it
was possible to withdraw from the study at any time.
3.5. Limitations
The research methodology has a number of restraints which are acknowledged. In respect
of the students’ survey, the final instrument was delivered in Swahili, which is not the
language of instruction in the school. This could potentially cause translation issues as
respondents may have learnt a concept in English but are being surveyed about that
concept in Swahili. The secondary school which was chosen may not be representative of
an urban Tanzanian public school as it was not chosen randomly and instead selected due
to a convenience selection method. During the focus groups and consequent transcriptions
and assessment, there is the possibility that due to language or cultural differences
misunderstandings or misinterpretations of questions, answers and discussion between the
researcher and research participants and vice versa may have occurred. Finally, researcher
positionality may have had a role in influencing focus group and interview responses.
23. 23
4. Results
Analysis of the survey dataset and summary of focus group transcriptions have resulted in
an overview of the data gathered and allows for further evaluation by identifying associations
or trends, which are presented below.
4.1. Secondary school student surveys
4.1.1. Demographics
The majority of surveyed students at the secondary school are between the ages of 14 and
17 (74%) (Table 4.1), with an almost equal distribution of males and females (52% vs. 48%
respectively) (Table 4.2). Students’ year of study between Form 1 and Form 5 was relatively
consistent (Table 4.1), however a considerably larger number of students in Form 4 were
surveyed (33%). Five students’ survey results were returned indicating that they were in
Form 6, despite the intended exclusion of this Form.
Table 4.1: Student age and form (n=285)
Form
Age 1 2 3 4 5 6 Total (%)
12 1 - - - - - 1 (<1)
13 7 1 - - - - 8 (3)
14 24 9 3 - - - 36 (13)
15 10 32 17 2 - - 61 (21)
16 2 8 27 23 - - 60 (21)
17 3 3 6 40 1 - 53 (19)
18 - - - 17 9 1 27 (9)
19 - - - 7 10 3 20 (7)
20 - - - 4 14 1 19 (7)
Total (%) 47 (16) 53 (19) 53 (19) 93 (33) 34 (12) 5 (2)
Table 4.2: Student gender breakdown (n=284).
Sex n (%)
Male 148 (52)
Female 136 (48)
24. 24
4.1.2. Climate change knowledge
The majority of students (82%) indicated that they had learnt about climate change in
Secondary School, while 17% indicated they had not (table 4.3).
Table 4.3: Students’ who self-identify as having learnt about climate change in school
(n=283).
n (%)
Yes 232 (82)
No 47 (17)
Don’t Know 4 (1)
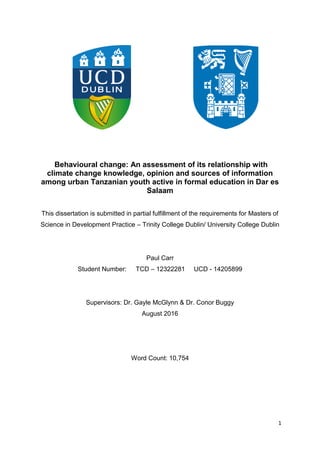
Students were presented with a list of both greenhouse gases (GHGs) and non-
GHGs and asked to correctly identify which they believed to be GHGs. None of the
greenhouse gases (GHGs) were correctly identified by more than 50% of
respondents (Figure 4.1). 49% of students identified carbon dioxide as a GHG while
the other principal greenhouse gas, methane, was only correctly identified by 24% of
students. Oxygen was the most frequently identified non GHG (21%), followed by
nitrogen (15%), hydrogen (13%), argon (4%) and helium (4%). 25% of respondents
indicated that they did not know any of the GHGs.
Figure 4.1: Students’ identification of GHGs (%) (n=271)
Note: Greenhouse gases are identified by an asterisk *
Note: Students were asked to choose as many options as they felt necessary
0
10
20
30
40
50
%
25. 25
Students were given a list of 32 statements related to climate change, and were asked to
answer “True”, “False” or “Don’t Know” to each. The statements were a mixture of true and
false statements and were designed to test students’ knowledge in the following areas:
7 statements related to an understanding of weather and climate (Q1-7);
7 statement related to the causes of climate change (Q8-14);
8 statements related to the effects of climate change (Q15-22);
7 statements related to methods of mitigation and adaptation to climate change
(Q23-29); and
3 statements related to an understanding of basic ocean science (Q30-32).
A summary of the percentage of answers which were answered correctly, incorrectly and
which had “don’t know” responses can be seen in Figure 4.2, allowing a general overview of
the results, while an individual breakdown of questions can be found in Appendix 8.
Collectively for the 7 questions related to climate and weather, 48% of the students chose
the correct answer, 33% of students chose the incorrect answer while 19% of students did
not know the answer. Questions eight to fourteen tested students’ knowledge of the causes
of climate change which produced results with the lowest average of correct answers (46%)
and highest percentage of incorrect answers (42%). On average, 12% of students “didn’t
know” the answer to these questions. Climate change effects was the category of questions
which returned the highest average correct answers (63%) and lowest average incorrect
answers (20%), while 16% indicated they “didn’t know” the answer. On average, 54%
answered correctly, 33% answered incorrectly and 13% “didn’t know” the answer to
adaptation and mitigation questions, constituting the second best answered category. In the
final knowledge questions, students were asked more specific questions related to ocean
science. An average of 52% of students answered these three questions correctly, 21%
incorrectly and 27% “didn’t know” the answer. When averaged across all 32 knowledge
questions, 53% of students answered the questions correctly, 30% incorrectly while 17%
“didn’t know” the answer.
26. 26
Figure 4.2: Breakdown of students' answers to knowledge questions (%) (n=285).
4.1.3. Personal opinions and attitudes on climate change
In order to gain a better understanding of students personal views on climate change,
students were presented with a series of twelve statements, to which they were asked if they
“agreed”, “disagreed” or were “neutral” towards the statement. The results of this Likert scale
are presented in table 4.4. Respondents agree in large percentiles that humans have a
considerable effect on climate change (87%), that all countries should do something and
help each other to stop climate change (83% and 90% respectively) and that the Tanzanian
government should play a more active role in tackling climate change (91%). 87% of
students desire to learn more about climate change in school. 74% of total respondents
indicated that “climate change is a big problem for Tanzania”, however 72% of students
believe that it is not “too late” to tackle climate change.
0
10
20
30
40
50
60
70
Climate and
Weather
Cause Effect Adaptation &
Mitigation
Ocean
Science
TOTAL
%
Correct Incorrect "Don't Know"
27. 27
Table 4.4: Student attitudes and perceptions towards climate change
Students were asked a number of additional questions in order to better ascertain
their opinions and attitudes towards climate change that did not fit easily within the
above Likert scale evaluation system. When asked what they felt were the biggest
problems in Tanzania today, climate change ranked 5th
out of 6 available options
(figure 4.3). When asked if climate change affected students directly, 73% indicated
that it had an effect on them personally, while 22% felt that it did not affect them
(figure 4.4). Students were asked what emotions they felt in relation to climate
Agree
n (%)
Neutral
n (%)
Disagree
n (%)
Total
n
1. Climate Change is mostly
something that happens naturally
70 (25) 71 (26) 136 (49) 277
2. Humans have a big effect on climate
change
245 (87) 23 (8) 15 (5) 283
3. Things other than humans have an
effect on climate change
113 (41) 73 (26) 92 (33) 278
4. It is already too late to do anything
about climate change.
25 (9) 51 (19) 198 (72) 274
5. All countries should do something
to stop climate change.
234 (83) 31 (11) 16 (6) 281
6. All countries should help each other
to stop climate change
247 (90) 19 (7) 10 (4) 276
7. Europe and America are causing
most climate change, so they
should take the blame for it.
71 (25) 87 (31) 124 (44) 282
8. Rich countries should fix climate
change in poor countries.
212 (75) 39 (14) 32 (11) 283
9. The Tanzanian government should
do more to stop climate change.
256 (91) 16 (6) 11 (4) 283
10. Climate change is a big problem for
Tanzania
210 (74) 47 (17) 27 (10) 284
11. I want to learn more about climate
change at school.
246 (87) 32 (11) 6 (2) 284
12. I am worried about climate change 171 (60) 82 (29) 30 (11) 283
28. 28
change, with fear, anger, powerlessness and sadness being the most dominant
emotions (figure 4.5).
Figure 4.3: Students’ perception of whether climate change affects them (n=279)
Figure 4.4: Students’ perception of the biggest problems in Tanzania (n=283)
Note: Students were asked to tick 2 boxes
Figure 4.5: Breakdown of students reply to "How do you feel about climate change" (n=271).
Note: Students were asked to tick 3 boxes
4.1.4. Sources of climate change information
0
20
40
60
80
Yes No Don't Know
NumberofStudents
0
20
40
60
Poor
Infrastructure
Poverty Unemployment Corruption Climate Change Disease
NumberofStudents
0
20
40
60
80
NumberofStudents
29. 29
The final section of the survey asked students a series of questions which sought to gather
information about the sources through which students get information about climate change.
The first question in this section asked students to choose from a list of media sources/
vehicles of information and to identify all the ways in which they get information about
climate change (figure 4.6). Both local and national TV are identified as the most prominent
sources of information on climate change with 58% and 53% of students identifying these
sources respectively. The next most popular avenue to gather information is school, with
more than half (52%) of the students identifying this as a source of information. Both local
and national radio also feature heavily in respect to information sources, with 50%
recognising local radio and 37% identifying international radio as sources. The more
contemporary media of internet/ social media was identified as a source of information on
climate change by 46% of students.
Figure 4.6: Sources of Climate Change Information (n=226).
Note: students were asked to ‘tick all boxes that apply’
4.1.5. Knowledge/ opinion score and tests
In order to assess associations between levels of knowledge of climate change, positive/
negative views/ attitudes and perceptions of climate change and sources of climate change
information, a scoring system was employed (Appendix 9/10). All relevant answers in section
4 (knowledge) and sections two (personal views) and three (attitudes and perceptions) were
given a numeric value. For the purposes of this study, the combined scores from sections
two and three will be referred to as the ‘opinion’ section/ scores. The summarized results of
0
10
20
30
40
50
60
Numberofstudents
30. 30
scores for the knowledge section of the test can be found in table 4.5. The maximum and
minimum scores for the knowledge section were 35 and -35 and 35 and -33 for the opinion
section.
Table 4.5: Summary of knowledge/ opinion scores (n=284)
Knowledge
n Mean St. Deviation Min Score Max Score
285 7.42 5.71 -8.5 20.5
Opinion
n Mean St. Deviation Min Score Max Score
285 15.51 4.59 -4 25
4.1.6. Associations between knowledge and opinion
Pearson correlation tests were performed to test the significance of the relationship between
knowledge scores and opinion scores. In order to assess in more detail the nature of this
relationship, correlations between opinion scores and the scores from each of the 5
categories of knowledge questions were also obtained (table 4.6). Overall, there is a strong
positive correlation between knowledge and opinion scores at the 0.01 level. When
knowledge questions are categorised it can be observed that the strongest significant
correlations exist between ‘effects of climate change’ questions (significant at 0.01 level),
followed by ‘adaptation and mitigation’ and ‘weather and climate’ (both significant at the 0.05
level). There is a positive correlation between higher opinion scores and increased
knowledge of ocean science, while there is a minor negative correlation between opinion
scores and correct answers to ‘causes of climate change’ questions.
Table 4.6: Pearson correlations between categorised knowledge scores and opinion score
Knowledge Category Correlation Value
Weather & climate .128*
Causes of climate change -.032
Effects of climate change .226**
Adaptation & Mitigation .130*
Ocean Science .122
Combined knowledge Score .254**
* Correlation is significant at the 0.05 level (2-tailed)
** Correlation is significant at the 0.01 level (2-tailed)
31. 31
Knowledge and opinion scores are disaggregated by gender, age and grade (form) in table
4.7, while Pearson correlations between these demographics and knowledge/ opinion scores
are presented in table 4.8. When table 4.7 and 4.8 are examined together, we can see that
there is no significance between results for males and females. When students age is taken
into account, we find that there is signifance between age and knowledge score at the 0.01
level (table 4.8). However, there is little consistency and no clear trends in the associations
between age and knowledge score as they fluctuate considerably (table 4.7). Similarly, there
is signifance in the correlation between knowledge score and a students grade at the 0.05
level (table 4.8), but again little consistency and only a very small trend towards higher
scores for higher form (table 4.7). There are no significant correlations or observable
associations between opinion scores and gender, age or grade with only a small positive
correlation between higher scores and being female/ increase in age and a small negative
correlation between opinion score and a higher grade (table 4.8).
Table 4.7: Association tests on knowledge/ opinion score and gender (n=284), age (n=285)
and form (n=285)
Knowledge
Gender n Mean St. Deviation Min Score Max Score
Male 148 7.55 5.95 -8.5 20.5
Female 136 7.28 5.48 -6.5 18.5
Age n Mean St. Deviation Min Score Max Score
12 1 10.5 - 10.5 10.5
13 8 6.50 4.43 2.5 16.5
14 36 5.92 4.73 -3.5 13.5
15 61 6.26 6.10 -6.5 18.5
16 60 6.98 5.00 -8.5 15.5
17 53 9.52 5.52 -1.5 20.0
18 27 6.65 6.51 -6.0 17.5
19 20 8.60 6.29 -4.5 20.0
20 19 9.66 5.97 -3.5 20.5
Form n Mean St. Deviation Min Score Max Score
Form 1 47 7.37 4.39 -1.5 16.5
Form 2 53 5.92 5.37 -6.5 14.5
Form 3 53 6.31 6.26 -8.5 18.5
Form 4 93 8.27 5.96 -6 20.5
Form 5 34 9.06 5.55 -4.5 17.5
Form 6 5 8.80 7.05 -.5 17.5
Opinion
Gender n Mean St. Deviation Min Score Max Score
Male 148 15.26 4.70 -4 25
Female 136 15.78 4.48 -2 25
Age n Mean St. Deviation Min Score Max Score
12 1 19 - 19 19
32. 32
13 8 16 3.82 12 22
14 36 16.14 3.37 9 22
15 61 15.03 4.28 2 25
16 60 15.85 5.30 -4 25
17 53 15.30 4.97 5 25
18 27 15.37 4.54 0 23
19 20 16.4 3.14 10 22
20 19 14.16 5.88 1 24
Form n Mean St. Deviation Min Score Max Score
Form 1 47 15.68 4.26 2 25
Form 2 53 15.45 4.15 7 25
Form 3 53 15.79 3.96 -4 23
Form 4 93 15.38 5.13 -2 25
Form 5 34 15.29 5.37 1 24
Form 6 5 15.20 3.70 10 19
Table 4.8: Pearson correlations between knowledge/ opinion score and gender/age/grade.
Knowledge
Demographic Correlation Value Explanation
Gender -0.24 Negative with female
Age .171** Positive with >age
Grade .136* Positive with higher grade
Opinion
Demographic Correlation Value Explanation
Gender .005 Positive with female
Age .055 Positive with >age
Grade -.025 Negative with higher grade
* Correlation is significant at the 0.05 level (2-tailed)
** Correlation is significant at the 0.01 level (2-tailed)
4.1.7. Associations between knowledge/ opinion score and additional factors
To facilitate a better understanding of the interactions between knowledge scores and
specific areas of interest, associations were assessed between the scores and a number of
questions across various sections of the survey. Students who indicated that they have
learnt about climate change in secondary school exhibit considerably higher mean
knowledge scores than those who indicated that they did not learn about climate change in
secondary school, while there appears to be a small negative association between a higher
opinion score and having learnt about climate change in secondary school (table 4.9).
33. 33
Table 4.9: Test on associations and correlations between knowledge/opinion score and
"have you learnt about climate change in secondary school?" (n=283)
Knowledge
n Mean St. Deviation Min Score Max Score
Yes 232 7.83 5.70 -8.5 20.5
No 47 5.76 5.65 -5 18.5
Don’t know 4 2.25 5.32 -3.5 8.5
Opinion
n Mean St. Deviation Min Score Max Score
Yes 232 15.35 4.55 -4 25
No 47 16.26 4.82 -2 25
Don’t know 4 16.75 4.57 12 22
When associations are assessed between students’ knowledge and opinion scores and their
answers to “what are the biggest problems in Tanzania?” it is notable that students’ who
identified climate change as the biggest problem in Tanzania have considerably higher mean
knowledge scores than those who chose other options, with a highly significant correlation
between these aspects at the 0.01 level (table 4.10).
Table 4.10: Tests on associations and correlations between knowledge/ opinion score and
“what are the biggest problems in Tanzania.” (n=285)
Knowledge
n Mean St.
Deviation
Min
Score
Max
Score
Correlation
value
Poor
Infrastructure
140 7.00 5.59 -8.5 20 -.054
Poverty 93 7.10 5.88 -8.5 20.5 -.027
Climate Change 72 9.21 5.21 -3.5 20 .201**
Disease 8 4.31 6.74 -6.5 14.5 -.092
Unemployment 90 6.88 6.16 -6.5 20.5 -.052
Corruption 73 7.64 5.43 -3.5 17.5 .036
Opinion
n Mean St.
Deviation
Min
Score
Max
Score
Correlation
value
Poor
Infrastructure
140 15.26 4.55 -4 25 -.080
Poverty 93 15.01 5.32 -4 25 .032
Climate Change 72 16.03 4.51 -2 23 .344**
Disease 8 17.13 3.87 12 22 -.008
Unemployment 90 15.37 4.53 1 25 -.094
Corruption 73 16.11 4.15 2 25 -.094
Note: Students were asked to choose 2 options
* Correlation is significant at the 0.05 level (2-tailed)
** Correlation is significant at the 0.01 level (2-tailed)
34. 34
4.1.8. Correlations between knowledge/ opinion score and sources of climate
change information
Correlations were also assessed between students’ knowledge and opinion scores and the
sources of information that they utilise to gather information on climate change (Table 4.11).
When assessing correlations with knowledge scores, there are statistically significant
relationships between higher scores and gaining information about climate change through
national TV, School and international TV. There are no statistically significant relationships
between higher opinion scores and particular sources of information, however the strongest
associations between these can be observed with Tanzanian radio, the library, newspaper/
magazines and international TV as sources of information.
Table 4.11: Pearson correlations between sources of information on climate change and
knowledge/ opinion score (n=226)
Knowledge Score Opinion Score
Source Correlation Source Correlation
Tanzanian TV .188** Tanzanian Radio .114
School .183** Library .113
International TV .141* Newspaper/ Mag .102
Internet/ Social Media .108 International TV .102
International Radio .102 School .099
Tanzanian Radio .095 Flyers .090
Friends/ Relatives .080 Internet/ Social Media .048
Church .057 Friends/ Relatives .055
Newspaper/ Mag .042 Tanzanian Radio .027
Library .017 Posters/Billboard .001
Flyers .019 International Radio .003
Posters/ Billboard -.021 Friends/ Relatives -.058
Video/ DVD -.051 Video/ DVD -.069
None -.071 None -.104
* Correlation is significant at the 0.05 level (2-tailed)
** Correlation is significant at the 0.01 level (2-tailed)
4.2. DUCE student focus groups
4.2.1. Demographics
Semi-structured focus groups consisted of 46 DUCE students age 19 to 30 (table 4.12) with
an almost even number of males and females (table 4.13). Participants self-identified
themselves as most dominantly originally from large rural villages (44%) or small towns
35. 35
(27%) (table 4.14) and had a relatively even distribution across 1st
, 2nd
and 3rd
years of study
at DUCE (table 4.15). All participants indicated that they had learnt about climate change in
secondary school.
Table 4.12: DUCE Student age n=46) Table 4.13: DUCE Student gender
(n=46)
Age n (%)
19-24 34 (74)
25-30 12 (24)
Table 4.14: DUCE Student breakdown of
where they grew up (n=45).
Location n (%)
Small town 12 (27)
Rural small village 3 (7)
Rural large village 20 (44)
Large town 7 (16)
City 3 (7)
Focus groups consisted of 6 groups of 6-8 people; 2 with a mix of male and female; 2 all
female and 2 all male. Upon review it did not appear that there were any significant
differences between the sexes in relation to their responses. While numerous questions
were asked of participants, they were centred around two core questions, with a number of
follow up questions used to gather more information about the nature of information
dissemination and engagement5
:
How do you get information about climate change?
Do you trust the information that you are receiving about climate change?
4.2.2. Sources of climate change information
4.2.2.1. TV/ Radio
The most common method of receiving information about climate change that was identified
by all groups was both TV and radio.
5
A summary of focus group transcripts can be accessed online:
https://www.dropbox.com/s/dkmg6d0pzjbgvyd/Focus%20group%20summary.docx?dl=0
Sex n (%)
Male 22 (48)
Female 24 (52)
Year n (%)
1st
11 (24)
2nd
21 (46)
3rd
14 (30)
Table 4.15: DUCE Student year
of study (n=46
36. 36
“We get information on climate change mostly through TV’s and radios and other
mass media (focus group 5).”
While there was a recognition that most students do not have personal access to a TV in
their homes or dorms, they indicated that there are always ways to access this media “on the
street or in a bar (focus group 2)”. Despite the apparent proliferation of TV as a source of
information on climate change, a number of students disagreed with this consensus,
believing that these sources are not used for the purpose of gaining information about
climate change - “I believe that few students in DUCE nowadays do watch TV (focus group
6)”, or that access is unattainable for many – “Not everyone in Tanzania can afford to obtain
these appliances. I mean TVs, radios (focus group 4)”.
4.2.2.2. Internet/ social media
All 46 students in the six focus groups indicated that they had smartphones. Social media
and the internet were identified as dominant sources of information on climate change by a
large number of students.
“Most students use the big one is social media, that is what most of them use. They
maybe say chatting through Whatsapp, Facebook, using Instagram (focus group 1).”
A number of responses facilitated a more in depth assessment of the nature of how these
social media platforms are utilised and the speed and quantity of information that is
available.
“If something happens there is floods somewhere, you get pictures from Whatsapp,
in Facebook also, they transfer very fast when you compare to maybe the television.
(focus group 3).”
“For myself, through the social media we have a group of friends where we keep
updating ourselves about… the climate issues (focus group 6).”
As with TV, there was also some disagreement with the general consensus that new media
such as the internet and social media are used for the purposes of gaining or sharing
information about climate change and instead are used for “chatting and friending and
watching porns (focus group 2).”
37. 37
4.2.2.3. Other sources
Interpersonal communication was identified repeatedly as a means of information
dissemination, where “the grape vine (focus group 1)”, elders (focus group 5)” and traditional
methods are utilised:
“In this climatic changes, there is information that is obtained traditionally... For
example you see a flock of birds flying, or there are ants arriving from the grounds
some time and passing around the farm (focus group 4).”
A number of other sources of climate change information were also identified by a small
number of respondents, including posters, newspapers, magazines, “government in some
situations (focus group 3)”, books, education and “UN clubs (focus group 2)”. There was also
an indication that various media use is combined under certain circumstances.
“There are some social media that we can use for instance to look at certain type of
news and then you will follow that type of news on the internet or maybe the
newspaper or the radio (focus group 1.)”
4.2.3. Trust in information sources
The vast majority of focus group participants identified broadcast media of TV and radio as
the sources of information they trusted most:
“Here are government Tanzanian Broadcasting Corporation, which is TBC, it is the
most trusted by most Tanzanian, because it is owned by government (focus group
6).”
There were a number or participants who indicated that they do not trust the nature of social
media and the internet for gathering accurate information about climate change, citing
reasons such “we tend to exaggerate (focus group 6)” and “on the internet everyone can
share, and it does not have to be correct (focus group 5).” A number of participants across
various focus groups specifically referred to traditional knowledge gathering as a source of
information on climate change to be trusted, and in some cases put more trust in this than
any other information outlet.
38. 38
“Normally I think in the rural they are more accurate than the modern ways, and I
don’t know how. I think because the rural they use things which are directly involved
in the Earth (focus group 6).”
4.2.4. Additional observations
In all focus groups, there was a strong sense of confusion relating to the definition of
weather and climate and it was often unclear if respondents were talking about the
phenomenon of climate change or in-fact confusing it with daily weather forecasting. On
other occasions the terminology of weather and climate were used interchangeably, with no
clear difference implied between both:
“We get climatic awareness through mass medias, especially TV sessions and radio
sessions. I think it is weather forcasting sessions that we get awaresness of climatic
changes (focus group 1).”
On a number of occasions students identified that peoples’ interest in obtaining or seeking
out information on climate change is based strongly on personal experience or the direct
effects that climate change will have on a person or group at a particular time.
“I can say that people can maybe become interested in the TV news concerning
climatic change if it touches them. Sometimes people may not follow some climatic
change if it is out of the interest (focus group 1).”
Observations came to light also in relation to respondent’s personal attitudes towards
climate change, reflecting a broad spectrum of opinions. A number of participants had
particularly positive opinions on their own interest in the topic of climate change while others
more specifically referred positively on the role of educators in ensuring the effective
dissemination of climate change knowledge:
“We always search [on the internet] for causes of climate change because we are
really concerned about that (focus group 5).”
Conversely, on a few occasions students indicated that it is their belief that people have a
lack of interest in the topic of climate change and “people are not interested in what is going
on and planning for change (focus group 2).”
39. 39
5. Discussion
This chapter attempts to bring the various aspects from the literature review and results
together and assess observations by revisiting themes such as: climate change knowledge,
engagement with information sources; climate change and behavioural change and potential
barriers to successful behavioural change, while attempting to present answers to the
research question and sub-questions posed.
5.1. Levels of climate change knowledge/ awareness (sub-question 1)
From the results presented in the student surveys it is clear that students at the secondary
school have some knowledge and awareness of climate change, but that significant gaps in
knowledge exist. Perhaps more importantly, students harbour considerable
misunderstandings about climate change. When taken collectively two fundamental
observations can be extracted from the secondary school students’ surveys in relation to
climate change knowledge. The first key observation, supporting research by Pruneau et al
(2001), and as evidenced across a broad spectrum of knowledge surveys, is that climate
change science is a topic which presents considerable challenges to understand, an
observation supported by the low levels of knowledge of climate change science among
secondary school students.
Studies by Jean-Baptiste et al. (2007) and Koulaidis & Christidou (1999), returned similar
results showing a lack of understanding of GHGs while low levels of understanding of the
concepts of climate and weather, acid rain, the ozone layer, and to a lesser extent ocean
science, reflect a series of results from similar surveys globally which assessed
understanding of these concepts (Acikalin, 2013; Boyes et al. 1993; Pruneau et al., 2001;
Rajeev Gowda et al., 1997). In support of the claim that students have a misunderstanding
and confusion between climate and weather (Rajeev Gowda et al., 1997), it is evident from
the observations of DUCE student focus groups that confusion around definitions of climate
and weather are not isolated to secondary school students. Low understanding of the
causes of climate change, where less than half of the surveyed students identified the
combustion of fossil fuels as a contributor to climate change, has similarities with Boyes &
Stanisstreet’s 1993 study.
The second key observation which can be drawn is that causes, effects, mitigation and
adaptation knowledge are stronger where there is a connection that could be made between
that aspect and the lives of respondents. Examples of this can be observed where students
40. 40
exhibit a strong understanding of the role of climate change in an increase in extreme
weather events and the spread of disease and that utilising public instead of private
transport and reforestation can have positive impacts on climate change mitigation. This
trend echoes numerous knowledge based surveys which identify positive relationships
between direct personal impacts and aspects of climate change knowledge which relate
specifically to that impact (Asekun-Olarinmoye et al, 2014; Becken et al, 2013; Olayinka et
al., 2013; Shepardson et al, 2011; Mertz et al, 2009). In addition, DUCE student focus
groups identified a number of extreme weather events and other personal impacts of climate
change on their lives.
5.2. Perceptions/ attitudes/ personal views on climate change (sub-question 2)
From the survey results on secondary school students’ opinions and attitudes on climate
change, we can observe that students readily recognise the negative contribution that
humans play in anthropogenic climate change, believe that all countries including their own
should play their part in tackling climate change and are assured that it is not too late for
nations, or themselves, to do so. In addition, almost three quarters of students perceive that
climate change affects them personally, while the most dominant emotions associated with
climate change are negative. These results are largely in contrast to research conducted by
Lorenzoni & Pidgeon (2006) and Shepardson (2011), where respondents indicated that they
did not feel a sense of agency related to tackling climate change and consider their role in
contributing to climate change as negligent or insignificant. However, it reflects results from
Pew research center (2015) on a Tanzanian sample and studies by American researchers
(Wacholz et al., 2014; Cordero et al., 2008) which find that respondents are highly
concerned about climate change. Climate change ranks 6/7 as the primary concern of
secondary school respondents, which reflects the trends noted in studies by Eisenack,
Tekken & Kropp (2007) and Lorenzoni & Pidgeon (2006) showing that while climate change
is considered important, it is comparatively of less concern than other issues.
5.3. Sources of climate change information (sub-question 3)
Students in the secondary school gather awareness and knowledge of climate change from
a broad range of sources, both inside and outside the classroom. The data presented in this
study, from both surveys and focus groups, identifies that more traditional mass media such
as TV, radio and newspapers/ magazines remain the most common ways to gather
information on climate change. This is consistent with studies conducted in sub-Saharan
Africa by Mwalukasa (2013), Ndhlovu (2016), Olayinka et al, (2013) and Luganda (2005)
41. 41
which identify that respondents rely most heavily on radio for climate change information
along with television, print media and personal observations. Despite the dominant role of
mass media, the education system is still a dominant source of information for secondary
school students. Finally, as observed from focus groups, local and traditional knowledge
plays an important part informing DUCE students about climate change, an aspect that is
cautioned by the Red Cross/ Red Crescent (2007) due to the increased variability of the
climate as a result of anthropogenic climate change. Finally, we can observe from focus
groups that social ties either virtual or in person are important information portals, a situation
also evident in Mwalukasa’s (2013, p269) study.
DUCE focus groups facilitated useful insights beyond simply identifying the sources of
information. In support of UNESCO (2014) research in this area, we can observe that social
media and the internet provides a portal for a large increase in the availability and frequency
of access to information sources about climate change. Crucially, students identify their use
of social media in particular when they are subject to real world climate threats such as
floods and use this medium to gain real-time, geographically appropriate information which is
highly relevant to them at any given time.
Observations from surveys and focus groups indicate that students often combine multiple
information sources in complex and situationally relevant ways. Taken together, surveys and
focus groups help to build a complex and rich picture of engagement with various sources of
information indicating the acquisition, sharing and re-sharing of information is highly
contextual.
5.4. Relationship between climate change knowledge, opinion and behavioural
change (research question)
5.4.1. Knowledge/ opinion and behavioural change
The results from the secondary school survey suggest that there is a strong relationship
between an increase in climate change knowledge and positive views on climate change
adaptation and mitigation, and similarly students who had learnt about climate change in
secondary school have considerably higher mean knowledge scores than those who hadn’t.
In addition, there is a significant positive correlation between an increase in age and grade
with an increase in knowledge scores, suggesting an increase in years of education
improves knowledge. These observation, on the surface, would appear to support what
Shove (2010) refers to as an ‘information deficit’ model under which there is a direct positive
42. 42
relationship between increased climate change knowledge and positive attitudes towards the
topic. This data also appears to conflict with research by Bandura (1997) and Campbell
(1963) who argue that increasing physical amounts of information disseminated to an
audience is comparatively ineffective at influencing behaviour.
However, this conclusion masks the complexity of this situation, as there is no uniform
relationship between attitudes, engagement with information and behavioural change
(Upham et al, 2009). Instead the information gathered from this study serve to support
research by Leiserowitz et al., (2005) who refers to the nuanced nature of changing
behaviour. We can see that the links between knowledge and opinion are most robust when
possible direct impacts are visible while there is little evidence of a connection between an
increase in climate change scientific knowledge and personal opinion.
This is supported by survey results which reveal a strong positive correlation between an
increase in knowledge of climate change impacts (direct connections to respondents, low
science content) and positive opinions, while there is a small negative relationship between
knowledge of climate change causes (largely science based) and positive opinions. There is
strong evidence from both secondary school surveys as well as focus groups, as argued by
Blake (2001) and Kollmuss & Agyeman (2002) that the path to instilling positive attitudes
towards behavioural change is not to simply teach more. Survey results show that
demographics and personal feelings have a role to play while there is a suggestion that
experiences (in the form of being directly affected by/ witnessing climate change impacts)
influence opinions, thus supporting research by Blake (2001). DUCE focus group
observations suggest that experiences, social networks and trust in institutions all have a
role in shaping a complex picture on a person’s outlook on the topic of climate change,
echoing Kollmuss & Agyeman’s findings (2002). In robust support of the idea that concern
about climate change can influence knowledge, secondary school students who identified
climate change as one of their top two concerns, returned much higher knowledge scores
than students who had not chosen this option. This serves to support the observation that
not only does knowledge influence opinion, but opinions also have an influence on
knowledge.
5.4.2. Sources of climate change information and behavioural change
Results from student surveys reveal that there is a significant relationship between some
sources of climate change information and increased climate change knowledge (table
4.11). Crucially, the sources which both secondary school students and DUCE students
43. 43
utilise the most (television, radio and internet/ social media) are those which have the
strongest relationship with higher knowledge scores. Furthermore, sources of information
that DUCE students identified as most trusted (TV/ radio) are also the sources which exhibit
the strongest correlations with higher knowledge scores.
There is no significant relationship between any source of information and opinions on
climate change, although the strongest associations between sources of information and
more positive opinions for sources of information which are most heavily utilised to gather
climate change information (radio, newspapers/ magazines, television, school). While
knowledge appears to have a strong influence on opinion, and sources of information have a
strong influence on knowledge, we do not see significant links between sources of
information and more positive opinions. This suggests that the most common sources of
climate change information deliver content that improves knowledge, but that this does not
translate into more positive attitudes. When all results are considered, it could be argued
from that opinions are influenced strongly by the type of information received as opposed to
the medium through which it is received.
5.4.3. Theories on knowledge acquisition
DUCE students appear to be taking personal ownership of their own knowledge building and
dissemination, thus engaging in personal creation of Sen’s (1993) capabilities approach
where they are personally choosing information which fits within the framework of what they
are able to do (share relevant information, act on that information if necessary/ able) and the
kind of life they are able to lead (adjust behaviour/ actions in response to this information).
Hart and colleagues (2012) argues that when disseminating information we need to take
account of what audiences have reason to value. From focus group transcripts we observe
that students assign this value themselves, before sharing with others, thus increasing the
effectiveness of that communication due to the relationship between the message bearer
and receiver as identified by Moser (2004).
In addition, it appears that focus group participants are engaging actively in Vygotsky’s
(1978) theory of social constructivism where they connect already acquired knowledge from
traditional media or education with new information and share it via dialogue and interaction
– which among contemporary Tanzanian youth can be achieved via social media. This
contemporary manifestation of social construction of knowledge reflects the research of
Surowiecki (2005). These considerations lead to the conclusion that social media can be a
repository of new and constantly updated information and it could be argued that social
44. 44
media can be a powerful avenue to communicate complex, ever evolving topics such as
climate change.
From the DUCE focus groups it becomes clear that participants are active in a process of
observational learning, an important aspect of knowledge acquisition as recognised in
Bandura’s 1989 study. This can be triangulated with secondary school students’ surveys
where aspects that students’ would be most likely to be directly witness to (floods,
deforestation etc.) are well understood.
5.5. Barriers to behavioural change
Acknowledging barriers to behavioural change among urban Tanzanian youth is important in
order to either avoid such pitfalls or to design communications which can overcome such
obstacles. Through analysis of questions on climate change attitudes and perceptions (table
4.4), there is little evidence that individual barriers identified by Kollmuss & Agyeman (2002),
Maiteny (2002) and Southerton et al (2011) such as scepticism, unaligned values,
disempowerment and lack of agency exist among the urban Tanzanian youth that were
assessed.
We can observe from focus groups that there does not appear to be a limited connection to
nature or any sense that the threat of climate change is psychologically distant as argued by
Jones et al. (2016) and Spence et al. (2012). Similarly, in contrast to research by Pruneau et
al. (2001), climate change impacts do not appear hidden or invisible, but are instead
connected to the lives of respondents.
There is some evidence that other barriers established by researchers (Kollmuss &
Agyeman, 2002; Maiteny, 2002; Southerton et al., 2011), play a role in behavioural dynamics
for urban Tanzanian youth in formal education. These include a lack of knowledge as shown
in the secondary school student surveys along with some degree of externalising
responsibilities which can be seen in table 4.4 of the student survey where students identify
other countries and entities as responsible for tackling climate change. Through focus
groups we can see that economic exclusion from accessing certain media sources and
distrust in information sources are barriers which should be accounted for. It is clear, as
supported by several studies (Gayford, 1998; Gayford, 2002; Rajeev Gowda et al., 1997),
that there are dynamics of trust in relation to various information sources. In comparison with
other studies which determine trust in information sources, this research returns similar
results to that of Mwalukasa (2013) where high levels of trust are placed in personal
45. 45
connections but is in contrast to a study by Buy’s and colleagues (2014) which identifies
government and the media as least trusted.
When results are considered collectively, it could be argued that while some barriers
certainly exist, urban Tanzanian youth in this study do not exhibit the disconnection from
nature, disconnection of values from environmental protection or a sense that they cannot
contribute to positive actions in tackling climate change that Maiteny (2002) recognises as
challenges to positive behaviours related to climate change.
5.6. Limitations and suggestions for further research
This research has a number of restraints which should be acknowledged. Firstly, there are
issues of external validity and transferability. Limitations in respect to the scope of research
subjects being constrained to within DUCE and its affiliated school may have a bearing on
the results and cannot be said to represent all urban youth in formal education in Tanzania,
as there may be certain factors which are unique to the sampled respondents. In addition,
this research was conducted among Tanzanian youth within the formal secondary and
tertiary education sector. As this demographic represents a relatively small percentage6
(Demographic & Health Survey, 2013) of the target age group, the results presented cannot
be attributed to all youth and indeed considerable differences in responses from youth
outside formal education may be expected. Issues of reverse causality may also be at play,
as, for example, we cannot determine with any certainty if knowledge has an impact on
opinion or vice versa. In light of these limitations, recommendations should be considered
suggestive and not prescriptive.
A number of suggestions for further research are offered. There is a recognition that a
broader scope is necessary in order to better contextualise the study. An increased focus
could be sought on the specific geo-political, economic and social structures at play at
DUCE, their affiliate schools, Dar es Salaam and indeed in Tanzania as a whole, all aspects
beyond the time and logistical capabilities of this study. Similar research outside the formal
education sector is required in order to draw comparisons with this study. Also, private
educational institutions at the secondary and tertiary level could be assessed. Longitudinal
research, where knowledge, opinion and sources of information are assessed over time in
comparison with a control group, would allow investigation of whether these factors change
over time with age, educational level, or other factors. This research does not seek to assess
6
The net enrolment rate in Tanzania for secondary education as of 2013 was 32% while the net
enrolment in tertiary education was 3.7%
46. 46
causality, however a more robust body of research on the relationship between
knowledge/opinion/sources of information and behavioural change related to climate change
would assist in moving closer to this aim. Finally, it is suggested that further research is
undertaken on the role of new media, particularly social media, and the role that this can
play in shaping behaviour, particularly in a sub-Saharan context where internet ready
phones are permeating urban environments at a rapid pace (Porter et al, 2016).
47. 47
6. Conclusion & Research Implications
From the results presented in surveys it is clear that students have some knowledge and
awareness of climate change, but that significant gaps exist. Such gaps are concentrated in
areas which could be deemed more scientific such as greenhouse gases, acid rain, the
ozone layer and fossil fuels, while students have a robust understanding of the impacts of
climate change which they are most directly influenced by. Despite knowledge gaps,
students’ are enthused by the topic of climate change, are eager to learn more about the
various aspects of the topic, and see themselves as positive agents in tackling climate
change. Results show that Students’ gather awareness and knowledge of climate change
from a broad range of sources, both inside and outside the classroom and that the
engagement with these sources of information is influenced by many factors.
Results indicate a strong positive relationship between increased knowledge and more
positive opinions on climate change, however additional evidence serves to blur the line
between this positive correlation. For example, improvements in knowledge of the causes of
climate change have a negative influence on opinion, while increased knowledge of climate
change impacts has a significant positive influence on opinion. In addition, it is clear that
understanding an individual’s capabilities and observational learning capacity related to
climate change should also be taken into account in communicating about climate change
with the intention to influence behaviour.
While the source of climate change information appears to be an important factor in
influencing knowledge, we also observe that the engagement with sources of climate change
information is dependent on many factors, while a broad range of sources are utilised under
different conditions. Opinions appear to be less influenced by some sources of information
than others. There is an indication that opinions are influenced strongly by the type of
information received as opposed to the medium through which it is received. Trust in the
information source also plays an important role.
The complexity of contemporary urban societies in developing countries, along with the
complexity of climate change issues itself, requires an approach to building positive
behaviours which is flexible and dynamic. The simplistic model where social change
depends on knowledge to change attitudes and values which result in behavioural change is
inadequate. Observations and results from this study support the conclusion that this model
fails to account for the vast complexity of human behaviour and the influences on it. As is
48. 48
evidenced in this study, many interlinking factors such as knowledge, experiences, feelings,
social networks, demographics, personal capabilities, attitudes and social norms all
contribute to a highly contextual environment for influencing behaviour on climate change.
While these factors can be observed to some extent in this study, understanding the
complexities of human behaviour and climate change is beyond the scope of this study and
requires further investigation.
The majority of the literature related to understanding knowledge, opinion and sources of
information on climate change are based in Western Society, while the links between these
aspects and behavioural change are seldom evaluated. This dissertation can contribute to a
better understanding of the influence of these individual aspects as well as contribute to
building a picture of how to contribute towards positive behavioural change. This research
could be utilised to inform public policy on climate change communication, as well as
curriculum development within formal education.
Observations from this study inform a suggestion that psychologists, scientists, educators
and the media work together to deliver relevant, timely information which can empower
citizens and equip them with the tools for both behavioural change towards mitigation and
also skills to allow for adaptation. By understanding the complexities, and accounting for the
contextual nuances between different audiences, communication and policy can be better
developed and tailored in order to transform knowledge into positive opinions and attitudes
and in turn engender behavioural change. While the urban Tanzanian youth that were the
target of this survey do not exhibit many of the typical barriers to behavioural change,
behavioural barriers are not stationary, and shift in time and space, and perhaps do so more
prominently in a rapidly growing, technologically advancing city such as Dar es Salaam.
The results presented in this research lead to the conclusion that a broad, dynamic and
flexible approach utilising many methods, approaches and media in a way which not only
provides information and knowledge but also equips youth with relevant skills, values and
principles to best cope with a future in which climate change is a dominant factor. In order to
successfully tackle climate change and adapt to its effects, youth in Tanzania will require
information to be disseminated using every available tool from a broad range of actors.
Behavioural change is undoubtedly hard to achieve, but it is possible. Behaviours are,
however, constantly changing, and for Tanzanian youth are being increasingly shaped by
the rapid uptake of new technologies such as internet ready mobile phones.