Slides 101-120
•
0 likes•77 views

This document contains images of candlestick charts with various candlestick patterns labeled, including: - High price gapping play and congestion band patterns on a 99 Cents Stores chart. - A gapping doji and questions about candlestick signals on an interactive chart. - A chart showing record session highs and an overbought/oversold indicator. - Charts highlighting three white soldiers, three black crows, rising three methods, and candles opening above and below the stomach.

Recommended
More Related Content
More from Joahim Van der Graff
Recently uploaded
Recently uploaded (20)
Slides 101-120
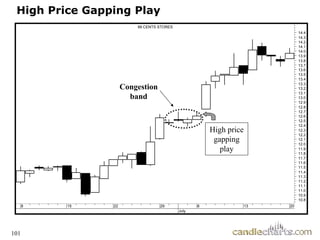
- 1. 101 High Price Gapping Play 8 15 22 29 July 6 13 20 10.8 10.9 11.0 11.1 11.2 11.3 11.4 11.5 11.6 11.7 11.8 11.9 12.0 12.1 12.2 12.3 12.4 12.5 12.6 12.7 12.8 12.9 13.0 13.1 13.2 13.3 13.4 13.5 13.6 13.7 13.8 13.9 14.0 14.1 14.2 14.3 14.4 99 CENTS STORES High priceHigh price gappinggapping playplay CongestionCongestion bandband
- 4. 104 Interactive Chart 1. What candle signals are at A and B? 2. What candle signals are at C and D? 3. Why did the rally stall at E and what was the candle signal formed? 4. After the decline from E why did the market find support near $18? A B C D E
- 5. 105 Interactive Chart - answers 1. What candle signals are at A and B? – Because of the trend neither are engulfing patterns. 2. What candle signals are at C and D? – Bullish engulfing pattern and a bullish counter- attack pattern 3. Why did the rally stall at E and what was the candle signal formed? –The falling window opened in early August. A bearish engulfing pattern 4. After the decline from E why did the market find support near $18?- The small rising window A B C D E Small rising window
- 6. 106 Record Sessions Overbought / Oversold Indicator low for movelow for move 11 22 33 44 55 66 77 88 999 record session highs9 record session highs 106
- 8. 108 Record session highs Start here 7 108
- 9. 109 Three Advancing White Soldiers
- 10. 110 Three White Soliders Three advancing soldiers 110
- 11. 111 Three White Soliders Advancing three soldiers 111
- 13. 113 Three Black Crows 8 25 2 July 9 16 23 30 August 6 13 20 27 4 September 10 24 25 26 27 28 29 30 31 32 33 34 35 36 37 38 39 40 41 42 43 44 45 46 47 48 49 50PULTE CORP (44.8600, 45.6600, 43.7600, 43.9000, -0.95000) 113
- 14. 114 Rising and Falling Three Methods Falling ThreeFalling ThreeRising ThreeRising Three 114
- 15. 115 Rising Three Methods 19 20 21 22 25 26 27 28 1 4 March 5 6 7 8 11 12 13 14 15 18 19 20 21 22 25 26 27 28 1 Ap 39.0 39.5 40.0 40.5 41.0 41.5 42.0 42.5 43.0 43.5 44.0 44.5 45.0 45.5 46.0 46.5 47.0 PHARMACIA 115
- 16. 116 Open below/above the Stomach Below Middle WhiteBelow Middle White close Above Middle BlackAbove Middle Black
- 17. 117 Open below the stomach 117