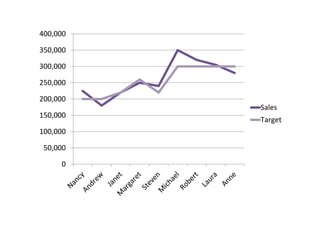
This bar graph shows sales figures for a company over a period of time. The y-axis ranges from 0 to 400,000 representing sales amounts. The x-axis is unlabeled but implies time periods or categories as the bar heights increase from left to right. A target sales level of 250,000 is indicated by a line.