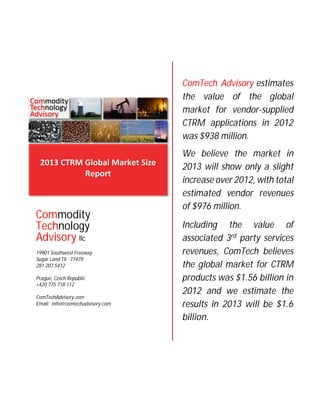
More Related Content Similar to CTRM Center - 2013 market-sizing Similar to CTRM Center - 2013 market-sizing (20) 1. ComTech Advisory estimates
the value of the global
market for vendor-supplied
CTRM applications in 2012
was $938 million.
Commodity
Technology
Advisory llc
19901 Southwest Freeway
Sugar Land TX 77479
281 207 5412
Prague, Czech Republic
+420 775 718 112
ComTechAdvisory.com
Email: info@comtechadvisory.com
We believe the market in
2013 will show only a slight
increase over 2012, with total
estimated vendor revenues
of $976 million.
Including the value of
associated 3rd party services
revenues, ComTech believes
the global market for CTRM
products was $1.56 billion in
2012 and we estimate the
results in 2013 will be $1.6
billion.
2. 1
modity
nology
2013 CTRM Global
Market Sizing Report
llc
Introduction and Scope
Commodity Technology Advisory (ComTech), the leading analyst firm covering commodity trading and risk
management (CTRM) technology markets, has recently completed an in-depth review of the CTRM market space in
order to compile an estimate of the size of the global CTRM technology markets, and the results of this analysis and
review are included in this report.
Readers of this report should be aware that in the development of this data, we have had to necessarily delineate
boundaries for the companies/applications that are reflected in this scope of the analysis.
‘CTRM’ is a term that has been widely adopted by many technology companies. “Traditional” CTRM vendors have
been expanding their reach outside of what has been widely accepted as core CTRM through acquisition of
applications what would commonly viewed as tools for managing and optimizing supply chains.
As such, for this report, ComTech has utilized a fairly rigid view of what capabilities are encompassed within the
bounds of CTRM. The included capabilities (and associated services) for this report are:
1) Physical and financial commodity deal capture and contract management,
2) Position management and valuation and,
3) Tracking/managing of commodities logistics as they apply to functionality commonly deployed as a
functional component of large scale CTRM solutions servicing gas, power, crude and bulk product
movements,
4) Settlement and accounting of deals/transactions, and
5) Trader analytics and trading optimization tools.
© 2013 Commodity Technology Advisory LLC
Houston TX and Prague CZ
3. 2
Products, functionality, and application modules excluded from this market sizing analysis include:
1) Logistical management capabilities not associated with core trading requirements, such as truck, rail or
ship tracking software,
2) Production modeling or optimization software for industries such as oil and gas production, mining or
agriculture,
3) Applications for managing physical facilities, such as power generation, mines, gas plants, pipelines,
refineries, mills or other processing plants, and
4) The modules or functional components of ERP applications (such as JDE, SAP and Oracle Financials) that
are not directly related to trading or commodity marketing activities,
5) Applications intended only to manage financial products (which may or may not include financial
commodities) and provide no capabilities for capturing, valuing or tracking physical commodities, and
6) Supply chain management and optimization applications that cannot capture, manage or value traded
commodities based upon their unique physical characteristics.
This CTRM market sizing study includes the following commodity classes: natural gas, power, oil and oil products,
coal, industrial metals, precious metals, agricultural commodities, softs, and others (including freight, RECs, and
other minor commodities).
Establishing a definitive size for any market, particularly one as complex as commodity trading and risk management,
is a difficult exercise and is impossible to complete with absolute certainty. Market sizing, being a forward looking
exercise, must be based upon numerous factors and assumptions, including overall economic conditions, forces
encouraging new market entrants, historical buying patterns of existing market participants, technology drivers
encouraging new purchases, and the number and capabilities of the product vendors available to meet the needs of
the market.
Despite these difficulties, we believe that our organization’s unique position in the market, that of highly experienced
analysts and market researchers focused exclusively on the intersection of the commodity trading markets and the
technologies that service those markets, provides us the market vision and insight necessary to compile a reliable
and accurate estimate of this unique and dynamic technology market.
Note: The market sizing figures presented in this study are our best estimates based on the methodology and
approach documented herein. They should be treated as estimates and are subject to change should additional
information become available.
© 2013 Commodity Technology Advisory LLC
Houston TX and Prague CZ
4. 3
Summary of Results – 2012/2013
ComTech estimates the value of the global market for vendor-supplied CTRM applications in 2012 was approximately
$938 million, comprised of $235 million in license sales, $455 million in services, $214 million in support and
maintenance, and $33 million in revenues associated with Total CTRM Market
2012
2013
$
235 $
237
SaaS deployed or hosted software. Based upon current Vendor License
Vendor Services
$
455 $
483
market conditions and estimated vendor results to date, we
Vendor S&M
$
214 $
219
believe the market in 2013 will show only a slight increase over SaaS/Hosted
$
33 $
38
2012, at total estimated vendor revenues of $976 million, with Third Party Implementation
$
355 $
358
$
269 $
267
most of the year-over-year increase associated with vendor Non-Vendor Solution
Total CTRM Market Value
$ 1,562 $
1,602
supplied services.
While vendor supplied software makes up the majority (in terms of available technology revenues) of the market for
CTRM applications, there still exists a not insubstantial number of companies that continue utilizing third party
consultants or internal IT staff, to develop and support their own custom solutions. ComTech estimates that these
bespoke solutions accounted
Total CTRM Market by Commodity by Geography - 2012
for approximately $269 million
North
South
Middle East
Total by
spent on the services of third
America
America
Europe
& Africa Asia/Pacific Commodity
party consultants in 2012, with Natural Gas
$
186 $
2 $
134 $
1 $
11 $
334
172
2
155
1
15
345
a majority of those dollars Power
Oil and Products
85
20
75
17
49
246
being spent on continuing NGLs
93
1
5
5
105
10
1
10
5
26
support and maintenance, Coal
Precious Metals
15
3
21
6
9
54
with the remaining being Other Metals and Ores
39
9
34
9
41
131
90
14
88
22
84
298
expended on development of Ags/Softs
Other (Freight, Emissions, Etc)
5
11
2
6
24
new applications.
These
Totals
$
696 $
53 $
527 $
61 $
226 $
1,563
estimates do not include costs
associated with customer resources assigned to the development or support of these bespoke applications (internal
costs).
Though adoption rates for vendor supported solutions will vary by industry segment and geography, ComTech does
forecast that vendor-supplied solutions will continue to see additional adoption and we believe the market for
custom developed or bespoke solutions will not show any appreciable growth from year-to-year for the foreseeable
future.
In addition to 3rd party consulting revenues associated with the development and support of bespoke functionality,
consultants and integrators also maintain a significant role in the implementation and support of vendor deployed
solutions. For purposes of this market sizing analysis, ComTech includes these dollars as part of the global CTRM
market size. For 2012, we believe some $355 million was spent by customers of vendor-supplied CTRM solutions
for the services of these 3rd party consultants to provide assistance during the selection, implementation and
integration of the newly acquired technologies. This estimate reflects a substantial increase in the last several years
as more customers of vendor supplied CTRM solutions are engaging with third parties to assist in their acquisition
and implementation projects. Additionally, with a number of very large projects having initiated over the last three
years (including several with licenses sales exceeding $30 million) which employ dozens of third party consultants,
we believe the expenditures for these consultants to be, on average, as much as 3 times the amount spent on vendor
supplied consulting resources.
Including these associated services revenues, ComTech believes the global market for CTRM products to be $1.56
billion in 2012 and are forecasting the results in 2013 to be $1.6 billion.
© 2013 Commodity Technology Advisory LLC
Houston TX and Prague CZ
5. 4
Market by Geography
Geographically, North America continues to be the largest market region for CTRM software solutions, with a mature
commodity trading market, particularly in power, natural gas, oil, coal, agricultural products and metals. While there
continues to be a number of companies that maintain non-vendor systems, a large majority of the market for CTRM
technology in North America is serviced by vendor-supplied and supported solutions.
Europe has also a mature market in commodity trading, though less than North America in terms of natural gas and
power. Western Europe, particularly the UK and Germany have established liquid markets for gas and power trading
and are relatively penetrated by commercial CTRM solutions. Eastern Europe is a rapidly emerging energy trading
market, though without full and consistent liberalization across the continent, the markets in individual countries
are relatively isolated in terms of trading activities and business practices. Given the relatively small size of these
markets, this localization has limited the adoption of vendor-supported CTRM applications as few vendors have been
willing or able to make the necessary investments in developing capabilities to address the unique local
requirements in each country; therefore, bespoke or internally developed CTRM is more common in the region.
Elsewhere in Europe, established global trading centers in other commodities, particularly in the UK, Switzerland,
and the Netherlands have a long history in trading
agricultural products, softs, and oil; and penetration
2012 CTRM Market Share by Geography
by commercially supported CTRM systems is
relatively high.
4%
14%
The Asia-Pacific region, driven by high demand for
45%
commodities to meet rapidly expanding economies
has become an increasingly active market for CTRM
vendors, particularly those for managing oil and oil
34%
products, agriculturals, softs and industrial metals
and ores. Within the last several years, CTRM
3%
vendors have found success selling products into
North America
South America
Europe
Middle East & Africa
the Singapore and Hong Kong markets, with
Asia/Pacific
national oil companies and large metals and
agricultural trading companies being particularly active buyers of vendor systems. However, given cultural and
language differences outside of the major trading centers in the region, western-oriented CTRM vendors have had
difficulties selling their products within the borders of the largest economies in the region, particularly China and
Japan, and these markets are still dominated by custom developed solutions.
Advertisement
© 2013 Commodity Technology Advisory LLC
Houston TX and Prague CZ
6. 5
Market Outlook and Study Assumptions
The following assumptions were utilized in the development of the forward looking market analysis:
Growth estimates reflects current consensus outlook for global economic growth of 2-3% per year for the
foreseeable future.
All data 2012 dollars – there has been no adjustments for inflation or currency exchange rate changes over
the period 2013 to 2018.
ComTech currently believes the global market for CTRM licenses (including ASP/SaaS) will grow, on average,
approximately 5% per year from 2013 to 2018
o Traditionally installed software license sales will grow by approximately four percent per year
during that period.
o Growth in ASP/SaaS will be approximately 13-15% over the study, exceeding that of traditional
license growth.
Growth from 2012 to 2013 primarily reflects backlog of services associated with several exceptional sized
deals done in late 2012. Based on 2013 results compiled at the time of this analysis, we anticipate 2013
license sales to show little or no growth vs. 2012.
Despite our current forecast assumptions, there exist a number of potential market developments that could
impact the outlook for the CTRM market in the coming years. Should global market growth exceed current forecast
assumptions, the following market segments could show higher than forecast growth.
Agricultural markets and Consumer Package Goods (CPG) – Increasing price volatility and growing
awareness of the value of trading-centric solutions (driven in part by CTRM vendors) for direct, indirect and
cross-commodity hedging could accelerate adoption of CTRM capabilities/solutions.
Trading companies and fuels intensive industries, including transportation and logistics companies,
processing companies – Increased demand for oil and products could lead to higher prices/volatilities and
could increase demand for CTRM technology solutions as new entrants enter the markets and existing
participants seek to improve risk visibility and/or grow via increasing trading volumes or by entering new
markets.
Mining – Mining has been in decline since mid-year 2012. However a strong increase in demand for metals,
ores and coal could lead to increased mine development and a subsequent increase in demand for CTRM
solutions in this segment, particularly in Australia, South America and Africa.
Base metals and concentrates – economic upturn will increase demand and increase price volatilities in
non-precious metals trading/processing, attracting new market participants particularly in the traditional
market trading centers in Europe and in the import centric markets in the Asia Pacific region.
Should full market liberalization in the European Union energy markets occur prior to 2017, growth in
demand for CTRM products in that market could exceed 10%/year post liberalization; however the current
outlook does not support full opening of the EUR energy markets prior to 2018.
© 2013 Commodity Technology Advisory LLC
Houston TX and Prague CZ
7. 6
5-Year Market Outlook
In developing our outlook for the global CTRM markets, we reviewed the current and perspective market by
commodities, geographies and industrial market segments; developing our topside outlook of the market based
upon this more granular review. Overall, we anticipate the total global CTRM market will grow by 4-6%, with our
estimates reflecting a midrange
value of 5%. Within the revenue
components that comprise this
market, we anticipate that
traditional installed software
license sales will grow at modest
rate of 3-4%, while increasing
adoption of SaaS or “Cloud” based
solutions will see growth rates
from 13-15%. Despite this high
growth rate, traditionally installed
solutions will continue to
dominate the market for the
foreseeable future.
Regional Review
$Millions
The “Energy Renaissance” in North America is having a significant impact on prices and volatilities for both natural
gas and power, reducing trading activities across virtually all industry segments and limiting the entrance of new
market participants.
Given that the
Total CTRM Market by Commodity by Geography - 2012
future outlook for
$200
natural gas prices is
$180
flat
to
today’s
$160
$140
market, it is very
$120
unlikely that this
$100
market will see
$80
much in the way of
$60
$40
increased demand
$20
for CTRM solutions
$for natural gas or
North America
South America
Europe
Middle East & Africa
Asia/Pacific
power during the
Natural Gas
Power
Oil and Products
study period. Most
NGLs
Coal
Precious Metals
sales of new licenses
Other Metals and Ores
Ags/Softs
Other (Freight, Emissions, Etc)
for the energy
centric market (including oil, products and coal) in North America will be for replacement of existing vendor
supported systems that have been in production for five or more years, and for expansion licenses due to organic
business growth. Non-energy CTRM license sales do show more promise for growth as we are seeing increasing
adoption of CTRM for managing price and operational risks in the supply chains of agricultural, CPG and metals
intensive industries. We expect growth in these markets will continue, contributing to an overall growth rate in the
North American market on par with the global average of approximately 5%.
© 2013 Commodity Technology Advisory LLC
Houston TX and Prague CZ
8. 7
Europe is continuing to face difficulties in their banking markets and much of the continent has been battling
economic recession since the global financial crisis of 2008. While there are indications that there may be an
economic recovery in the offing, a number of factors (including continuing debt issues in several countries,
insufficient capital for trade finance, delayed opening of the liberalized energy markets, and a regulatory
environment that is still unsettled) are creating headwinds that we believe will limit the growth of the European
CTRM markets to less than 5% through 2018.
Despite indications that Chinese economic growth may be slowing, economic growth in the Asia-Pacific region is
expected to remain high in comparison to the rest of the world, and the region will continue to see increasing
demand for all commodities. This demand growth, coupled with Increasing adoption of solutions for managing
market and operational risks, will result in increasing demand for CTRM technologies, particularly those for managing
exposures along the global supply chains in agriculturals, metals and oil products. We believe the growth rate for
CTRM in the region will average 7-10% during the next 5 years, exceeding that in other areas.
While CTRM deals will continue to occur in South America, it has not yet matured into a predictable and reliable
market place for CTRM technologies. As much of the regions commodities markets are export oriented, and limited
and very uneven economic growth (relative to other global economic regions) does not indicate an expansion of
trading activities within the continent, we do not see significant prospects for growth in the CTRM markets in the
region for the next several years.
Advertisement
© 2013 Commodity Technology Advisory LLC
Houston TX and Prague CZ
9. 8
Market by Segment
In terms of market segments, we anticipate the prospects for growth in any individual segment will be dependent
upon their location and commodity requirements.
Total CTRM Market Value by Industry Segment by Year
$300
$250
$Millions
Banks and financial institutions,
particularly in North America
and Europe, have been
impacted by new regulations
and will show little or no growth
in CTRM demand over the
period; and though hedge
funds have returned to the
markets in limited numbers
after the financial crash of
2008, few are buying vendor
supported systems and we see
little indications that they will
soon be buying in any large
number.
$200
$150
$100
$50
$-
Energy merchants and traders,
2012
2013
2014
2015
2016
2017
2018
despite the lackluster gas and
power markets in North
America, are continuing to make investments in new CTRM technology solutions, including replacement systems
and expansion of existing solutions. Continuing volatility in oil and oil products prices have also brought new traders
into the markets and this market has been fairly robust over the last several years, particularly in the Asia-Pacific
region. Smaller oil trading companies have also been active buyers of CTRM solutions over the last couple of years,
particularly SaaS deployed solutions.
Despite low prices of natural gas in North America, both regional and global scale oil and gas producers have
continued to invest in CTRM solutions, though potentially at a reduced pace as compared to previous years. As
producers have moved their focus from gas to more lucrative liquids (oil and NGLs), these companies have had to
spend to improve their trading and management systems as their market exposures in these commodities has
Advertisement
© 2013 Commodity Technology Advisory LLC
Houston TX and Prague CZ
10. 9
grown. Additionally, midstream operators, those providing production gathering, processing and sometimes
marketing services to producers are making substantial investments in new facilities and infrastructure as
exploration and production has expanded into new areas.
Utilities, including both power and natural gas, will continue to spend dollars to upgrade and maintain their trading
capabilities, though the rate of growth for those expenditures is expected to small.
Several large Agricultural and CPG companies have committed to very large CTRM deals (with licenses value of more
than $10 million) in the last three years; however, as previously noted, ComTech believes these size of deals are an
exception and we do not believe deals of this scale will become the norm in this market. Results through YTD 2013
indicate that while the number of deals done in these market segments will increase (increased penetration) it is
unlikely that deals with a license value of greater than $10 million of deals will be signed at a pace that we’ve seen
in the last few years. Nonetheless, we believe the number of deals in these market segments will increase and the
value of those deals will offset the reduced per deal value, resulting in year-over-year increases greater than the 5%
average for the broader CTRM category.
The global metals markets began slowing in 2012 as demand declined in part to a slowing of the Chinese economic
growth. Through most of 2013 the market had not fully revered, though most market analysts believe the outlook
for an improved metals market is strong. ComTech believe the metals trading markets will perform on average with
the global CTRM markets, at about 5% per year.
Within the last decade, the market has increasing seen the rise of trading companies that have expanded their focus
from a single commodity or single class of commodities (such as energy, ags, softs, metals) and are now trading a
broader portfolios of commodities. These companies, most global in the scale of their trading, may be most identified
with a particular class of commodity, (such as Cargill in agricultural commodities), they are in fact also trading a much
broader array of commodities. For this “multi-class” market segment, we anticipate the growth rate will be on par
with the market average, approximately 5% per year through 2018.
© 2013 Commodity Technology Advisory LLC
Houston TX and Prague CZ
11. 10
Market by Commodity
$Millions
Both natural gas and power-centric CTRM markets are primarily focused in North America and Europe, where active
trading of the commodities is fairly widespread. Within the last couple of years, there have been sales of power and
gas capable systems in the Asia-Pacific region, primarily to utilities and producers; however these sales have been
the exception for
these
types
of
Total CTRM Market by Commodity
systems. Given that
Inc. Vendor Revs, 3rd Party Implementation and Unaddressed
the North American
Market
natural gas prices are
$500
anticipated to remain
$450
low
for
the
$400
$350
foreseeable future and
$300
that
power
$250
(increasingly fueled by
$200
natural gas) prices are
$150
also
expected
to
$100
$50
remain
low,
the
$outlook for growth in
Natural
Power
Oil and
NGLs
Coal
Precious
Other
Ags/Softs
Other
Gas
Products
Metals Metals and
(Freight,
CTRM for these two
Ores
Emissions,
commodities is for
Etc)
growth to be less than
2012
2013
2014
2015
2016
2017
2018
3% over the next 5
years.
Oil and oil products are widely traded around the globe and the overall demand and supply balance continues to be
relatively tight, yielding prices consistently above $100/bbl amid moderate volatility. These conditions, combined
with increasing demand for products in Asia-Pacific continue to support active trading in the commodity and support
a continuing market outlook for growth of slightly more than 5% for CTRM technology serving that commodity
segment.
CTRM for NGL trading, which is almost entirely centric to the North American market, has seen an strong increase
in the last three to four years as massive increases in natural gas product has led to a boom in infrastructure
development and strong growth in the midstream of the market. With the development of new gas processing plants
and strong growth by producers holding liquids rich gas assets, the demand for NGL capable systems has increased
significantly during the last couple of year. However, as infrastructure been developed in the new producing regions,
and natural gas prices are anticipated to remain low, the outlook for continued growth in NGLs is limited and we
believe beyond 2013, the market will see less than a 5% increase year over year.
Coal producers and traders are feeling the effects of a declining market for coal for power generation, particularly
in the US and Europe where environmental regulations are accelerating the closing of coal fired facilities and are
effectively killing new construction. Though large coal fired projects continue to be developed in China and other
areas of Asia Pacific, the global demand for steam coal is declining. Given these conditions we anticipate that there
will be no increase in demand for coal centric CTRM products for some time.
CTRM for precious metals is a highly variable market from year to year, driven primarily by both the price and
volatility of the gold markets. With higher prices and increasing volatility of gold, we would expect to see strong
© 2013 Commodity Technology Advisory LLC
Houston TX and Prague CZ
12. 11
growth in CTRM for precious metals; however, as gold prices are driven by a number of influences outside of physical
supply and demand, it is difficult to forecast future performance of this market. Nonetheless we do believe, based
on past performance, that this commodity segment will produce a slight increase in demand (less than 3%) through
2018.
As previously noted, demand for industrial metals has softened over the last 18 months. We are however forecasting
growth in CTRM for metals and ores to increase by about 5% per year as market conditions for industrial
consumption of iron, steel, and alloys improves.
Continuing demand for agricultural products, including many softs, will help maintain prices and volatilities.
Additionally, increasing adoption of CTRM products by agricultural and CPG market players will drive provide good
market growth rates for technology. We anticipate that sales of CTRM capable systems will remain high as
agricultural centric market participants continue to adopt to these systems to better manage price, currency, credit
and operational risk associated with their long, global supply chains. In all, we anticipate growth in this commodity
segment will average 7-8% over the next 5 years.
© 2013 Commodity Technology Advisory LLC
Houston TX and Prague CZ
13. 12
Discussion of Report Methodology
To arrive at this market sizing estimate, ComTech utilized “a bottom-up” review of all known vendors of production
solutions and tools that meet the previously discussed criteria of CTRM technologies. While there are numerous
vendors around the globe that do provide qualified (as it relates to this analysis) CTRM solutions, many of those
companies also provide products and associated services that fall outside the established criteria, and those
revenues have be excluded from this analysis.
In developing the bottom up estimate related to CTRM vendor revenues, more than 90 companies were reviewed
and most had some or all of their revenues included in the final CTRM Vendor Market Size Estimate. The companies
reviewed included (but are not necessarily limited to) the following:
Abacus
Agiboo
Agrosirius
Albedo Energy Consulting
Allegro
Amphora
Ascend Analytics
Aspect
Brady
C Square International
Calvus
Calypso
CDA
CMS
ComFin
Contigo
Cultura
Delta Energy
DMS
Egar
EGAR
EKA
EMK3
EnCompass
Energeya
Energy Solutions International
Ensite
Ensyte Energy Solutions
Entero
Entrion
Enuit
E-Opt
Eximware
FEA
FinLogik
Fortech
Gen10
GMSL
HighSoftware
Hivedome
House of Code
Imagine Software
Infinite
InvenSoft Technologies
IPESoft Spol sro
IPSystems Ltd
iRely
iRisk
JustCommodity
Kiodynos
Kisters
Klafka & Hinz
Kyos energy Consulting
Lacima
Latitude
Lloret Data Solutions
Logaviv
Molecule Software
Murex
Nexant
OATI
Open Link
PCI
Pioneer
Progress Software
Progressive
QuantRisk
Quorum Business Solutions
SAP
SASRiskAdvisory
Sisu
SoftSmiths
Spectrum Prime
Square Four
SquareFour sa
SunGard
Superderivatives
System Advisors
Tegos
Temenos
TradePaq
Transgraph
Transition Technologies
Triple Point
Utiligroup
Ventyx
Vesion
Waterfield Energy Software
Wellpoint Systems
Woodlands Solutions
For each known vendor of CTRM systems, research was conducted (including direct contact with many of the
vendors) to obtain:
An estimate of vendor revenues and license revenues for 2012. A very small number of E/CTRM vendors
are public companies and disclose some information as part of their regulatory reporting requirements.
Additionally, several E/CTRM vendors, though private, have provided this information to our company
under terms of confidentially or, more rarely, do occasionally disclose the information publically via press
release or other announcements. Utilizing these actual and estimated revenues, along with known and
© 2013 Commodity Technology Advisory LLC
Houston TX and Prague CZ
14. 13
estimated headcount numbers, ComTech then generated a number of reliable reference points and ratios
for analyzing other vendors for which we had less visibility.
One of the primary ratios utilized in estimating any particular vendor’s revenues was the "revenue per
headcount" estimate. In our analysis of metrics provided by vendors or garnered through other sources,
the actual revenue per headcount figure ranged from $50,000 to $230,000 per employee. This variances in
this metric was correlated to a number of factors, though the primary influences were geographic location
of the employees and level of specialization of the vendor.
Based on an analysis of the entirety of this data, revenue
estimates can be accurately established for all vendors
known to provide qualified solutions in the market.
Assumptions were then made for each vendor regarding
the allocations of those revenues amongst 4 categories:
1) traditional license revenues, 2) SaaS/Hosted license
revenues, 2) services revenues, and 4) revenues
associated with support and maintenance agreements.
Total CTRM Market
Vendor License
Vendor Services
Vendor S&M
SaaS/Hosted
Third Party Implementation
Non-Vendor Solution
$
$
$
$
$
$
Total CTRM Market Value
$
2012
235
455
214
33
355
269
$
$
$
$
$
$
2013
237
483
219
38
358
267
1,562 $
1,602
In addition to the identified and known vendors of CTRM products, we have made the assumption that there exists
some number of vendors that are unknown to us. While ComTech Advisory analysts are highly experienced in this
market, we cannot assume that every vendor, particularly those that operate in very localized markets (particularly
in the Asia Pacific and Eastern European/Russian markets), will be known outside their local areas. Therefore, we
have included a relatively small
Global CTRM Market Revenue - Vendor Only
amount of revenue (less than 5% of
$1,400
the global total) to account for these
entities.
$1,200
$1,000
$Millions
In order to determine a total market
spend for CTRM technologies, it is
$600
also important to account for the
dollars spent with consultants and
$400
system integrators outside those
$200
provided by the vendors of the
$technologies. We have observed a
2012
2013
2014
2015
2016
2017
2018
clear trend by most market
License
Saas/Hosted
Vendor Services
Support & Maintenance
participants to engage such 3rd party
services in almost all new product
implementations, and an increasing number of upgrade and other support-related projects. Utilizing the results of
a number of different research paths, we have established the value of these 3rd party services related to the initial
implementation of CTRM solutions as $355 million in 2012.
$800
Additionally, we have established a value of custom developed or bespoke solutions (non-vendor) produced and
delivered by third party consultants at $269 million for 2012. This value represents the portion of the market that
has chosen to deploy custom developed solutions despite there being commercially available software that could
meet many or most of their requirements. While this portion of the market is sizeable, representing about 17% of
© 2013 Commodity Technology Advisory LLC
Houston TX and Prague CZ
15. 14
CTRM Vendor Revenue by Commodity
$1,400
$1,200
$1,000
$Millions
the total market, and
there will certainly
always be companies
that feel they have
unique requirements
that
cannot
be
adequately addressed
by vendors solutions,
the
increasing
penetration
of
commercial
CTRM
solutions will result in
no appreciable growth
in this market.
$800
$600
$400
$200
$2012
2013
2014
2015
2016
2017
2018
Power
Oil and Products
NGLs
Coal
Precious Metals
Other Metals and Ores
© 2013 Commodity Technology Advisory LLC
Natural Gas
Ags/Softs
Other (Freight, Emissions, Etc)
Houston TX and Prague CZ
16. 15
Appendix
Market Size Detail – 2012 thru 2018
Note: Differences in annual market size totals amongst the following data is related to rounding errors
and/or “model noise”.
Total CTRM Market Value by Revenue Component
Vendor License
Vendor Services
Vendor S&M
SaaS/Hosted
Third Party Implementation
Non-Vendor Solution
Total
$
$
$
$
$
$
2012
235
455
214
33
355
269
$
$
$
$
$
$
$
2013
237
483
219
38
358
267
1,562 $
$
$
$
$
$
$
2014
244
507
229
45
369
268
1,602 $
$
$
$
$
$
$
2015
251
532
240
54
380
268
1,662 $
2016
259
559
250
63
392
270
$
$
$
$
$
$
1,725 $
$
$
$
$
$
$
1,792 $
2017
266
587
262
75
404
270
$
$
$
$
$
$
2018
274
616
273
88
419
270
1,864 $
1,941
Total Market Value by Segment - Vendor Revs, Third Party Implimentation, Unaddressed Market
2012
Financial Cos.
Energy Merchants/ Traders
O&G Producers
O&G Midstream
Power Utilities
Refiners, Distributors, Processors
Gas Utilities/ LDC
Energy Retailers
C&I Energy Consumers
Ag Traders
Food and Bev (inc. Processors)
Ag Producers
Mining
Metals Traders
Multi-Class Traders
Total
$
$
$
$
$
$
$
$
$
$
$
$
$
$
$
$
2013
93
209
181
98
193
113
35
25
54
152
139
64
44
79
85
1,564
$
$
$
$
$
$
$
$
$
$
$
$
$
$
$
$
2014
93
214
184
101
190
119
35
25
56
163
145
63
46
76
95
1,603
$
$
$
$
$
$
$
$
$
$
$
$
$
$
$
$
2015
93
224
186
100
188
125
36
26
59
172
145
76
48
81
106
1,663
$
$
$
$
$
$
$
$
$
$
$
$
$
$
$
$
2016
93
231
185
103
190
131
37
27
62
182
157
80
49
86
115
1,726
$
$
$
$
$
$
$
$
$
$
$
$
$
$
$
$
2017
93
241
187
106
193
137
37
27
66
194
162
86
51
91
125
1,795
$
$
$
$
$
$
$
$
$
$
$
$
$
$
$
$
93
250
191
106
195
142
38
28
70
206
172
93
53
97
133
1,866
2018
$
$
$
$
$
$
$
$
$
$
$
$
$
$
$
$
93
258
199
110
197
147
39
29
75
216
187
92
55
102
144
1,943
Total Market Value by Commodity - Vendor Revs, Third Party Implimentation, Unaddressed Market
2012
335
346
252
106
26
52
129
$
$
$
$
$
$
$
2015
334
349
300
118
25
59
155
Ags/Softs
Other (Freight, Emissions, Etc)
$
$
291 $
26 $
307 $
27 $
329 $
29 $
353 $
31 $
$
1,562 $
1,602 $
1,662 $
1,725 $
© 2013 Commodity Technology Advisory LLC
$
$
$
$
$
$
$
2014
332
347
283
115
25
57
145
$
$
$
$
$
$
$
Total
$
$
$
$
$
$
$
2013
329
344
267
112
26
54
136
Natural Gas
Power
Oil and Products
NGLs
Coal
Precious Metals
Other Metals and Ores
$
$
$
$
$
$
$
2016
337
353
318
120
25
62
166
$
$
$
$
$
$
$
2018
345
357
357
125
25
68
191
380 $
33 $
408 $
34 $
438
37
1,793 $
1,866 $
1,944
$
$
$
$
$
$
$
2017
341
355
337
122
25
65
179
Houston TX and Prague CZ
17. 16
Commodity Technology Advisory
Commodity Technology Advisory is the leading analyst organization covering the Energy and Commodity Trading and Risk
Management (E/CTRM) technology markets. We provide invaluable insights, backed by primary research and years of experience,
into the issues and trends affecting both the users and providers of the applications and services that are crucial for success in
markets constantly roiled by globalization, regulation and innovation.
Patrick Reames – Managing Director and Founder
Dr. Gary M. Vasey – Managing Director and Partner
Mr. Reames possess a deep understanding of the energy
and commodities markets, developed through hands-on
experience and managerial oversight of energy and
commodity operations, including exploration, production,
gathering, plant and pipeline operations. Additionally, he
has 5 years of energy commodity trading, transportation,
and risk management experience with Hess Corp. (formally
known as Amerada Hess), a Fortune 100 integrated energymarketing company.
Dr. Vasey is an industry expert noted for his analysis,
consulting, marketing, and branding skills. With over 29years’ experience in the energy and commodities trading
industry, Gary has experienced the industry’s volatility as an
executive of a trading firm, geologist, consultant, software
developer, analyst, and marketing practitioner, providing
him with unique insights, not just into the entire value
chain, but also into how to position, brand, and deliver
products and services to the industry.
Over the last fifteen years, he has been focused primarily
on information technology serving energy and commodity
trading, marketing, and risk management. Prior to founding
Commodity Technology Advisory, he led the
CommodityPoint division of UtiliPoint International,
providing expert CTRM market analysis and advisory
services to dozens of clients in North America, Europe and
the Asia/Pacific region. Prior to joining UtiliPoint
International in 2005, he held senior executive positions
with several technology companies (including TransEnergy
Management, Altra Energy, and TradeWell Systems)
servicing the energy and commodity markets.
Gary was most recently Executive Director of a PanEuropean power trading firm. Prior to that, he led
CommodityPoint as co-Managing Director and is a noted
expert on the commodity trading, transaction and risk
management software industry and an accomplished
industry analyst and thought leader.
An acknowledged expert in market analysis and advisory,
he is a frequent speaker at industry conferences and events,
has published numerous articles in industry publications
and is an often quoted expert in news stories. He is the coauthor (with Dr. Gary Vasey) of the books “Selecting and
Implementing Energy Trading, Transaction and Risk
Management Software – A Primer” and “Trends in Energy
Trading, Transaction and Risk Management Software –
Second Edition”.
Mr. Reames holds a B.S. in Business Administration –
Finance from Oklahoma State University.
Gary has published more than 200 articles on energy and
commodities industry trends in a variety of publications, is
a regular speaker at industry conferences, and is the coauthor of the books Trends in Energy Trading, Transaction
and Risk Management Software – A Primer and Selecting
and Implementing ETRM Software – A Primer (with Patrick
Reames). He also contributed two chapters to The
Professional Risk Managers‘ Guide to Energy and
Environmental Markets published by PRMIA and two
chapters, co-written with Peter C. Fusaro, to Weather,
Energy and Environmental Hedging – An Introduction (ICFAI
University Press, 2007) edited by Amando F C Da Silva.
Gary is also the co-author of Energy & Environmental Hedge
Funds – The New Investment Paradigm (Wiley, 2006) with
Peter C. Fusaro, and of many trade press articles on hedge
funds in the energy, commodities and environmental
industry.
__________________________________________________________________________________________
19901 Southwest Freeway
Sugar Land TX 77479
281 207 5412
Prague, Czech Republic
+420 775 718 112
ComTechAdvisory.com
Email: info@comtechadvisory.com
© 2013 Commodity Technology Advisory LLC
Houston TX and Prague CZ