Patel NP Time-Motion Study Final version 5-2-16 72x423
1. Time-Motion Study of Health Assistant Activities in Tucson Unified
School District Elementary Schools
N. Patel1, J. Van Buren1, A.A. Lowe1, A.G. Pongratz1, M. Moore1,2, N. Stefan2, D. Johnson2, L.B. Gerald1, J.K. Gerald1
INTRODUCTION
METHODS
Population: Twenty Tucson Unified School District elementary
schools were randomized to immediate or delayed intervention.
Each school employed 1 full-time health assistant who was
supervised by a school nurse.
Procedures:
o Direct observation of health assistants’ activities by 4
undergraduate public health interns
o half in immediate / half in delayed intervention group
o half in Year 1 / half in Year 2
o Observation of all SAMS participants’ health office visits
Variables:
o Time devoted to clinical care, administration, and
communication activities
o Time spent providing asthma-related maintenance and
symptom-driven care
Analysis:
o Comparisons of means were made using T-tests and
comparisons of proportions using Chi-square tests
o Pearson’s correlations between school enrollment and time
spent on various activities by category
RESULTS CONT… CONCLUSIONS
AFFILIATIONS & DISCLOSURES
1. University of Arizona
2. Tucson Unified School District
The authors have no disclosures or conflicts to report.
Funding sources: NHLBI 1R18HL110858, Merck Sharp & Dohme
Corp., and Thayer Medical.
LIMITATIONS
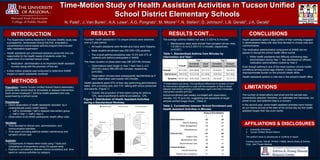
Figure 1. Distribution of Health Assistant Activities
during a Standardized Workday
Fourteen health assistants in 13 unique schools were observed
over a 2 year period.
o All health assistants were female and many were Hispanic.
o Mean student enrollment was 452 (SD=129) students.
o The overall asthma prevalence was 12.3% and 31% of
students with asthma participated in SAMS.
The mean duration of observation was 389 (SD=36) minutes.
o Observations were longer in Year 1 than Year 2, 412
(SD=34) versus 366 (SD=20) minutes, respectively
(p=0.002).
o Observation minutes were subsequently standardized as if
each observation was exactly 420 minutes.
Health assistants spent 57% of their day performing administrative
tasks, 32% providing care, and 11% talking with school personnel
and parents. (Figure 1)
o Overall, the proportion of time spent caring for asthma,
12%, was proportional to asthma prevalence, 12%.
Health assistants spent a large portion of their workday engaged
in administrative tasks with less time devoted to clinical care and
communication.
The medication administration component of SAMS did not
appear to disrupt the school health office routine.
o While health assistants had difficulty scheduling daily
administration during Year 1, they developed an efficient
medication administration routine by Year 2.
Even though asthma is one of the most common chronic health
conditions among school-age children, it does not place
disproportionate burden on the school’s health office.
Health assistants perform a vital role in the school’s health office.
o The Supervised Asthma Medicine in Schools (SAMS) study was
a prospective, randomized clinical trial that evaluated a
comprehensive school-based asthma program that included
daily medication supervision.
o Health assistants are unlicensed assistive personnel who are
responsible for the health needs of students under the
supervision of a licensed school nurse.
o Medication administration is an important health assistant
function along with the provision of first aid.
o A time-motion analysis was conducted to determine SAMS’
impact on health assistants’ workload.
The number of observations was small and the sample was
conveniently selected; therefore, our estimates are imprecise, our
power is low, and selection bias is a concern.
In the second year, some health assistant activities were missed
as our interns arrived at the start of the school day but the health
assistant began their day even earlier.
RESULTS
School Enrollment
r p
Administration -.22 .35
Record-Keeping -.02 .92
Office Management -.28 .24
Miscellaneous -.02 .92
Clinical Care -.01 .98
Urgent Care .43 .06
Maintenance Care -.09 .71
Social Service Care -.34 .14
Communication .40 .08
School Personnel .31 .18
Parents and Caregivers .37 .10
Table 2. Correlations between School Enrollment and
Health Assistant Activities in Minutes
Overall*
Year 1 Year 2
Immediate
Intervention
Usual
Care†
Immediate
Intervention
Delayed
Intervention
Overall 16.1 (16) 28.9 (28.8) 9.7 (7.1) 13.4 (6.2) 12.8 (6.6)
Maintenance 9.6 (7.8) 14.3 (11.6) 5.1 (5.8) 6.9 (4.3) 12.1 (5.6)
Symptom 6.6 (11.0) 14.6 (19.3) 4.6 (7.3) 6.5 (4.2)† 0.7 (1.1)†
*5 observations per group; †no significant differences in duration of care
for intervention assignment or year with the exception of Year 2 where
delayed intervention schools provided less urgent care than immediate
intervention schools (p=0.02).
Table 1. Standardized Asthma Care Minutes by
Intervention and Year.*
The average asthma-related visit was 2.3 (SD=4.3) minutes.
o Maintenance visits were shorter than symptom-driven visits,
1.8 (SD=1.4) vs 9.2 (SD=13.1) minutes, respectively
(p<0.001).
School enrollment was weakly correlated with observation
minutes, r=0.19 (p=0.42), suggesting that assistants at larger
schools worked longer hours. (Table 2)