
Recommended
Recommended
More Related Content
Featured
Featured (20)
Stats Distribution Industrial Markets
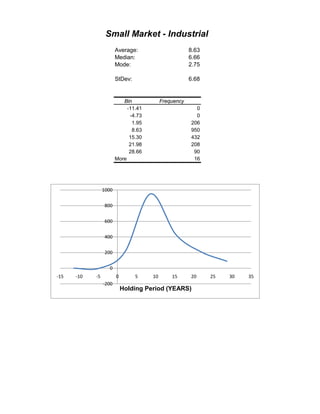
- 1. Average: Median: Mode: StDev: Bin -11.41 -4.73 1.95 8.63 15.30 21.98 28.66 More Small Market - Industrial 8.63 6.66 2.75 6.68 206 950 432 208 90 16 Frequency 0 0 -200 0 200 400 600 800 1000 -15 -10 -5 0 5 10 15 20 25 30 35 Holding Period (YEARS)
- 2. Average: Median: Mode: StDev: Bin -10.40 -4.31 1.79 7.89 13.99 20.08 26.18 More 7.89 6.33 2.42 23 8 4 Frequency 0 0 26 119 62 6.10 Middle Market - Industrial -20 0 20 40 60 80 100 120 140 -15 -10 -5 0 5 10 15 20 25 30 Holding Period (YEARS)
- 3. Average: Median: Mode: STDEV: Bin -18.99 -10.77 -2.55 5.66 13.88 22.10 30.32 More 14 2 1 0 1 5.66 2.38 #N/A 8.22 Large Market - Industrial Frequency 0 0 0 -2 0 2 4 6 8 10 12 14 16 -30.00 -20.00 -10.00 0.00 10.00 20.00 30.00 40.00 Holding Period (YEARS)